Data point selection for weighted least square fitting of cavity decay time constant
He Xing1, 2, 3, Yan Hu1, 2, 3, Dong Li-Zhi1, 2, Yang Ping1, 2, Xu Bing1, 2, †, 
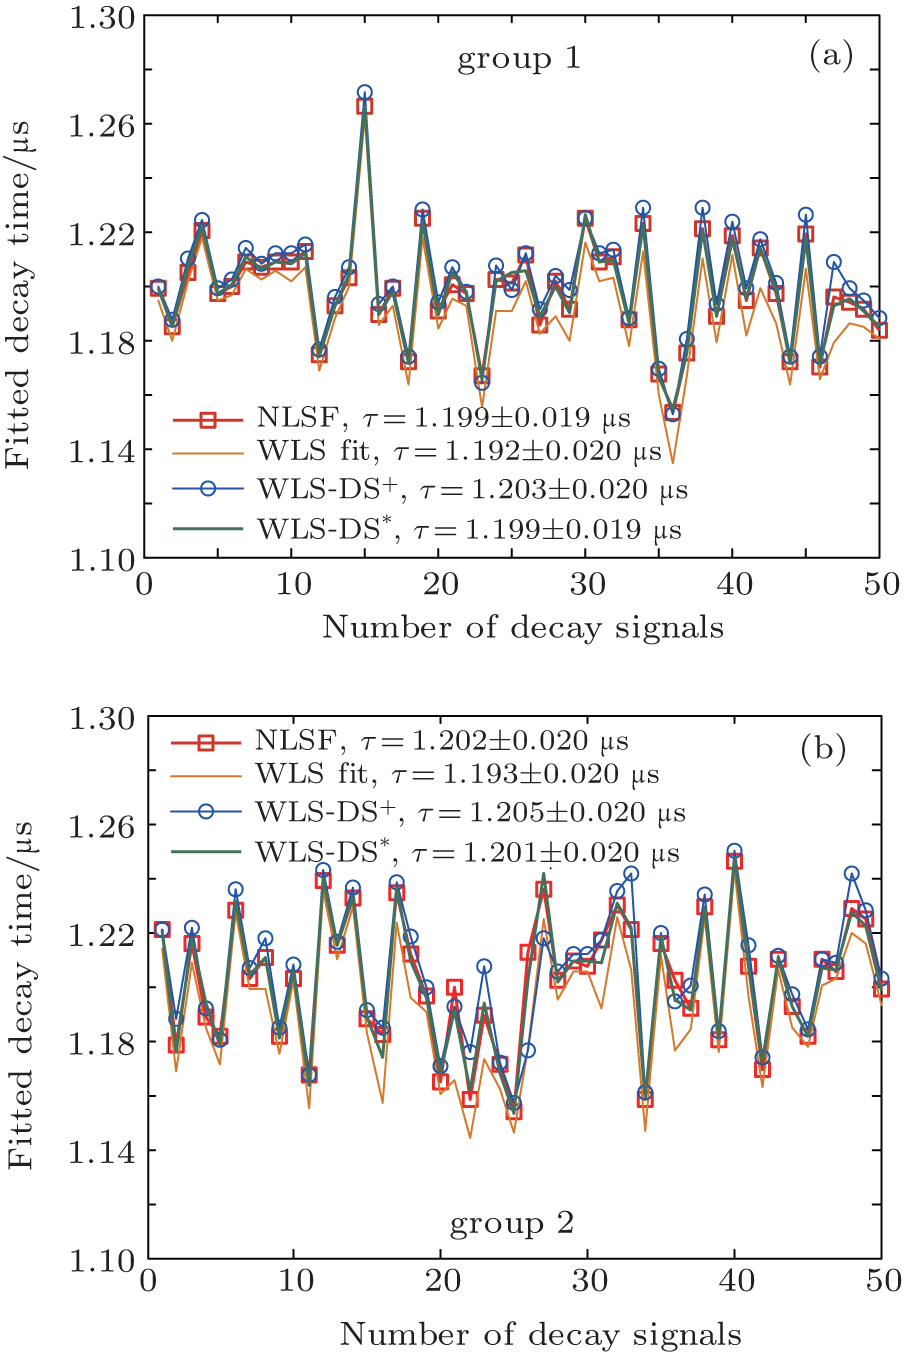
Fitting results of experiment. There are two notes in this figure. Note that the+means that the results of this curve are obtained by the WLS-DS method with