

Study on bi-directional pedestrian movement using ant algorithms
[Gokce Sibel , Kayacan Ozhan †,  ]
]
]
|
|


† Corresponding author. E-mail:
A cellular automata model is proposed to simulate bi-directional pedestrian flow. Pedestrian movement is investigated by using ant algorithms. Ants communicate with each other by dropping a chemical, called a pheromone, on the substrate while crawling forward. Similarly, it is considered that oppositely moving pedestrians drop ‘visual pheromones’ on their way and the visual pheromones might cause attractive or repulsive interactions. This pheromenon is introduced into modelling the pedestrians’ walking preference. In this way, the decision-making process of pedestrians will be based on ‘the instinct of following’. At some densities, the relationships of velocity–density and flux–density are analyzed for different evaporation rates of visual pheromones. Lane formation and phase transition are observed for certain evaporation rates of visual pheromones.
The pedestrian dynamics has been investigated by using three methods: social force model (SFM), continuum model (CM), and cellular automaton model.
The SFM, which is based on the Newtonian mechanics, is one of the well-known microscopic simulation models for describing the pedestrian dynamics. [ 1 – 10 ] This model was first introduced by Helbing. It describes specific situations like arching, lane formation, clogging, and the faster-is-slower effect observed in pedestrian traffic.
The CM, which has been used for the macroscopic modeling of pedestrian flow, uses the analogy between the pedestrians and the molecules in fluid. [ 11 – 16 ] The speed, density, and flow of the pedestrians can be studied by this model. Hughes presented a theoretical mechanism for the motion of large pedestrian crowds and made a comparison of the stability of confusion between subcritical and supercritical regimes. [ 11 ]
Burks studied biological reproduction and crystal growth in the late 1940s. [ 17 ] Since then cellular automata has been commonly used to model complexities in various areas such as traffic, [ 18 – 32 ] biology, [ 33 ] and fluid dynamics. [ 34 ] Cellular automata, being an idealized version of a complex system, is composed of a large number of cells. They communicate with each other by using only a small fraction of the other components without a central controller. [ 35 ] Basically, a CA model consists of a regular grid of cells and each cell is assumed to be in one of a finite number of states. It is discretized into a finite number of steps, and the current state of a cell is determined from the states of its neighbors. Von Neumann and Moore neighborhood approximations have been commonly used in computer simulations. The von Neumann neighborhood comprises the four cells orthogonally surrounding a central cell on a two-dimensional square lattice (north, south, west, east). While the Moore neighbourhood is a set of cells that are orthogonally or diagonally-adjacent to the region of interest and consists of the eight cells immediately surrounding it (north, south, west, east, north-east, north-west, south-east, south-west).
The applicability of CA has been successfully demonstrated in vehicular flow simulation. One-dimensional [ 18 – 23 ] and two-dimensional [ 24 – 32 ] models have been used to study the traffic flow. CA has also been used to account for the human behaviors in pedestrian flow simulation. [ 36 – 42 ] Burstedde et al . investigated the parameters (e.g. density of pedestrians) in a CA model and showed that a transition from a stable flow phase to a complete jamming takes place by using a two-dimensional CA model. [ 43 ] Another approach based on human behavior and stochastic analysis was proposed by Yuan and Tan. [ 44 ] Zhou et al . investigated the influence of smoke on pedestrians’ movement under fire. [ 45 ] The lane formation is similar to the bi-directional pedestrian flow; two groups of people have different destinations, try to minimize colliding with others, and move in opposite directions. It occurs in situations when there is no left or right walking lane. The phenomenon of the lane formation that is mostly associated with counterflow has been studied earlier. [ 13 , 46 – 48 ]
Ants are social organisms like humans, therefore their behaviors can be compared to humans’ in a manner. [ 49 ] In this study, considering this anology, we invesitgate human behaviors by CA simulations using the ant communication techniques. For some ant species, the key parameter of communication is a hormone, called pheromone, and as is well-known, pheromones evaporate. [ 50 – 52 ] We suggest in this paper that each person will drop a ‘visual pheromone’ on the floor and after a while the most preferred routes will have an ‘attractive force’ for the other people moving in the same direction. As the ant pheromones do, the visual pheromone also evaporates with time. If people pass through a certain site frequently, then this prevents the visual pheromone on it from evaporating and the possibility that a person chooses this site increases. On the other hand, if people pass through a certain site rarely, the visual pheromone on it evaporates with some probability and the possibility that a person chooses this site decreases. Shiwakoti et al. examined how pedestrian movement studies can be used to explain the collective behaviour of other biological entities to design a safe evacuation scenerio, [ 53 ] and to answer whether a vigorous model can be developed to explain the collective behaviors of different biological entities in spite of the difference in their size, speed, and other biological features. They proposed a mathematical model based on the approach that is used to describe animal dynamics to simulate the collective traffic. [ 54 ]
Two distinct behaviors are observed in the lane formation: following and avoidance. In the previous studies, [ 43 , 55 , 56 ] following and avoidance behaviors are simulated with the dynamic and anticipation floor fields, respectively. Instead, in this study, we propose the visual pheromones for the following and avoidance phenomena. The following behavior is provided by the attractive pheromone, while avoidance is ensured by the repellent pheromone.
It is worthwhile noting that some ant species such as Pharaoh’s ants have mainly two types of pheromones: [ 57 ] attractive and repellent. The attractive pheromone is used as a memory for organizing foraging. The repellent pheromone means no entry. This fact makes the ants avoid going to unrewarding paths in rewarding trail sections. [ 57 ] Similarly, in our model, when walking in a crowded area, pedestrians tend to follow the others moving in the same direction and keep away from oncomers to avoid having to face off with them. These features are included in our model in such a way that pedestrians moving in opposite directions drop different types of pheromones. If a pedestrian encounters the same type of visual pheromone that he has, then this pheromone plays an attractive role; otherwise it plays a repellent role. By considering this, how the movement of a pedestrian is affected by the combined use of attractive and repellent pheromones is demonstrated.
Kayacan studied a theoretical model of uni-directional ant traffic, motivated by the motion of ants and considered two different types of ants, one of which smells very well and the other does not. [ 58 ] The flux of ants was investigated as a function of the probability of the evaporation rate of a pheromone. A model that is similar to the Nagel–Schreckenberg (NaSch) model in which the asymmetrical exclusion rule is employed instead of the exclusion rule was developed. [ 59 ] The unidirectional ant traffic flow with a U-turn in an ant trail was investigated by using a one-dimensional cellular automata model. [ 60 ] In this study, the bi-directional pedestrian movement is investigated by using the ant algorithm.
The rest of this paper is organized as follows. In Section 2, the model is given. This is followed by a discussion of the dependences of flux and mean velocity on the evaporation rate in Section 3. In Section 4, the model and its conclusions are summarized.
The underlying structure is a two-dimensional system which consists of an L × L -cell grid. Here L defines the system size and is taken as L = 41. Besides, L = 20 and 60 are set to show lane formation in different size systems.
Each cell can be either empty or occupied by only one pedestrian. All pedestrians move synchronously and they can move by only one cell per time-step.
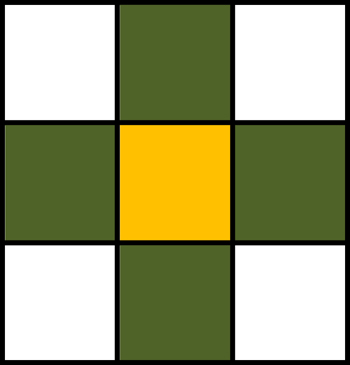
In CA, occupying cells are localized according to neighborhood rules of occupancy. The von Neumann neighbourhood that comprises four cells orthogonally surrounding a central cell on a two-dimensional square lattice (north, south, west, east) is used in our simulations (Fig.
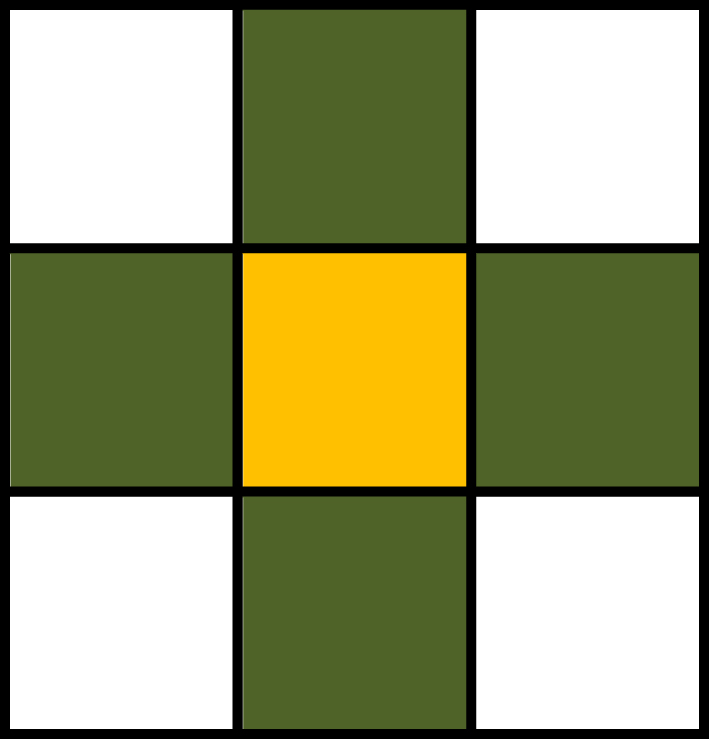 | Fig. 1. Von Neumann neighborhood. |
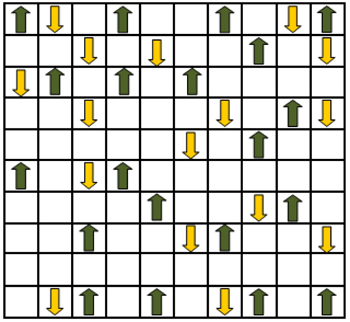
The number of lanes in a bidirectional pedestrian traffic depends on the density of walkers and the width of the corridor. The simulations are carried out in a square corridor, which is populated by two species of pedestrians, i.e., the top-down walkers and the bottom-up walkers (Fig.
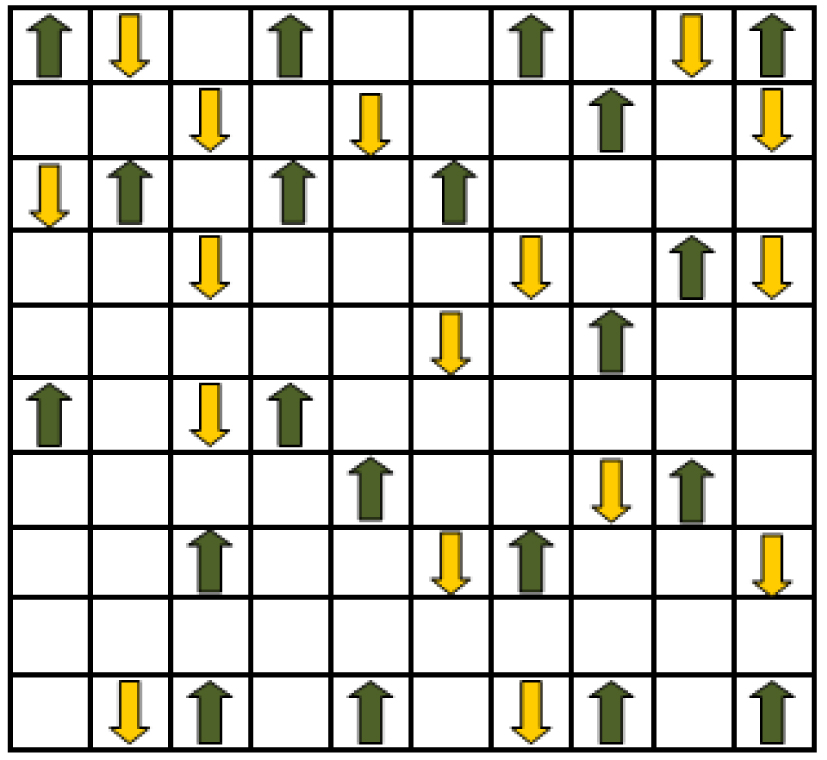 | Fig. 2. Schematic diagram of the top-down and the bottom-up walkers’ moving; the top-down walkers are illustrated by yellow arrows and the others are illustrated by green arrows. |
In Fig.
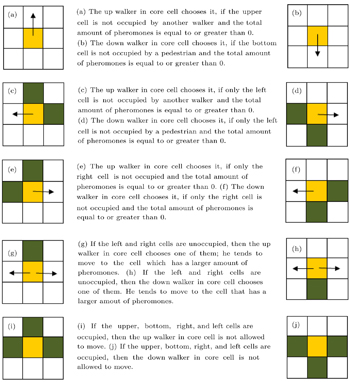
The update procedure is synchronous and the state of the system is updated at each time step in two stages. All pedestrians are allowed to move and the positions { S ( t + 1)} are obtained at time t + 1 by using the old configuration { S ( t ), p ( t )} in the first stage. Here S and p refer to the pedestrian and the visual pheromone, respectively. In the second stage, the pheromone is allowed to evaporate and p ( t ) is updated. Finally, the new configuration { S ( t + 1), p ( t + 1)} at time t + 1 is obtained. In the first stage, the route choice occurs according to the possible configurations illustrated in Fig.
 | Fig. 3. All possible configurations of the up and down walkers in the core cell moving up and down, respectively. The arrow from the core cell shows the possible direction in which the pedestrian may select to move. Green indicates that the cell is occupied by a pedestrian. |
| Table 1. Movement probabilities calculated as a function of repellent and attractive pheromones. . |
The probability of a movement is determined by the total amount of pheromones. That is, to investigate the movement of the bottom-up walkers, it is assumed that pheromone 1 belongs to the bottom-up walkers and pheromone 2 belongs to the top-down walkers. In the same way, to investigate the movement of the top-down walkers, it is assumed that pheromone 1 belongs to the top-down walkers and pheromone 2 belongs to the bottom-up walkers. In general, pheromone 1 is considered as being attractive and pheromone 2 is considered as being repellent in the model.
The movement probabilities are summarized in Table
Pheromones are evaporative chemicals, so they will gradually decrease according to the following rules: at each site that is occupied by a pedestrian after the first stage, a pheromone is dropped, i.e., if S i ( t + 1) = 1, then p i ( t + 1) = 1. However, if S i ( t + 1) = 0, then the pheromone evaporates with the probability f given below:

According to the model, whenever a site is occupied by a pedestrian, the pheromone at that site is set to be p i ( t + 1) = 1; however, when a site is not occupied by a pedestrian, the value of the pheromone at time t + 1 decreases by −0.5 with the probability f .
The pedestrians tend to avoid contacting other pedestrians that are moving toward different desired walking directions. Lane formation is an effect that pedestrians move off spontaneously in view of their desired walking directions and follow the others who move in the same direction. We use the same order parameter that has been previously used. [ 55 , 61 ]
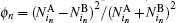
The numbers of N L and N O of oppositely charged particles are counted by each particle and then ϕ n = ( N L − N O ) 2 / N L + N O ) 2 is assigned to each particle. The average ⟨ ϕ n ⟩ gives the global order parameter. [ 55 ] The numbers 

This notion is framed in our model, and 


Three distinct phases have been observed in extensive emprical studies in recent years, namely, the free flow phase, the synchronized phase, and the jammed phase. [ 62 , 63 ] In the free flow phase, interactions are rare and the flow and the mean velocity increase linearly as a function of density. There are three types of synchronized traffic. [ 63 – 67 ] (i) Stationary and homogeneous states: the density and the flow are fixed for a long period. (ii) Homogeneous-in-speed states: the density and the flow curves look similar, but the mean velocity is reduced compared with that of the free flow. (iii) Nonstationary and nonhomogeneous states: irregular patterns of the flow are observed. In the jammed phase, the flow and the mean velocity decrease with increasing density.
The flux is the most important parameter of a flow and it depends on the density and the mean velocity, i.e., F = ρV , where
Figure
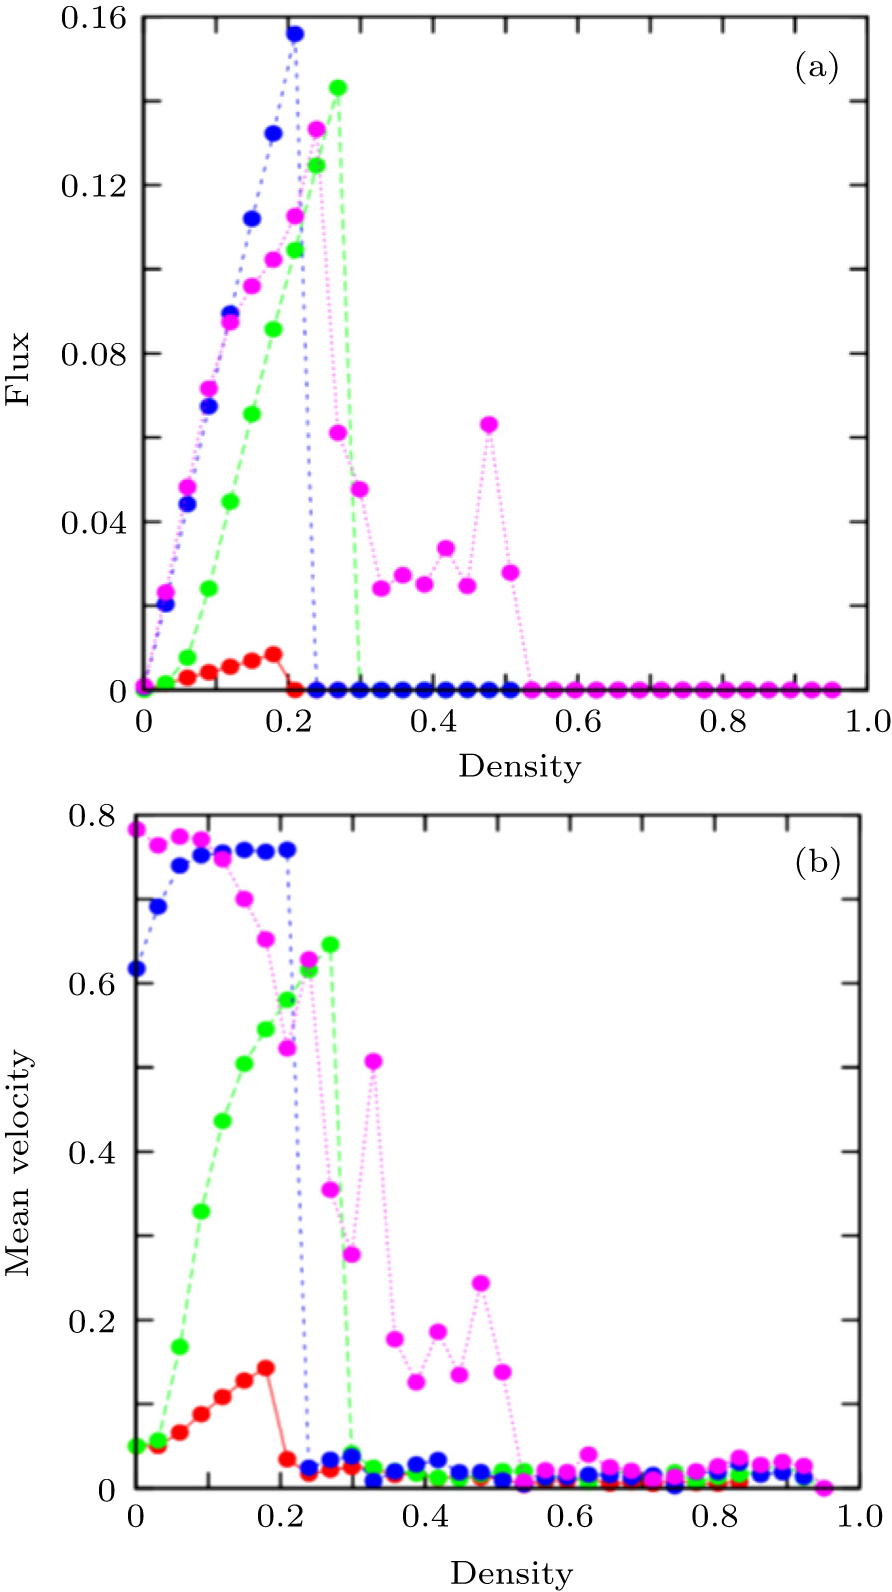 | Fig. 4. (a) The mean flux and (b) the mean velocity versus the density ρ for pheromone evaporation rates of 0.1 (red), 0.01 (green), 0.001 (blue), and 0.0001 (pink). |
In Fig.
Consistently, our simulations show some phase transitions between these phases. The first transition is from the free flow to the synchronized (homogeneous-in-speed state) flow ( ρ = 0.12). Opposing walkers begin to block each other and the mean velocity is reduced. The second one is from the synchronized (homogeneous-in-speed state) flow to the jammed phase ( ρ = 0.27). The flow and the mean velocity curves decrease with increasing density. The f = 0.01 indicates that the evaporation rate of pheromones is slower than that at f = 0.1. It means that a walker can reach the site before the pheromones evaporate and the walkers can move to neighboorhood sites up to higher densities of walkers. At f = 0.001, there are more marked increases in the mean velocity and the flux with increasing density until ρ = 0.23. After this critical density, a sudden decrease is observed again and a jammed phase takes place. On the other hand, it is very interesting to note that although the evaporation rate f = 0.001 is slower than f = 0.01 and the flux and the velocity assume higher values, the jammed phase occurs at a lower density for f = 0.001. The reason could be the increase in the amount of pheromones. When the evaporation rate decreases, both attractive and repellent pheromones increase in the corridor. This causes an acceleration of lane formation and the jammed phase is observed at a lower density because pedestrians follow some others who move in the same direction and avoid contacting other pedestrians. For f = 0.1, 0.01, and 0.001, all curves indicate that the down and up walkers can move freely in the region ρ < ρ critic , while a jam takes place in the region of ρ > ρ critic . As for f = 0.0001, the flux first increases to a maximum until ρ = 0.24 is reached and then shows a sudden decrease to a certain value but not to zero. After this decrease, the flux fluctuates around a mean value until ρ ≈ 0.5. A very similar behavior is seen in the mean velocity: it begins to decrease from a maximum value and then fluctuates until ρ ≈ 0.5. The spread and interference of the up and down walkers with other lanes and the local jams of the system can cause the fluctuations in flux and velocity. In pedestrian movement, usually, the interactions among pedestrians tend to hinder each other’s motion so the mean velocity of the pedestrians decreases monotonically with increasing density. [ 68 – 71 ] On the contrary, in our model, the mean velocity varies non-monotonically with density over a wide range of f because of the coupling of the movement probability with the visual pheromone. The non-monotonic variation of the mean velocity with density causes the unusual shape of the flux curve: the pheromones in the cells can make the mean velocity fluctuate and the flux evolve parallelly to it.
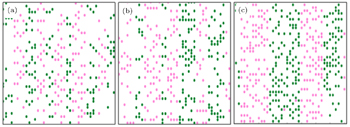
The bi-directional pedestrian configuration after establishing the equilibrium is illustrated in Figs.
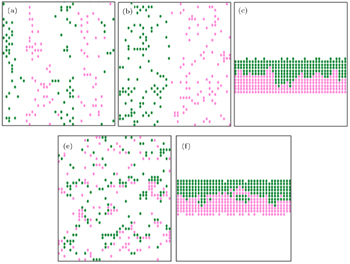
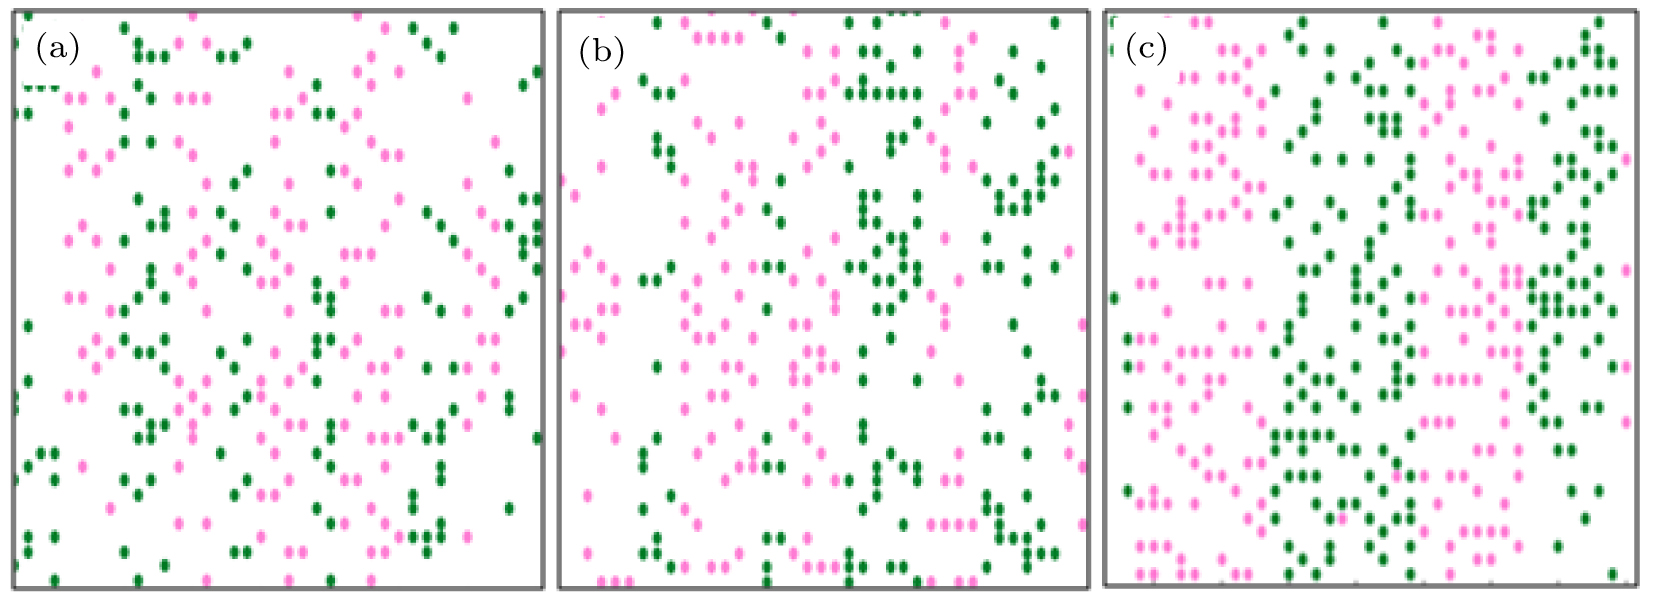 | Fig. 5. Simulation results of the bi-directional pedestrian movement for f = 0.001. The numbers of up and down walkers are equal: (a) 141, (b) 151, (c) 196. The green circles represent down walkers and the pink circles indicate up walkers. |
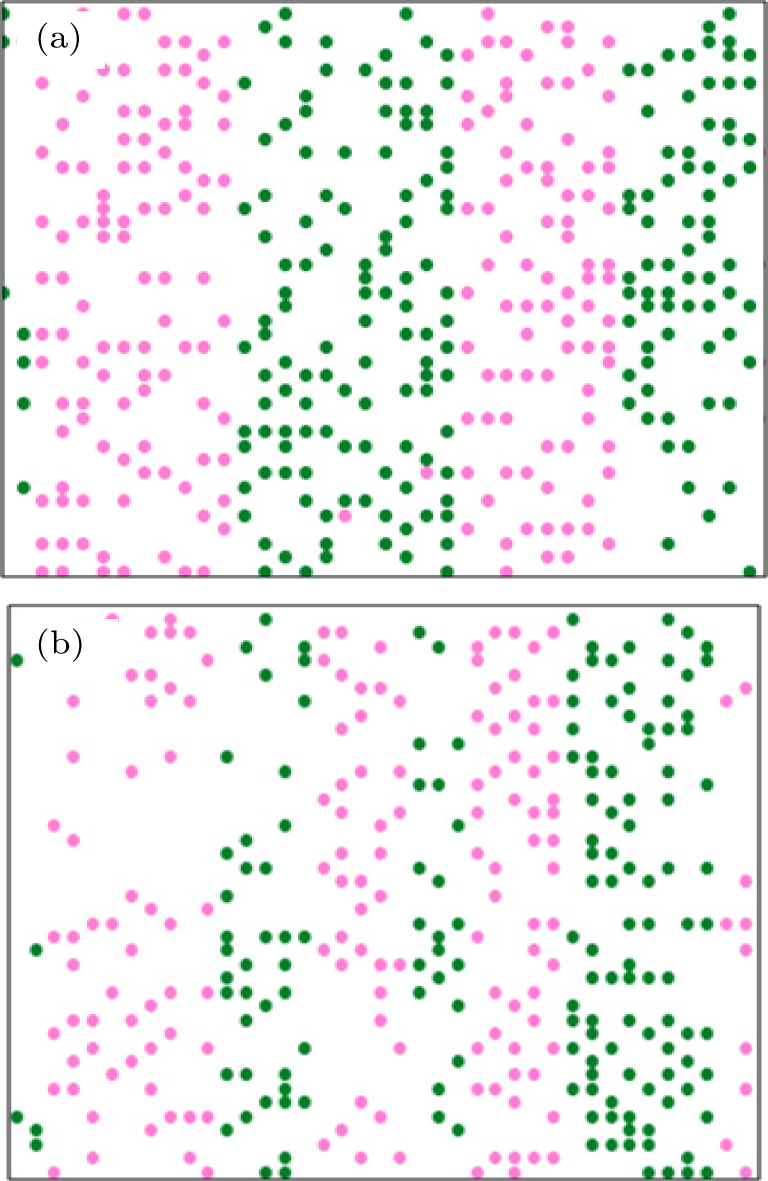
 | Fig. 6. Simulation results of the bi-directional pedestrian movement for (a)–(c) f = 0.01 and (d), (e) f = 0.1 with the numbers of up walkers of (a) 66, (b) 76, (c) 221, (d) 151, and (e) 226. The number of down walkers equals that of up walkers. The green circles represent down walkers and the pink circles indicate up walkers. |
Figures
It is observed that the lanes are stable for some time and then merge or split as the density increases. Figure
 | Fig. 7. Influences of only two pedestrians entering into the corridor on the collective behavior of pedestrians for f = 0.001 with the numbers of up-walkers of (a) 196 and (b) 197. The number of down walkers equals that of up walkers. |
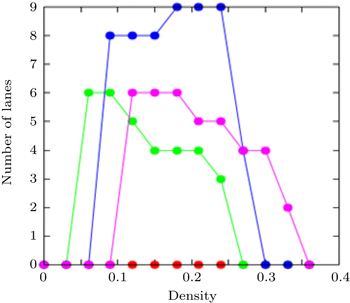
Figure
 | Fig. 8. Dependences of number of lanes on density ρ for pheromone evaporation rate f of 0.1 (red), 0.01 (green), 0.001 (blue), and 0.0001 (pink). |
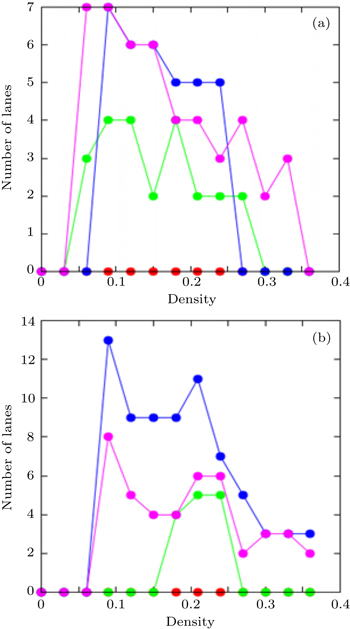
Figure
 | Fig. 9. Dependences of number of lanes on density ρ for pheromone evaporation rate f of 0.1 (red), 0.01 (green), 0.001 (blue), and 0.0001 (pink). |
The number of lanes is mainly determined by the system size and the number of pedestrians. According to the models presented in Refs.[ 70 ] and [ 71 ], when the total density is low, the pedestrians move freely and the system seems to be self-organized into several lanes with increasing density. If there are no jammed areas, it is possible to say that the higher the density, the lower the probability that new lanes are formed. Conversely, in our model, as the density increases, the formation of new lanes is possible. The number of lanes is also related to the pheromone evaporation rate: the interaction between pedestrians is provided by the attractive and repellent pheromones and due to this relation, the number of lanes could increase with increasing density.
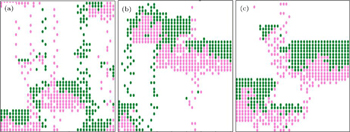
Two groups of pedestrians mutually block each other. The bi-directional pedestrian configuration is shown in Fig.
 | Fig. 10. Bi-directional pedestrian configurations for f = 0.0001 with the numbers of up-walkers of (a) 500, (b) 550, and (c) 600. The number of down walkers equals that of up walkers. |
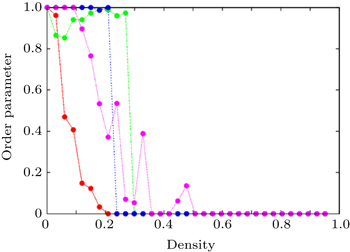
Figure
 | Fig. 11. Dependences of order parameter on density ρ for pheromone evaporation rate f of 0.1 (red), 0.01 (green), 0.001 (blue), and 0.0001 (pink). |
The order parameter of a system depends on the distance from a cluster to the next cluster ahead: [ 55 ] the shorter the distance, the lagrer the order parameter. Generally, the transition from a disordered state to a state with almost perfect lanes is possible with increasing density. As for our model, the evaporation rate specifies the survival probability of the visual pheromone dropped by the rearmost pedestrian of the cluster in front, so it also controls the order parameter as seen in Fig.
In this paper, the bi-directional pedestrian movement in a corridor is investigated by using cellular automata simulations. Ants communicate with each other by dropping a chemical, called a pheromone, on the substrate. As ants do, pedestrians will drop a ‘visual pheromone’ on the way. It is shown that the visual pheromone can lead to lane formation. Two distinct behaviors are considered: following and avoidance. The following behavior, which enables a walker to arrive at his target earlier, is provided by the attractive pheromone. As to the avoidance behavior, which is more relevant to the lane formation than the following behavior, is ensured by the repellent pheromone. The dependences of the flux and the mean velocity on the evaporation rate of visual pheromones are investigated. At some densities, the relationships of velocity–density and flux–density are analyzed for different evoporation rates of visual pheromones. It is shown that for some evaporation rates, the bi-directional pedestrian traffic in the corridor undergoes two phase transitions, from the free phase to the synchronized phase and from the synchronized phase to the jammed phase. Moreover, it is shown that for a certain evaporation rate of visual pheromones, the increase of the number of pedestrians in the corridor leads to the decrease in the number of lanes and to the increase in the width of each lane.
Compared with the previous floor field model, the proposed model based on the consept of a visual pheromone indicates the similar effects on the lane formation. The attractive and repellent pheromones play the same roles as the dynamic and anticipation floor fields, respectively. To the best of our knowledge, it is the first time that the lane formation pedestrian traffic is investigated by considering visual attractive and repellent pheromones. It can be predicted that the technique developed here can be extended to other models related to simulations of pedestrian traffic.
| 1 | |
| 2 | |
| 3 | |
| 4 | |
| 5 | |
| 6 | |
| 7 | |
| 8 | |
| 9 | |
| 10 | |
| 11 | |
| 12 | |
| 13 | |
| 14 | |
| 15 | |
| 16 | |
| 17 | |
| 18 | |
| 19 | |
| 20 | |
| 21 | |
| 22 | |
| 23 | |
| 24 | |
| 25 | |
| 26 | |
| 27 | |
| 28 | |
| 29 | |
| 30 | |
| 31 | |
| 32 | |
| 33 | |
| 34 | |
| 35 | |
| 36 | |
| 37 | |
| 38 | |
| 39 | |
| 40 | |
| 41 | |
| 42 | |
| 43 | |
| 44 | |
| 45 | |
| 46 | |
| 47 | |
| 48 | |
| 49 | |
| 50 | |
| 51 | |
| 52 | |
| 53 | |
| 54 | |
| 55 | |
| 56 | |
| 57 | |
| 58 | |
| 59 | |
| 60 | |
| 61 | |
| 62 | |
| 63 | |
| 64 | |
| 65 | |
| 66 | |
| 67 | |
| 68 | |
| 69 | |
| 70 | |
| 71 |