1. Introduction Molecular dynamics (MD) is a computational method that allows the study of the behavior of a large number of similar particles or systems at the atomic scale. This technique enables people to obtain the atomic or particle paths (different positions of particles depending on the time), in order to simulate the microscopic system behavior. From this knowledge, several dynamic and static properties of the system can be obtained. Systems can be independent and can interact between them, or with the external environment only by means of instantaneous processes conserving the energy and the momentum. [ 1 – 8 ]
Nanoindentation and nanoscratch are standard techniques used for analyzing the mechanical properties of materials. In the case of thin films, this technique gives detailed information about the process at low dimension scales, when materials are being indented in accordance with experimental results. In simulations of nanoscratch and nanoindentation processes, longitudinal and cross movements of a nanoindenter are carried out in order to obtain mechanical responses, which are then compared with the experiments.
In published literature, there are some reports of nanoindentation [ 9 , 10 ] and nanoscratch [ 2 , 11 , 12 ] processes being carried out for FCC structures of Cu, Al, or Au. In our case, we simulated the BCC-type structure of a generic coating.
MD normally uses interatomic potentials that recreate the atomic vibrations in the crystalline lattice. These potentials, as the Morse and embedded atom method, are well suited for metallic materials. In general, these materials are independent of temperature. Furthermore, it is necessary to consider the particles’ relative positions, as well as the electronic cloud density, for the EAM potential.
Previous simulations have shown information about the elastic-plastic behavior occurring in materials when they are indented. Smith et al . [ 13 ] described defects and atomic pile-up in Fe samples during the nanoindentation process. Alcalá et al . [ 14 ] focused on the formation of planar defects and dislocations. Zhu et al . [ 15 ] studied the influence of the nanoindentation shape on scratch tests.
In this work, the system included an FCC diamond-type structure as the substrate, and a BCC structure as the coating was considered. Several nanoindentation and nanoscratch tests were applied to this system in order to determine its mechanical and tribological properties. The main objective of this work is to present clearly the theoretical process carried out for simulating dynamic systems where external forces are acting.
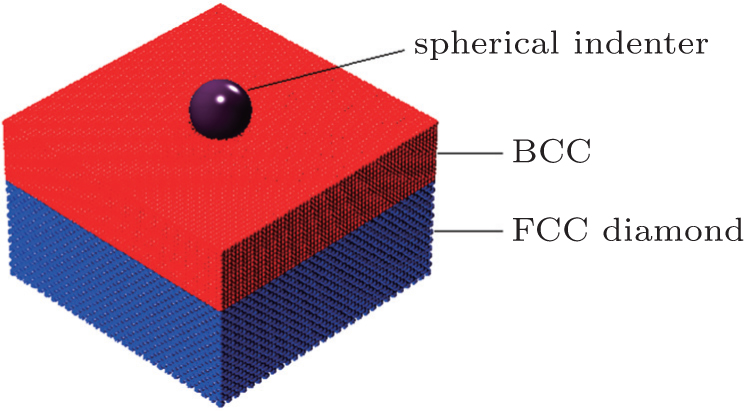
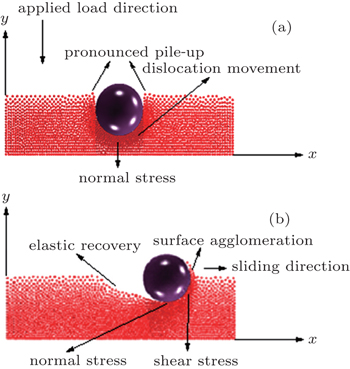
2. Methods Molecular dynamics simulations were implemented to study the behavior of monolayers of BCC crystal during nanoindentation and scratch tests. Figure 1 shows a schematic representation of the system. Samples contain monolayers of BCC crystalline structures. This structure is oriented in the plane (100) and placed on a substrate of FCC diamond structure in the [100] direction. These simulations consist of three parts: (i) nanoindentation, during which the indenter is pushed in the z direction into the thin film, (ii) nanoscratching, where the indenter moves at the indentation depth along the x direction, and (iii) retraction of the indenter, where the indenter is moved out of the substrate to return to the initial height. The nanoindenter is built as a rigid sphere with a radius of R = 7.5 Å, and interaction with the sample is by means of a repulsive potential. The thin film in these simulations has dimensions of 60 Å in the x – y plane and 60 Å in the z direction, with a lattice parameter a = 1 Å. Fixed atoms are employed at the bottom and lateral faces of the sample, and free boundary conditions in the top of the sample.
The equipartition energy theorem specifies that in a thermodynamic system, the mean kinetic energy is equivalent to the temperature. This relationship can be expressed in the following way:

Here,
k b represents the Boltzmann constant,
T is the average temperature of the system, 〈
K 〉 represents the average kinetic energy per degree of freedom,
m i is the atomic mass and
v i is the initial velocity of the
i -th particle. The instantaneous temperature
T of the system can be obtained by
Here, 3
N represents the number of degrees of freedom (3 for a system of
N particles with fixed total momentum). The temperature obtained from the average of the instantaneous velocities of each atom is generally different from the equilibrium temperature of the system (in the system studied, the equilibrium temperature is 300 K). To control the system, a velocity scale factor is employed

This scale factor approximates velocities in such a way that the kinetic energy of the system increases or decreases, taking the system to the thermal equilibrium. In Eq. (
3 ),
v new is the velocity required for the system in the new state,
v ins the instantaneous velocity of the current state,
T o the equilibrium temperature (300 K) and
T ins the current instantaneous temperature.
The units used in the simulations have to be carefully managed. In order to optimize the computational time, simulations were carried out using reduced units. In this study, reduced units of energy, length and mass, using the corresponding scaling factors for energy ( ε ), length ( σ ), and mass ( μ ) were employed as follows:

For the longitude

For the mass

In Eq. (
4 ),
ε =
K b represents the Boltzmann constant; in Eq. (
5 ),
σ = 1 Å represents the unit in Armstrongs; and in Eq. (
6 ),
μ = 1 amu is the atomic mass unit. From these scaling units, the temporal scale can be calculated by
The forces that act on each atom are obtained from the sum of the interaction of each atom with its neighbors and the force exerted by the spherical indenter on the atoms presented in the cut radius. The pair wise potentials used for calculating the force is of a Morse type. As was mentioned previously, it is fitted for metallic systems. The potential is described by

In this expression,
D i j represents the dissociation energy,
r i j the distance between two particles of the system (
r i j = (
x 2 +
y 2 +
z 2 )
1/2 ),
α the constant of the material that is obtained from the elasticity modulus,
[ 16 ] and
r 0 the equilibrium distance between two atoms of the system. The partial derivative of this potential allows for calculating the components of the force exerted by the system on each atom (
F x ,
F y ,
F z ).
F t is the magnitude of the force exerted on one atom due to the system atoms
From this way, the partial derivative of the potential energy results in the components of the force
From these vectorial components of the force, the atomic force magnitude can be obtained

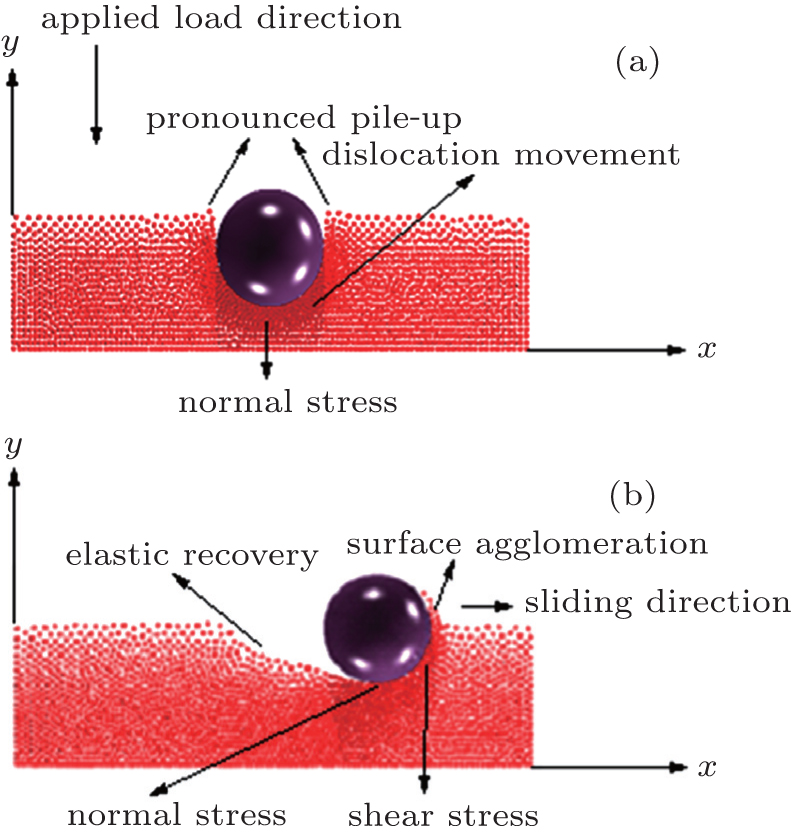
Moreover, the indenter-surface interaction can be calculated from the repulsive spherical potential,
[ 17 – 25 ] which recreates the physical phenomenon of the interaction when the indenter penetrates the sample, as shown in Fig.
2(a) .
Mathematically, the expression is represented as follows:

where
K e is the energy constant of an undeformable sphere,
R is the sphere radius, and
r i j is the distance between the sphere and each atom. To find the force exerted by the indenter on each atom obtained from the repulsive spherical potential
V (
r i j ), it may be derived. In Eq. (
17 ), the potential is expressed depending on its vectorial components

The partial derivatives for obtained force are
The total force in the indenter on each atom is given by

To find a better approximation, a more accurate potential that better represents the real situation is required. This potential is the embedded atom method (EAM), developed by Daw and Baskes. This potential takes into account the energy between pairs and the electronic energy. The problem of using the EAM is that many interatomic interactions between atoms of different materials are not steel calculated or easily available. To access this information, there are several web pages where data of energy for certain materials can be found (e.g.,
http://www.ctcms.nist.gov/potentials/ ). This page contains a database with a large number of potentials that are very useful for the scientific community, in order to obtain interatomic models. The EAM potential can be described as
Here
Vi j (
r i j ) is the pair interaction energy between atoms
i and
j separated by a distance
r i j , and
F i is the embedding energy of atom
i as a function of the host electron density

The latter is given by

where
ρ j (
r ) is the electron density function assigned to atom
j .
[ 26 – 28 ] To evaluate a given atom’s embedding function, one needs to compute the electron density at the position of atom i . This is obtained by a superposition of atomic densities, which are described by a density function, ρ j ( r i j ), as shown in Eq. ( 23 ).
After calculating the force on each atom, the next step is to integrate the Newton movement equation using the time integration algorithm of Verlet. [ 29 – 34 ] The Taylor expansion of atomic coordinates in a time interval is given by

From Eqs. (
24 ) and (
25 ), the following expression was obtained:

or

From Eq. (
26 ), the movement equation of Newton can be integrated to find the new atomic positions.
Summarizing, MD simulations mainly include three stages. (i) Initiation stage. The sample or system is built. Atoms or particles are placed in the phases space. [ 35 – 38 ] (ii) Once the sample is built (see Fig. 1 ), a velocity field is generated that acts on each particle of the system, meaning that one velocity corresponds to each element. Velocities are obtained using a random number generator and normally take values from 0 to 1 pm/s. One important feature of these velocities is that they possess a continuous distribution. Nevertheless, to represent the real situation it is necessary to carry out a Gaussian-type transformation in order to produce the fortuitous distribution function of N velocities that can occur with a relatively high probability for certain cases. [ 39 – 41 ] However, it is not relevant during the sample construction since the thermostat is responsible for stabilizing velocities. Depending on the temperature, the system may evolve as a function of time, scaling the particle velocities. The velocity scaling is carried out from the energy equipartition principle to produce linear momentum equal to zero, and velocities coherent with the temperature. [ 42 – 49 ] The objective of the last step is to relax the system and eliminate energy excesses, allowing the way for temperature control. At this stage, the time for carrying out the simulation is defined. [ 50 – 55 ] This time is calculated from the semi-empirical equation obtained from the equipartition principle. [ 56 – 59 ]
After the simulation time calculation, forces that drive the movement of each atom are determined. They are obtained from the partial derivatives of the interatomic potential that depends on the system to be studied. In this case the Morse potential fitted to metallic systems will be used. [ 60 – 67 ] From the force calculation, new positions for each atom can be obtained using the Verlet time integration algorithm. [ 29 – 34 ] Finally, the system is stabilized by using the Anderson method for temperature control also known as the stochastic collision method. At this point, the type of distribution used is relevant. In this case, a Boltzmann-type distribution was employed. [ 39 – 41 ]
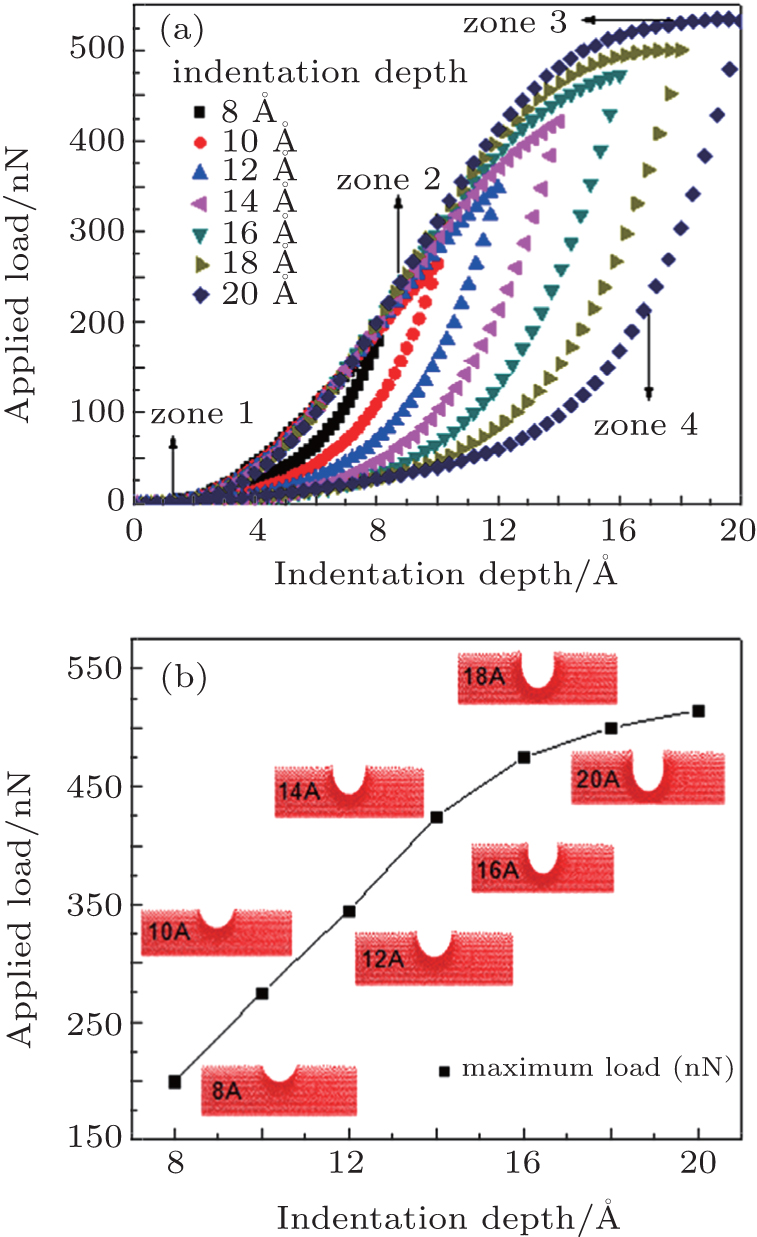
3. Results and analysis To avoid the mechanical response of the substrate, the nanoindentation was carried out by employing low loads for penetrations of the indenter lower than 34% of the coating thickness. In Table 1 , parameters used for Morse potential at different dissociation energies are listed. Figure 3(a) shows curves of the applied force as a function of the depth for several indenter penetrations, [ 35 – 38 ] using parameters numbered as “1” in Table 1 . The penetrations employed were 8, 10, 12, 14, 16, 18, and 20 Å. At the beginning of the nanoindentation in the load region, atoms are relaxed in their initial position, allowing the indenter to move forward without any problem (zone 1). From a certain depth the applied force begins to increase, generating elastic deformations, after which a continuous increase of the deformation is observed, as the external applied force increases. At this point, a process of dislocation begins, generating an elastic-plastic deformation (zone 2). This behavior is observed in samples indented with depths of 8, 10, 12, and 14 Å. For greater indentations, 16, 18, 20 Å, in the last stage a stabilization of the applied force that corresponds to the maximum load was observed (zone 3). This stabilization is attributed to the greater depth. A more homogeneous response of the material is observed, caused by the strong joining of the material layers simulated, which voids the reorientation or retransformation.
Table 1.
Table 1.
 Table 1. Morse potential parameters for different dissociation energies. . | Atomic bonding | Dissociation energy D /eV | Compressibility parameter/Å –1 | Equilibrium radius/Å | Lattice parameter/Å |
|---|
| 1 BCC-BCC | 0,1555 | 0,5721 | 0,5594 | 1,00 | | 2 BCC-BCC | 0,5000 | 0,5721 | 0,5594 | 1,00 | | 3 BCC-BCC | 1,0000 | 0,5721 | 0,5594 | 1,00 | | 4 BCC-BCC | 1,5000 | 0,5721 | 0,5594 | 1,00 | | 5 BCC-BCC | 2,0000 | 0,5721 | 0,5594 | 1,00 | | 1 FCC-FCC | 0,1555 | 0,3621 | 0,8439 | 1,00 | | 2 FCC-FCC | 0,5000 | 0,3621 | 0,8439 | 1,00 | | 3 FCC-FCC | 1,0000 | 0,3621 | 0,8439 | 1,00 | | 4 FCC-FCC | 1,5000 | 0,3621 | 0,8439 | 1,00 | | 5 FCC-FCC | 2,0000 | 0,3621 | 0,8439 | 1,00 | | 1 FCC-BCC | 0,1555 | 0,4671 | 0,6973 | 1,00 | | 2 FCC-BCC | 0,5000 | 0,4671 | 0,6973 | 1,00 | | 3 FCC-BCC | 1,0000 | 0,4671 | 0,6973 | 1,00 | | 4 FCC-BCC | 1,5000 | 0,4671 | 0,6973 | 1,00 | | 5 FCC-BCC | 2,0000 | 0,4671 | 0,6973 | 1,00 |
| Table 1. Morse potential parameters for different dissociation energies. . |
Finally, in the unload region, it is observed that as the indenter is removed from the system, the materials elastically recover (zone 4). The slope of the curve in the graph indicates how much the material can recover. [ 16 ] In this case, the recovery is of around 10% of the nanoindenter penetration. [ 68 ] One of the reasons for this recovery occurring in the materials is the spherical form of the indenter. This geometry allows a greater deformation in the elastic regimen since there are no stresses concentrated that locally amplify tensions which generate plastic deformations in the materials, as normally occurs in the case of indenters with different geometries. [ 17 – 25 ]
Figure 3(b) shows the evolution of the nanoindentation imprint for different depths when the load is at maximum. At this plot, an increase in the maximum load as the indenter reaches greater depths can be observed. This increase occurs with greater speed for depths between 8 and 14 Å, but for depths of 15 Å and deeper the curve slope begins to decrease, indicating a reduction in the increment rate of the external force as the depth is increased. The perpendicular pile-up of material is due to dislocations generated by the elastic-plastic deformations.
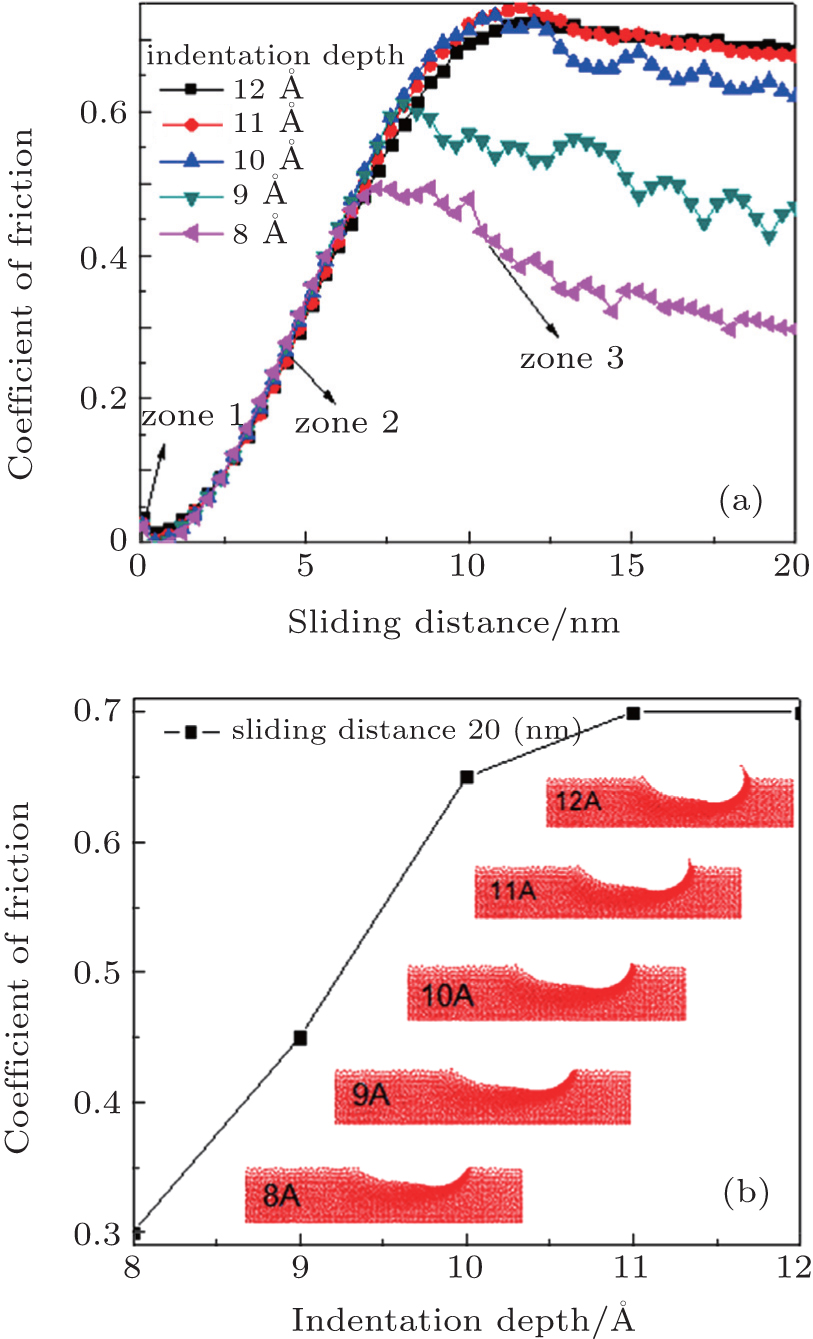
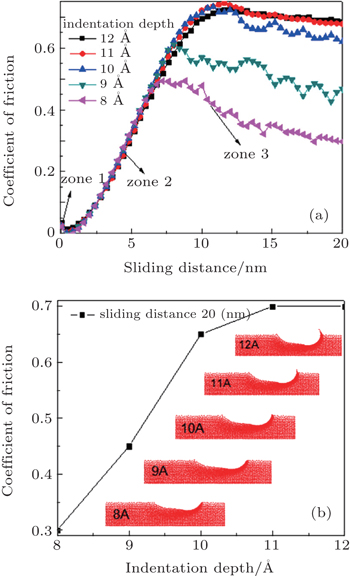
Curves shown in Fig. 4(a) present the friction depending on the sliding distance in wear tests for different depths, [ 2 , 69 ] using parameters numbered as “1” in Table 1 . The analyzed depths are 8, 9, 10, 11, and 12 Å, and the traveled cross distance is 20 nm. The atoms placed at the boundaries are not included in the simulation process, since the scratch test is carried out far enough from the fixed boundary. In these curves, the decrease of the initial coefficient of friction (zone 1) is observed. This is due to the pile-up produced by the indenter in the first stage of the nanoindentation process. The residual stress generated by this perpendicular atomic pile-up produced a decrease in the initial friction force with respect to the maximum normal force as the nanoindenter moves forward. After that, an abrupt change in the mechanical behavior of the material is produced and the friction force becomes greater than the normal force, generating an increase in the coefficient of friction (COF). This behavior is caused by the surface agglomeration of the material, and the atomic pile-up in the scratch direction. The pile-up and agglomeration produce an increase in the opposition to the nanoindenter movement, and then a stabilization of the COF occurs, which are due to the fact that part of the pulled material begins to be laterally detached, allowing the indenter to move forward with an almost constant friction force. [ 70 ]
Figure 4(b) shows an image of the scratch imprints after a failure of the coating occurs. In this image, the atomic pile-up caused by dislocations generated during the cross displacement of the nanoindenter is observed, and also an increase in the surface agglomeration as the nanoindenter depth increases is evidenced. [ 2 ] The failure mode at the critical load was very similar for all the indenter penetrations. The continuous increase of the cross-load during the scratch test produced the coatings detachment into the residual imprint and the region around it, as shown in Fig. 2(b) . In monolayer coatings, an adhesive failure was observed. This failure is a consequence of the traction stresses associated to elastic-plastic deformation induced by the applied load with the spherical indenter on the substrate-coating system. Finally, once the nanoindenter tip is removed, an elastic recovery occurs, which can be observed at the beginning of the scratch. When the indenter begins to move in the sliding direction, around 10% of the deformed material in the first stage of the indentation is elastically recovered.
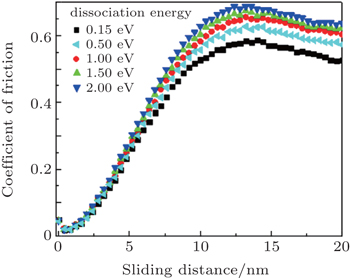
Curves in Fig. 5 present the friction force depending on the sliding distance in wear tests for different dissociation energies. These dissociation energies take values of 0.15, 0.50, 1.00, 1.50, and 2.00 eV. By definition, as the dissociation energy increases, bonds are stronger. Then, according to these curves, an increase in COF as the dissociation energy increases was evidenced. In the first stage, when the indenter begins the scratch process, similar behavior for all the energies was observed. Nevertheless, as the indenter moves forward, greater energy is accumulated and atoms with lower dissociation energies are delocalized, presenting agglomeration phenomena at the material surface, generating also material detachment.


 ]
]