Adaptive Kalman filter based state of charge estimation algorithm for lithium-ion battery
[Zheng Hong† , Liu Xu, Wei Min]
, Liu Xu, Wei Min]
|
|


†Corresponding author. E-mail: macrozheng@uestc.edu.cn
*Project supported by the National Natural Science Foundation of China (Grant Nos. 61004048 and 61201010).
In order to improve the accuracy of the battery state of charge (SOC) estimation, in this paper we take a lithium-ion battery as an example to study the adaptive Kalman filter based SOC estimation algorithm. Firstly, the second-order battery system model is introduced. Meanwhile, the temperature and charge rate are introduced into the model. Then, the temperature and the charge rate are adopted to estimate the battery SOC, with the help of the parameters of an adaptive Kalman filter based estimation algorithm model. Afterwards, it is verified by the numerical simulation that in the ideal case, the accuracy of SOC estimation can be enhanced by adding two elements, namely, the temperature and charge rate. Finally, the actual road conditions are simulated with ADVISOR, and the simulation results show that the proposed method improves the accuracy of battery SOC estimation under actual road conditions. Thus, its application scope in engineering is greatly expanded.
As an important storage medium, lithium-ion batteries have already been widely applied to electric vehicles (EV), new energy field, etc.[1– 6] The battery state of charge (SOC) is an important indicator reflecting the battery status.[7, 8] Recently, quite a lot of researchers and experts have proposed many estimate methods in terms of lithium-ion battery SOC, such as the Ampere– Hour method, [9] the extended Kalman filter method, [10– 14] the adaptive Kalman filter method, [15– 17] the Bayesian filter method, [18] the fuzzy recognition method, [19] the fuzzy extended Kalman filter method, [20] the radial neural networks method, [21] etc. Among them, the error of the Ampere– Hour method proposed in Ref. [9] reaches 20% when SOC is small. The extended Kalman filter method proposed in Refs. [10]– [13] has a higher accuracy than the Ampere– Hour method, but its error still exceeds 8%. In addition, the adaptive Kalman filter method is proposed in Refs. [15], [16], [17], and [14], whose simulation parameters have been updated and the error accumulation has been improved. However, it has not fully taken into consideration the influences induced by the temperature and discharge rate, and thus its error reaches 5% when it is in a steady state. In Ref. [18], the error of the Bayesian filter method is 2.4% in an ideal state, but its error experiences a substantial increase in practical applications. In Refs. [19] and [20], the fuzzy recognition method is proposed, whose simplified model of estimation increases error, reaching 9%. The radial-basis-function neural network method proposed in Ref. [21] enjoys a low relative error of 3%, but it requires a huge computational amount. Above all, in practical application, these methods still cannot well satisfy the requirements for high-precision SOC estimation under complex operating conditions. Therefore, for practical engineering applications, in this paper we introduce the temperature and discharge rate into the existing second-order model of the lithium battery, improving the accuracy of battery SOC estimation and enhancing its usability with the adaptive Kalman filtering method.
The SOC refers to the current electricity stored in the battery, namely the remaining capacity. It is a main parameter for reflecting the battery status. Typically, SOC is defined as the ratio of the remaining battery capacity to battery capacity, in a certain discharge environment

Here, QN is the nominal capacity, Qc is the remaining battery capacity, which refers to all of the battery capacity voltage obtained by fully discharging the battery with the rate of C/30 at room temperature (25 ° C); Qi means capacity consumption, whose value is equal to the difference between nominal capacity and standard residual capacity; QI is the actual power consumption of the battery, which refers to the power capacity released by a fully charged battery under the actual operating temperature and discharge rate; η is the coefficient of battery efficiency, which contains temperature coefficient η T and discharge rate coefficient η i. Moreover, the relationship between them can be defined as rm η = η i / η T. The QI can be converted into Qi by introducing the coefficient of battery efficiency η , which facilitates the calculation of SOC.
In reality, SOC is affected by many factors, such as the discharge rate, cell temperature, etc. In order to improve the instantaneity and accuracy of SOC estimation, two parameters, i.e., η i and η T are introduced to reflect the influence caused by discharge rate and cell temperature on the SOC. The modeling of the two parameters will be hereinafter described in detail.
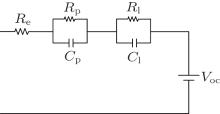
In order to fully illustrate the dynamic characteristics of the battery, and to make the amount of calculation for SOC estimation meet the actual demand, a second-order RC model of the battery is established as shown in Fig. 1. In the model, VOC refers to the open-circuit voltage (OCV) of the battery; Re is the ohmic resistance of the battery; Rp and Cp are used to simulate the fast response properties of the battery dynamic characteristics; Rl and Cl are used to simulate the slow response behaviors of the battery dynamic characteristics; the sum of two RC loop voltages is the polarization voltage of the battery.[22] Meanwhile, the measured voltage and working current of the battery are represented as V and i respectively, where i is positive when the battery is in the SOC, and i is negative when the battery is in a discharged state.
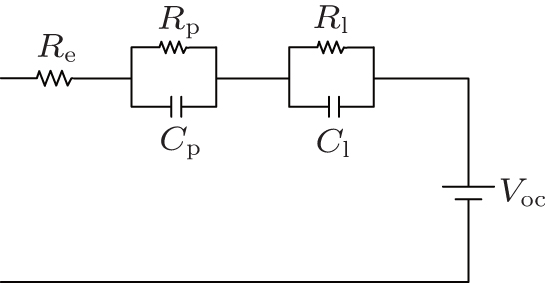 | Fig. 1. Second-order RC Model of the battery. |
For formula (1), by taking time derivatives on both sides of the equation, we have

The system state variables are selected as follows. The SOC represents the remaining capacity of the battery; Vp (t) represents the voltage of the loop RpCp; and Vl (t) represents the voltage of the loop RlCl. Meanwhile, the formula of system state variables is x = [SOC(t) Vp (t) Vl (t)]T, which takes the current i(t) as the input, while voltage V (t) of the battery terminal as th output. Thus, according to the relationships within the second-order RC loop equivalent circuit model and formula (2), we can obtain the state equation of the second-order RC equivalent model as follows:


In Eqs. (2)– (4), QN is the nominal battery capacity, while τ p = RpCp and τ l = RlCl.[15, 16] The output equation of the model is

In Eq. (5), Voc (SOC) indicates the open circuit voltage calculated with the SOC of the former state battery, and the specific expression is Eq. (7).
The Voc (SOC) in Eq. (6) represents the open circuit voltage (OCV). The OCV refers to the potential difference between two terminals in the primary battery when there is no current through the primary battery, and referred to as the electromotive force of the battery. Moreover, the OCV and SOC have the following piecewise linear relationship:

In Eq. (6), k and d vary with SOC, and thus they are not zero. Their values will be determined in the experiment below.
To determine the relationship between OCV and the SOC, the following steps are taken. Firstly, discharge the fully charged 3.3 V, 1.2 Ah lithium battery for half an hour with a rate of 0.1 C, and then disconnect the battery discharge circuit for two-hours standing to make the battery fully reach a steady state. Afterwards, measure the variation of battery terminal voltage with time and make it equivalent to the OCV, and then calculate the discharge capacity within half an hour. Then, take this as a cycle and repeat the discharge process until the end of the experiment. Finally, for the experimental results, use the interpolation method to fit the piecewise first-order polynomial approximation, with the results shown as
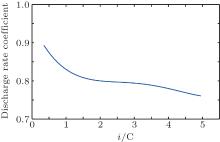
In Eq. (2), η i shows the discharge rate coefficient, which is used to explore the magnitude of the effect caused by different discharge rates on SOC. As indicated by the discharge characteristics of a lithium battery, the greater the discharge rate, the smaller the available discharge power is. Meanwhile, the charging capacities obtained with different charge rates are not the same. The effects of discharge rate on the battery capacity have been studied.[23] Thus, according to the experiments in Ref. [23], we can use the interpolation method to fit the relationship between the battery rate coefficient and the discharge rate, and obtain a polynomial fitting curve equation about η i as

Here, i refers to the reciprocal value of the time required for fully discharging the battery capacity in the charge rate. As shown in Eq. (8), with different values of charge-discharge rate i, the degrees of cell polarization are different, resulting in the influence on battery SOC, and the degree of the influence can be quantified by using the rate coefficient η i, as shown by the experimentally measured plot in Fig. 2. Figure 2 shows that within the range of 1 C, η i decreases in a small range as increases.
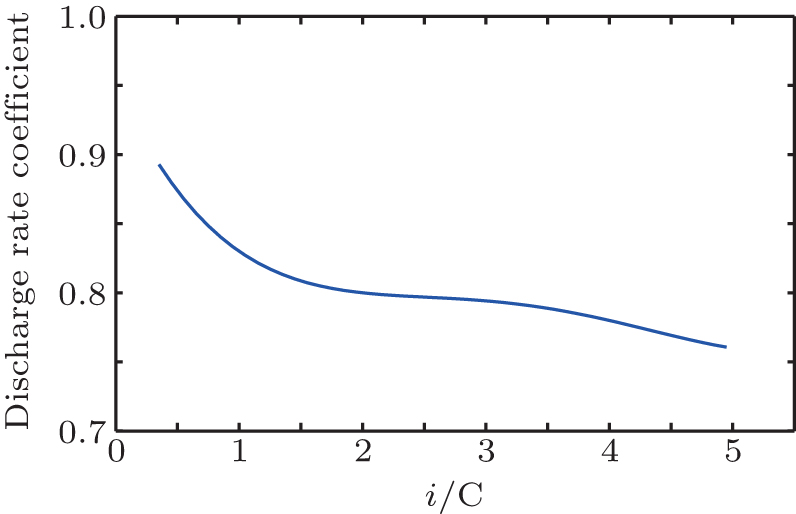 | Fig. 2. Fitting curve of discharge rate coefficient. |
 | Fig. 3. Fitting curve of temperature coefficient. |
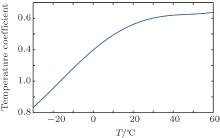
In Eq. (2), η T represents the temperature coefficient. At different ambient temperatures, battery power changes nonlinearly with cell temperature, which further affects the battery performance and life. Meanwhile, the actual operating temperature of the lithium battery pack is not a constant. Therefore, we must consider the effect of temperature on the SOC value when we estimate the battery SOC, and establish a corresponding SOC model of temperature. Some scholars have studied the effect of temperature on the battery capacity.[24] Thus, according to the experiments in Ref. [24], we use the interpolation method to obtain a polynomial fitting curve equation, which reflects the relationship between temperature and temperature coefficient as

where T is the temperature of the battery (in units of ° C). Equation (9) indicates that the battery internal resistance is inconsistent because of the different values of temperature T during the charging and discharging process, which affects significantly the battery SOC and the extent of such an effect, and is characterized by the temperature coefficient η T. The experimentally measured temperature is shown in Fig. 3. It can be seen from the figure that as the temperature T rises, η T increases.
Based on the above modeled lithium-ion battery state equation, we set the state variable of the lithium-ion battery state equation as x = [x1 (t)x2 (t) x3 (t)]T, where x1 (t) = SOC (t), x2 (t) = Vp (t), and x3(t) = Vl (t). Meanwhile, system input is the current of the battery end and u(t) = i(t); system output is the voltage of the battery end and y(t) = V(t). Thus, the lithium-ion battery model is expressed as


where
Here, Γ is the noise matrix, and Γ = [0.01 0.01 0.01]T; ω and ν denote the process noise and measurement noise respectively, which are used to demonstrate the unknown disturbances the battery is subjected to while operating.
From formula (10), it can be seen that the temperature factor η T and the charge-rate factor η i are introduced into the state equation of the battery, and the existing equation is thus optimized. Moreover, the adaptive estimation algorithm mentioned below is based on this model. Therefore, in practical applications, the adaptive Kalman filter based battery SOC estimation algorithm proposed in the paper can correct the encountered factor of the temperature and charge rate.
After performing the first-order Taylor expansion of f(x, u) and g(x, u), then we obtain the following results:
As shown in the above formula, the linearized lithium-ion battery nonlinear model is


where
The linearized equation mentioned above is discretized to facilitate the calculation on the computer. Meanwhile, in order to simplify operation and improve efficiency, an approximate discrete method is adopted in the paper. Furthermore, since the processes for charging and discharging the lithium battery are often slow (≥ 3600 s), the sampling frequencies for simulation and experiment are both set as Ts = 1 s in the paper.
According to the nature of the system observability, it can be known that the observability matrix of systems (14) and (15) is as follows:

Substituting matrices At and Ct into Eq. (16) yields

It can be obtained by the above-mentioned description that: (i) k is the coefficient used to fit the relationship between the open-circuit voltage and the SOC, and it can be known by combining with the modeling results hereinafter that k > 0; (ii) obviously, τ p = RpCp and τ l = RlCl, and both τ p and τ l are both greater than 0.
Therefore, it can be obtained by performing an elementary row transformation on Eq. (2) that
According to the above definitions, it can be known that fast response time constant τ p = RpCp, and slow response time constant τ l = RlCl; by definition, τ l > τ p > 0, namely τ p − τ l ≠ 0; thus, the rank of matrix OR (O) = 3, i.e., O is the full rank, so the system is observable.
After discretizing the linear model mentioned above, then we obtain the linear discrete model of the lithium-ion battery as


The mean values of process noise ω k and measurement noise ν k are E[ω k] = qk and E[ν k] = rk, respectively; the variance of process noise ω k and measurement noise ν k are 

The parameters of the battery model are calibrated by a 3.7 V, 300 mAh polymer lithium-ion battery produced by Incel Science & Technology Co., LTD. Moreover, a high-precision battery testing system (8 channels, 5 V, and 500 mA) is adopted to achieve the implementation of custom discharge condition for battery, where the sampling interval is 1 s, and the sampling precision is ± 0.1%. Meanwhile, the current and voltage of the battery are recorded in the whole process. Then, the forgetting factor least square algorithm is used to identify the relevant parameters for the battery model and the results are as follows: Re = 0.17 ω , Rp = 0.15 ω , Cp = 81 F, Rl = 0.25 ω , and Cl = 75 F.
We set the estimated value 


When k = 1, 2, … , the state and error covariance at time k are time updated with state and error covariance at time k − 1, as follows:


Here, 

More accurate estimation results are obtained by measuring the updated state and error covariance matrix with output measurement at time k,


where
Moreover, in the dynamic system described by Eqs. (19) and (20), uk and vk are taken as independent white noises. Meanwhile, it is based on the observed value {y0, y1, y2, … , yk− 1, yk} that the adaptive Kalman filter obtains state estimation. Then, according to the theory, the maximum a posterior (MAP) can be estimated.
Set the statistical characteristics for the initial state x0 as


Sage and Husa[17] proposed a noise statistics suboptimal maximum a posteriori unbiased estimator based on the observed value, which is


Furthermore, the state parameters and noise statistics can be alternately estimated with the above recursion formula. However, for a system whose amount of noise is time-varying, the old and new data should be dealt with separately. In other words, the historical data that are too old should be gradually faded out or forgotten, while the weighting coefficient for new data should be increased properly. The weighting coefficient β i can be selected according to the following faded or forgotten law:

Here, b is the forgetting factor and the distribution for descending probability is as follows:

Then, multiply each term by β k− 1 to replace the original 1/(k− 1) in the above-mentioned noise estimator, and thus the time-varying noise estimator can be obtained, namely, qk, rk, Qk, and Rk.
The updating of qk, rk, Qk, and Rk gives[14, 25]


Here, G= (Γ TΓ )Γ T, dk − 1 = (1 − b)/ (1 − bk), and b is the forgetting factor. Meanwhile, 0 < b < 1 and we take b= 0.98 and Γ = [0.01 0.01 0.01]T.
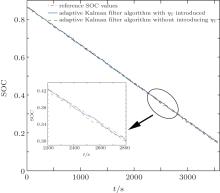
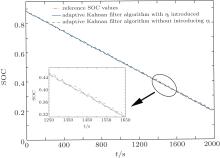
Let the battery temperature be stable at about 40 ° C, and DC electronic load be able to be programmed by using the single input of built-in high-performance current controller IT8513B, then the discharge testing will be carried out for a 3.3 V, 1.2 Ah lithium-ion battery with a discharge rate of 8/15 C. Meanwhile, in this paper, the ACS758 Hall current sensor produced by Allegro is adopted to measure the current signal, whose current output sensitivity is 60 mV/A. Then, according to the measured current, the SOCs of the lithium-ion battery based on the adaptive Kalman filter algorithm with and without introducing (namely, set η T= 1) into the battery model are estimated respectively, where η i takes the value corresponding to the time of discharge. Referential SOC is obtained by the integral relationship between power variation and the standard current. From Fig. 4 it is obvious that the error of the adaptive Kalman filter without introducing η T is greater than that with introducing η T.
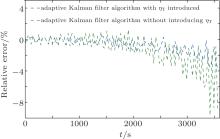
As can be seen from Fig. 5, the error of the adaptive Kalman filter with introducing η T does not exceed ± 4%, while that of the adaptive Kalman filter without introducing η T experiences a large-range fluctuation in the later stage, even reaching − 9%. It is because the total capacity of the battery will vary with temperature, and thus the algorithm will produce a large error without introducing η T coefficient to modify the estimation algorithm at different temperatures.
 | Fig. 4. Effects caused by temperature on SOC estimation. |
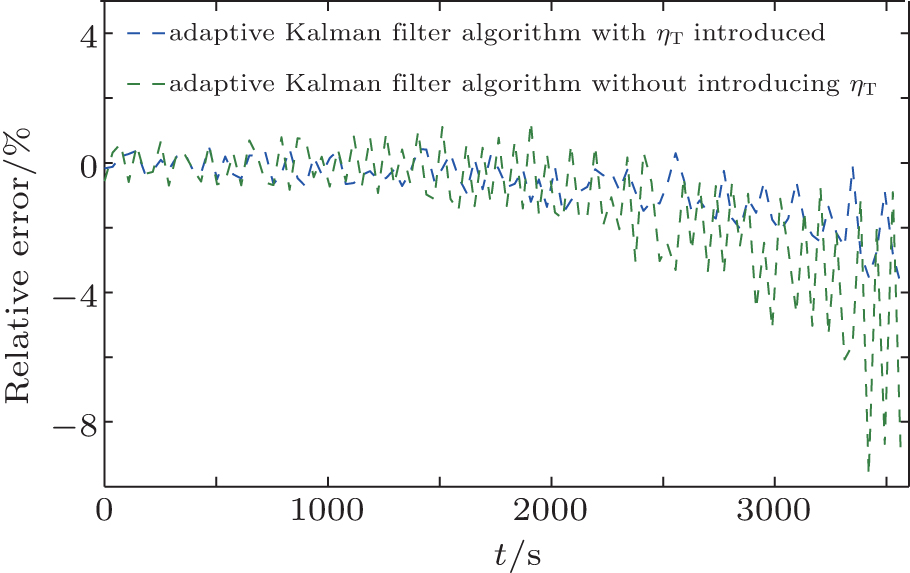 | Fig. 5. Error caused by temperature on SOC estimation. |
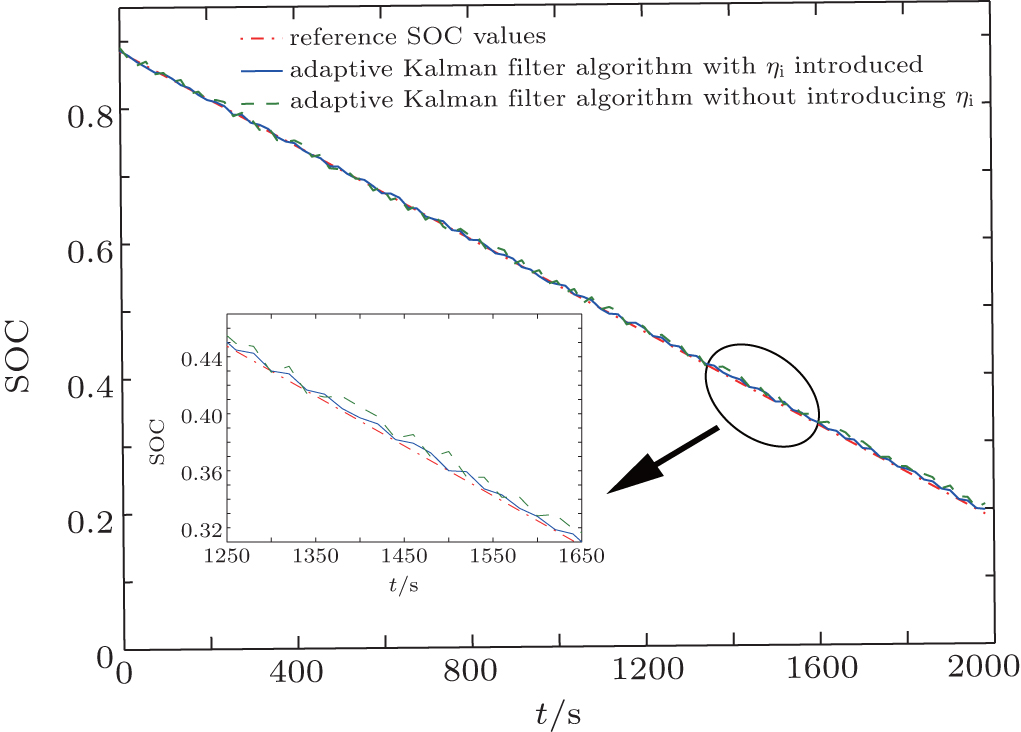
Let the battery temperature be stable at about 25 ° C, and DC electronic load be able to be programmed by using the single input of built-in high-performance current controller IT8513B, then the conduct discharge testing will be carried out for 3.3 V, 1.2 Ah lithium-ion batteries with a discharge rate of 13/15 C. Meanwhile, in this paper, the ACS758 Hall current sensor produced by Allegro is adopted to measure the current signal, whose current output sensitivity is 60 mV/A. According to the measured current, the SOCs of the lithium-ion battery based on the adaptive Kalman filter algorithm with and without introducing η i (namely, set η T = 1) into the battery model are estimated respectively, where η T takes the value corresponding to the time of discharge. Referential SOC is obtained by the integral relationship between power variation and standard current. From Fig. 6, it is obvious that the error of adaptive Kalman filter without introducing η i is greater than that with introducing η i.
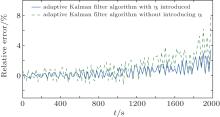
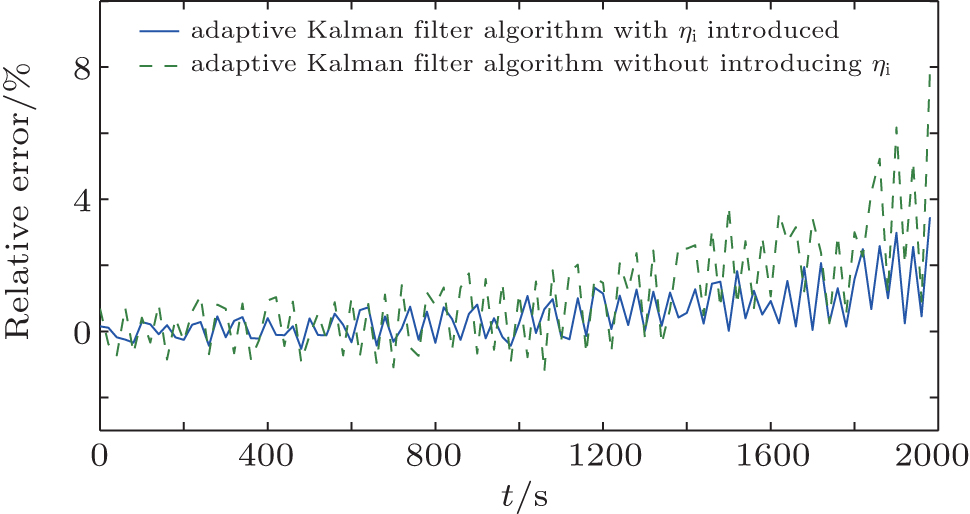
As can be seen from Fig. 7, the error of the adaptive Kalman filter with introducing η i does not exceed ± 3%, while that of the adaptive Kalman filter without introducing η i
 | Fig. 6. Effects caused by charge-rate on SOC estimation. |
experiences a large-range fluctuation in the later stage, even reaching 8%. It is because the total capacity of the battery will vary with the charge rate, and thus the algorithm will produce a large error without introducing the η i coefficient to modify the estimation algorithm in different charge rates.
 | Fig. 7. Effect of error caused by the charge rate on SOC estimation. |
In the paper, in order to enhance the SOC estimation by considering both temperature and charge rate, a battery model of electric vehicles in ADVISOR is established. Moreover, it is verified by the actual road conditions. At the same time, the NYCC operating conditions in the ADVISOR are chosen as the actual road conditions. Meanwhile, in ADVISOR, the main parameters are set as follows: a GM-EV1 electric car of the transmission module, MC_AC124_EV1_draft of the motor module, WH_SMCAR_REGEN of the wheel or axle module, ESS_LI7_rc_temp of the battery module (energy storage), and Tx_1SPD of the transmission module. Moreover, the NYCC operating condition represents the New York City Cycle, the specific parameter for travel time is 598 seconds; the mileage is 1.9 km; the maximum speed is 44.58 km/h and it reaches an average speed of 11.41 km/h, while the maximum acceleration is 2.68 m/s2, and the total idling time is 210 s. In this paper, six complete segments of NYCC operating conditions are merged to reach a total time of 3588 s, and other detailed conditions are the same as the standard NYCC conditions. Then, the reference SOC in ADVIOSR is directly cited. The final simulation results are shown in Figs. 8 and 9.
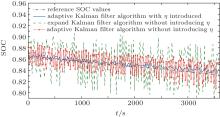
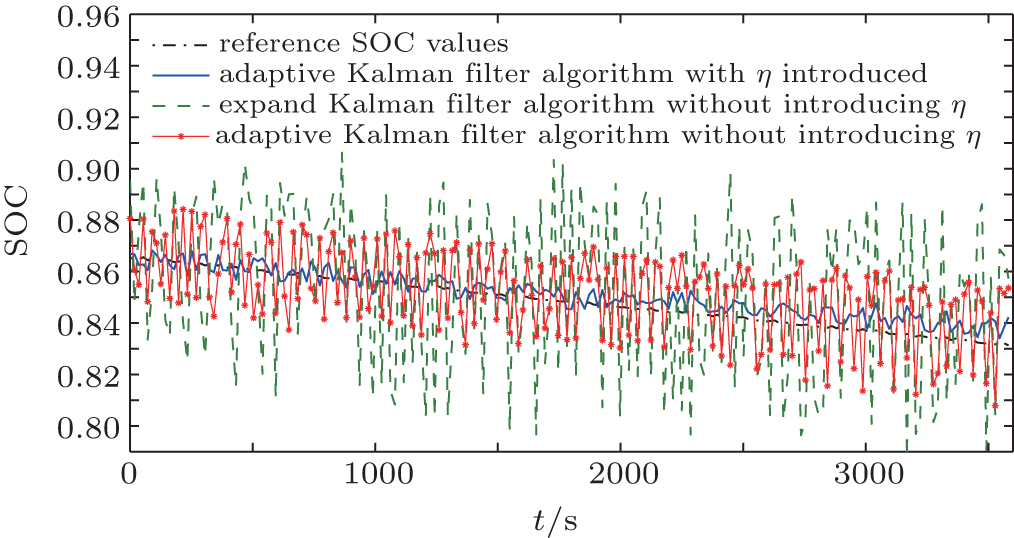 | Fig. 8. SOC estimation with considering temperature and charge rate. |
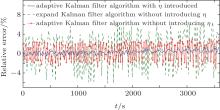
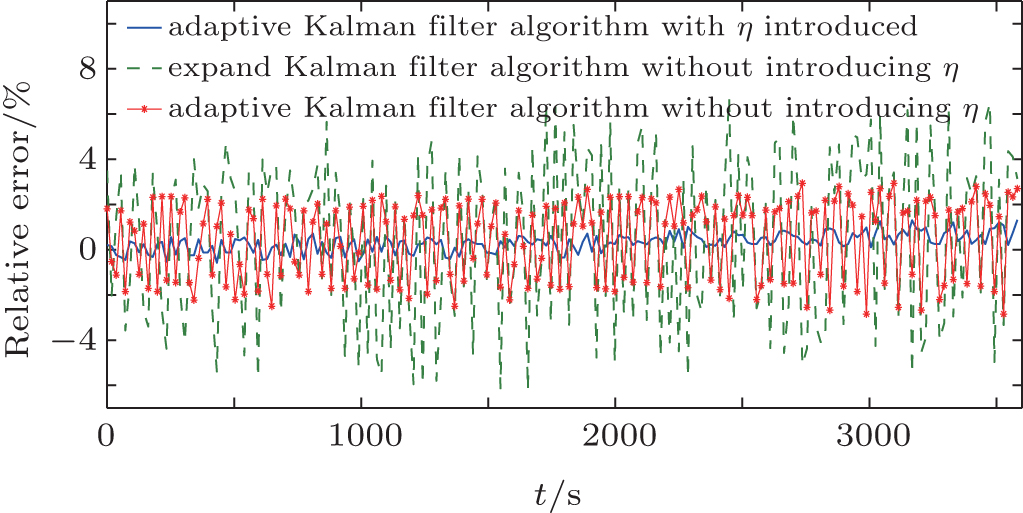 | Fig. 9. Error caused by temperature and charge rate on SOC estimation. |
It can be clearly seen from Fig. 8 that the adaptive Kalman filter based SOC estimation method can be greatly improved by taking into account the influences of temperature and charge rate. Thus, its engineering practicability can be enhanced. Figure 9 shows that the error of the adaptive Kalman filter algorithm without considering η (temperature and discharge rate) is nearly 3%, while that with introducing η can better control the error at about 1%. Moreover, the error of the extended Kalman filter SOC estimation method is much larger than that of the adaptive Kalman filter SOC estimation method with introducing η . Thus, the adaptive Kalman filter SOC estimation method with introducing η can estimate the SOC more accurately.
In the paper, the temperature and the charge-rate parameters are introduced into the second-order system model of the battery. Meanwhile, the parameters of the battery SOC model are corrected online by using an adaptive Kalman filter. Then, it is verified by numerical simulation that the factors of the temperature and charge rate affect battery SOC estimation. Finally, the actual road conditions are simulated with ADVISOR while taking into account the influences of the temperature and charge rate. The results show that the proposed method enhances the accuracy of battery SOC estimation. Thus, its application scopes in engineering are greatly expanded.
| 1 |
|
| 2 |
|
| 3 |
|
| 4 |
|
| 5 |
|
| 6 |
|
| 7 |
|
| 8 |
|
| 9 |
|
| 10 |
|
| 11 |
|
| 12 |
|
| 13 |
|
| 14 |
|
| 15 |
|
| 16 |
|
| 17 |
|
| 18 |
|
| 19 |
|
| 20 |
|
| 21 |
|
| 22 |
|
| 23 |
|
| 24 |
|
| 25 |
|