Raman scattering study of phase transition in Lu2O3–Ta2O5
[Wang Xiao-Feia), b) , Xing Xuea), b) , Zhang Qing-Lia)  , You Jing-Lin
c) , Wu Junc) , Zhang De-Minga) , Sun Yua) , Sun Dun-Lua) , Yin Shao-Tanga) ]
, You Jing-Lin
 |

 , You Jing-Lin
†Corresponding author. E-mail: zql@aiofm.ac.cn
*Project supported by the National Natural Science Foundation of China (Grant Nos. 51172236, 51272254, 51102239, and 61205173) and the National Science Fund for Distinguished Young Scholars, China (Grant No. 61405206).
The lutetium tantalate compounds obtained from Lu2O3–Ta2O5 with a molar ratio of 0.515:0.485 were studied by Raman scattering and x-ray diffraction. The results of the room temperature Raman scattering indicate that the sample has a phase transition between 1830 °C and 1872 °C, the polycrystalline is a mixture of M′-LuTaO4 and
In recent years, some new scintillation materials have attracted much attention. These materials show promising applications in the fields of nuclear medicine and high energy physics due to their characteristic high efficiency output, fast response, and high density.[1– 6] Rare earth tantalates are one type of high-density luminescence materials and the atomic numbers of Ta and rare earth ions are very high. Yb3+ :RETaO4 (RE = Gd, Y, Sc) have wide and strong absorption and emission bands, and these materials have attracted attention due to their promising applications in both ultrashort and tunable lasers.[7, 8] LuTaO4 has the highest density (9.8 g· cm− 3) among the luminescent material hosts.[9– 13] The fluorescence lifetime of Nd:LuTaO4 is about 263.2 ns, so Nd:LuTaO4 is a promising high density scintillator.[14] However, a complex phase transition takes place when the melt of Lu2O3– Ta2O5 is cooled to room temperature; therefore, the LuTaO4 single crystal is difficult to obtain. It is meaningful to study the compound phase transition of the system Lu2O3– Ta2O5 for the single crystal growth of LuTaO4.
In this respect, the lanthanide orthotantalates have been studied by Siqueira and co-workers.[15] They synthesized lanthanide orthotantalates RETaO4 (RE = La, Ce, Pr, Nd, Sm, Eu, Gd, Tb, Dy, Ho, Er, Tm, Yb, Lu) by solid-state reaction in optimized conditions of temperature (1300 ° C) and time (up to 14 h) to prepare crystalline samples. Room-temperature Raman scattering and x-ray diffraction were employed to investigate the crystal structures. LuTaO4 exhibits two structures, which are the M-type structure (I2/a) and the M′ -type structure (P2/a). The M-type structure is formed at high temperatures, while the M′ -type structure is formed at low temperatures, which will transform into the M-type structure when the synthesized temperature increases. However, there is no detailed investigation on the phase transition of the Lu2O3– Ta2O5 system in the high temperature region.
Another rare-earth tantalate system Gd2O3– Ta2O5 has been studied by Timofeeva and Mordovin.[16] They reported that the compounds with stoichiometries of Gd2O:Ta2O5 = 3:1, 1:1, 1:3 have stable phases at 1600 ° C, and a phase diagram of the Gd2O3– Ta2O5 system was presented. Yokogawa also reported the high-temperature phase diagram of the Gd2O3– Ta2O5 system.[17] However our experimental results indicated that the phase transition in Lu2O3– Ta2O5 is different from that in Lu2O3– Ta2O5, and the phase diagram of Gd2O3– Ta2O5 cannot be used to design the single crystal growth of LuTaO4.
The phase transition of the polycrystalline Lu2O3– Ta2O5 with a molar ratio of 1:1 at high temperature has been studied by x-ray diffraction and Rietveld refinement, [18] which showed that the single phase M-LuTaO4 or M′ -LuTaO4 cannot be obtained from the melt of Lu2O3– Ta2O5 with the molar ratio of 1:1. On the other hand, growing single crystal LuTaO4 from the melt of Lu2O3 and Ta2O5 near the molar ratio 1:1 has been tried many times but is still unsuccessful, which indicates that it is necessary to obtain the detailed phase transition of Lu2O3– Ta2O5 for the single crystal growth of LuTaO4. In this work, the compound prepared by solid state reaction of Lu2O3– Ta2O5 with the molar ratio of 51.5:48.5 is studied by x-ray diffraction and high temperature Raman scattering from room temperature to 1400 ° C. In the compound, Ta2O5 is near 50 mol% and Lu2O3 is a bit more. The investigation of the phase transition in Lu2O3– Ta2O5 with near 50 mol% Ta2O5 is helpful to the high density scintillator Nd:LuTaO4.
LuTaO4 was synthesized with Lu2O3 (99.99%) and Ta2O5 (99.99%) as the starting materials through a solidstate reaction. Stoichiometric amounts of the starting materials were weighed, mixed, and ground. For calcining, cylinder samples of Ø 15 mm× 4 mm were prepared by applying a hydrostatic pressure of 40 MPa. The samples were sintered at 1830 ° C, 1872 ° C, 1940 ° C, 2013 ° C, and 2050 ° C for more than 7 h in a homemade frequency induction furnace. The temperature was measured with a portable infrared temperature measurement device (RAYR3I1MSCU). After careful grinding, the calcined powder samples were characterized by x-ray diffractometer X’ Pert-Pro MPO in the 2θ range of 10° – 60° with speed 12 s/step and interval 0.02° . The diffractometer was operated at 40 kV and 40 mA with Cu Kα radiation (λ = 0.15405 nm) through a carbon monochromator and a nickel filter.
Raman scattering measurements were carried out in back scattering geometry and performed with the Jobin-Yvon LabRAM HR800 spectrometer, which used a 532 nm laser as the excitation source, and the spectral resolution was 1 cm− 1. The powder samples were investigated from room temperature to 1400 ° C, then from 1400 ° C down to room temperature, and the test temperatures were 200 ° C, 400 ° C, 800 ° C, 1100 ° C, 1150 ° C, 1200 ° C, 1300 ° C, 1350 ° C, and 1400 ° C. The heating and cooling rates were 30 ° C/min. Before each measurement, the temperature was kept constant for 5 min to ensure uniform temperature in the sample. Wavenumber calibration of the Raman spectrometer was performed with a silicon wafer. The standard Raman spectral peak of the silicon sample is 520.7 cm− 1, while it was 510.9 cm− 1 in our experiment, which means that the measured Raman spectra should be moved to a low wavenumber by 9.8 cm− 1.
The compound LuTaO4 usually exhibits two fergusonite structures according to the calcined conditions employed, [19] one belongs to I2/a or M-type and the other is P2/a or M′ -type. In order to convert the M′ -type structure to the M-type structure, it has to be heated over 1600 ° C.[11, 12]
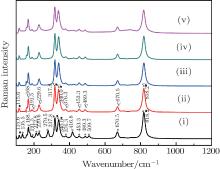
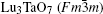
The results are displayed in Fig. 1. The peaks around 135.5 cm− 1, 212.8 cm− 1, 279.5 cm− 1, 416.8 cm− 1, and 509.7 cm− 1 marked with asterisks are due to M′ -LuTaO4 according to the research of Siqueira et al.[15] The peaks around 168.7 cm− 1, 191.5 cm− 1, 229.6 cm− 1, 317.8 cm− 1, 340.0 cm− 1, 376.3 cm− 1, 453.3 cm− 1, 489.3 cm− 1, 670.5 cm− 1, and 818.2 cm− 1 are present due to the M-type structure, and the peaks around 135.5 cm− 1, 168.7 cm− 1, 191.5 cm− 1, 212.8 cm− 1, 229.6 cm− 1, 279.5 cm− 1, 317.8 cm− 1, 340.0 cm− 1, 376.3 cm− 1, 416.8 cm− 1, 453.3 cm− 1, 489.3 cm− 1, 509.7 cm− 1, 670.5 cm− 1, and 818.2 cm− 1 are more intense for the M′ -type structure. The cubic phase 
 | Fig. 1. Room-temperature Raman spectra of Lu2O3– Ta2O5 samples with the molar ratio of 0.515:0.485 obtained by solid-state reaction at different temperatures. The calcined temperatures of samples (i)– (v) are 1830 ° C, 1872 ° C, 1940 ° C, 2013 ° C, and 2050 ° C, respectively. * indicates peaks for M′ -LuTaO4, ▽ for M-LuTaO4, and • for Lu3TaO7. |
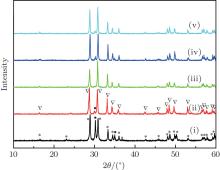
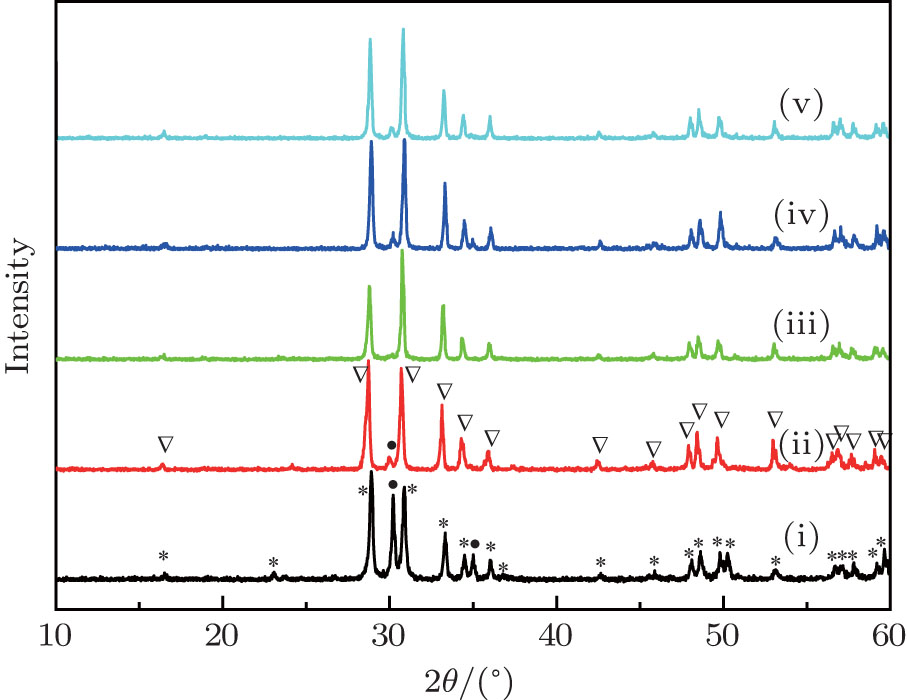
X-ray diffraction was used to confirm the M′ → M phase transition of the sample calcined at different temperatures. The obtained XRD patterns are shown in Fig. 2. Figure 3 presents the XRD patterns of the LuTaO4 samples from Inorganic Crystal Structure Database (ICSD) cards # 153366, # 155662 and the powder diffraction card # 24– 697. Although the differences between fergusonite M-type and M′ -type structures are slight, they can be discerned by some 2θ peaks in Fig. 3. The 2θ peaks of the M-type structure are mainly present at around 16.4° , 18.8° , 30.0° , and 45.7° , and the 2θ peaks of the M′ -type structure are more intense at around 23.5° , 37.3° , 44.0° , and 51.2° . And the cubic phase 
 | Fig. 2. Room-temperature XRD patterns of Lu2O3– Ta2O5 samples with the molar ratio of 0.515:0.485 obtained by solid-state reaction at different temperatures. The calcined temperatures of samples (i)– (v) are 1830 ° C, 1872 ° C, 1940 ° C, 2013 ° C, and 2050 ° C, respectively. * indicates peaks for M′ -LuTaO4, ▽ for M-LuTaO4, and • for Lu3TaO7. |
The samples of Lu2O3– Ta2O5 with a molar ratio of 0.515:0.485 melt when the calcined temperature is above 2050 ° C. It can be found that the XRD pattern of sample (v) is similar to that of M-LuTaO4 in Fig. 3, while the relative intensities of the 2θ peaks to other diffraction peaks at 30° in sample (v) with the integral intensity ratio 135.6 are stronger than those of M-LuTaO4 with the integral intensity ratio 20.4 in Fig. 3, which indicates that there exits cubic phase Lu3TaO7 of 
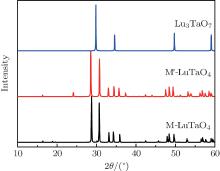
 | Fig. 3. XRD patterns of M-LuTaO4 (ICSD# 153366), M′ -LuTaO4 (ICSD# 155662), and Lu3TaO7 (CSM# 24-697). |
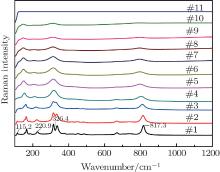
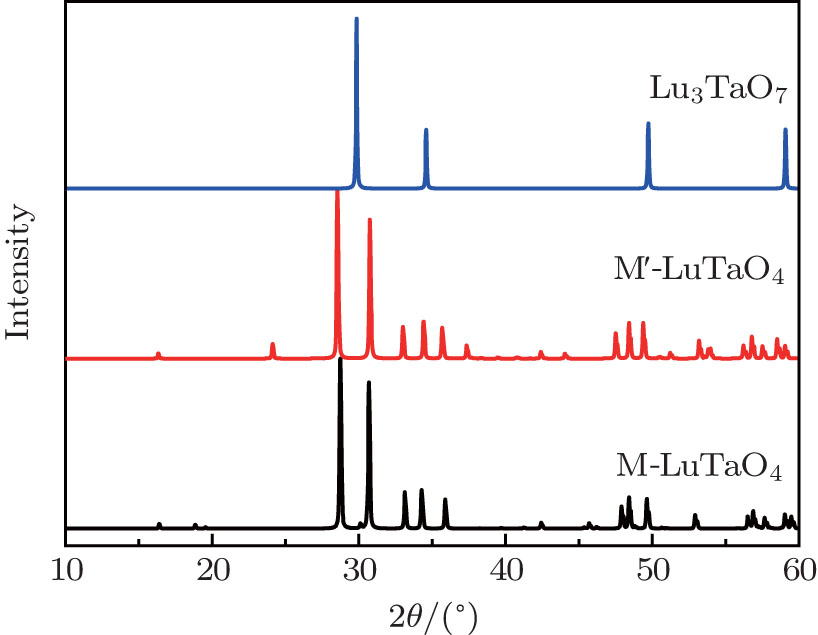
Figure 4 shows the high-temperature Raman spectra of Lu2O3– Ta2O5 samples with a molar ratio of 0.515:0.485 calcined at 2050 ° C. The width and the intensity of the Raman peaks are changing as the temperature increases. The change of the Raman peak width is usually a sign of physical disorder, which results mainly from that the balance bond length and bond angle of atoms in the crystal distribute in relative large ranges. The Raman peaks at 115.2 cm− 1, 220.9 cm− 1, 817.3 cm− 1 gradually disappear and the double-peak at 326.4 cm− 1 changes into a single-peak as the temperature increases. In the observed temperature range, no obvious peak shift or new peaks are observed.
 | Fig. 4. High-temperature Raman spectra of Lu2O3– Ta2O5 samples with a molar ratio of 0.515:0.485 calcined at 2050 ° C. The measured temperatures from # 1 to # 11 are the room temperature, 200 ° C, 400 ° C, 800 ° C, 1100 ° C, 1150 ° C, 1200 ° C, 1250 ° C, 1300 ° C, 1350 ° C, and 1400 ° C, respectively. |
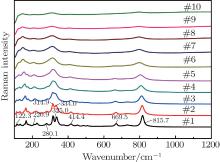
Figure 5 shows the high-temperature Raman spectra of the sample when the measurement temperature is decreased from 1400 ° C to the room temperature. The width and the intensity of the Raman peaks change when the temperature decreases. The Raman peaks at around 122.3 cm− 1, 220.9 cm− 1, 280.1 cm− 1, 325.0 cm− 1, 414.4 cm− 1, 669.5 cm− 1, and 815.7 cm− 1 gradually appear. And a peak splits into two peaks at 314.9 cm− 1 and 334.0 cm− 1 below 400 ° C. It can be seen that the Raman spectra at different temperatures in Fig. 4 are repeated in Fig. 5. According to the high temperature Raman spectra, it can be concluded that there is no phase transition from room temperature to 1400 ° C.
 | Fig. 5. High-temperature Raman spectra of Lu2O3– Ta2O5 samples with a molar ratio of 0.515:0.485 sintered at 2050 ° C. The measured temperatures from # 1 to # 11 are the room temperature, 200 ° C, 400 ° C, 600 ° C, 800 ° C, 1100 ° C, 1150 ° C, 1200 ° C, 1250 ° C, and 1300 ° C, respectively. |
In this paper we studied the compounds obtained from Lu2O3– Ta2O5 with a molar ratio of 0.515:0.485 via solid-state reaction at different temperatures. The room-temperature Raman scattering and XRD investigations showed that the sample calcined at 1830 ° C consists of M′ -LuTaO4 and Lu3TaO7, those calcined at 1872– 2050 ° C consist of M′ -LuTaO4 and Lu3TaO7, and a phase transformation from M′ -LuTaO4 to M-LuTaO4 occurs between 1830 ° C and 1872 ° C. The temperature-dependent Raman spectra up to 1400 ° C indicated that there is only one phase M′ -LuTaO4 and no phase transition occurs in this temperature range.
| 1 |
|
| 2 |
|
| 3 |
|
| 4 |
|
| 5 |
|
| 6 |
|
| 7 |
|
| 8 |
|
| 9 |
|
| 10 |
|
| 11 |
|
| 12 |
|
| 13 |
|
| 14 |
|
| 15 |
|
| 16 |
|
| 17 |
|
| 18 |
|
| 19 |
|