
Photocarrier radiometry for noncontact evaluation of space monocrystalline silicon solar cell under low-energy electron irradiation
[Liu Jun-Yan, Peng Song, Wang Fei, Wang Yang† ]
]
]
|
|


†Corresponding author. E-mail: ljywlj@hit.edu.cn
A space monocrystalline silicon (c-Si) solar cell under low-energy (< 1 MeV) electron irradiation was investigated using noncontact photocarrier radiometry (PCR). Monte Carlo simulation (MCS) was employed to characterize the effect of different energy electron irradiation on the c-Si solar cell. The carrier transport parameters (carrier lifetime, diffusion coefficient, and surface recombination velocities) were obtained by best fitting the experimental results with a theoretical one-dimensional two-layer PCR model. The results showed that the increase of the irradiation electron energy caused a large reduction of the carrier lifetime and diffusion length. Furthermore, the rear surface recombination velocity of the Si:p base of the solar cell at the irradiation electron energy of 1 MeV was dramatically enhanced due to 1 MeV electron passing through the whole cell. Short-circuit current ( Isc) degradation evaluated by PCR was in good agreement with that obtained by electrical measurement.
Space solar cells are required to operate with high reliability and good tolerance to radiation damage in the environment of space, which is full of charged particles (i.e., protons and electrons).[1] In general, the monocrystalline silicon (c-Si) solar cell is used in the near-earth mission satellites, and is always degraded due to the radiation damage in the Earth’ s radiation belts. Therefore, the effects of charged particle irradiation on the c-Si solar cell should be deeply investigated to quantitatively predict the performance degradation of the cell. In the last few decades, more and more attention has been paid to the electron irradiation effects on the solar cells.[2– 4] Danilchenko et al.[5] studied the influence of 1 MeV electron irradiation on the dark current (Id) and the short-circuit current (Isc) of a solar cell. The minority carrier transport parameters (carrier lifetime τ , diffusivity D, surface recombination velocities) also play an important role in the evaluation of the electrical performance of space solar cells. The fluence of particles with energy in the range from 40 keV to 0.1 MeV is several orders of magnitude greater than that above 1 MeV in the space environment.[6] Therefore, it is necessary to study the low-energy electron irradiation influence on the carrier transport parameters of the space solar cell.
Recently, contactless optical methods were employed for the measurement of the carrier transport parameters of a silicon wafer, i.e., modulated free carrier absorption, [7] photothermal radiometry (PTR), [8] and modulated laser induced photocarrier radiometry (PCR).[9] PCR has the advantages of high resolution and good sensitivity, and it is used to obtain the optoelectronic parameters of semiconductor materials (i.e., silicon plain wafer) and photovoltaic devices.[10– 13] However, to the best of our knowledge, the noncontact evaluation of a solar cell under low-energy (< 1 MeV) electron irradiation using the PCR technique has not been reported. Therefore, we provide a new approach to obtain the carrier transport parameters and to evaluate the performance of a space c-Si solar cell under low-energy (< 1 MeV) irradiation.
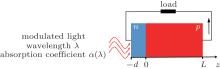
The PCR signal is obtained by solving the carrier transport equation and integrating the carrier density wave (CDW) over the thickness of the solar cell. As a typical p– n junction device, it consists of a p (n) type quasi-neutral region (QNR) and a space charge region (SCR). In this work, we assume that the photovoltaic device structure is an abrupt p– n junction, which is fabricated on a long-base p-type substrate (base) by the diffusion of n-type impurities to form a thin n-type surface layer (emitter), where the finite width of the SCR at the junction has been neglected.[14] A schematic diagram of the p– n junction of the solar cell excited by monochromatic light is shown in Fig. 1.
 | Fig. 1. A schematic diagram of the solar cell excited by monochromatic light. |
By taking into account both the junction and the diffusion capacitances and the bias voltage of the p– n junction of the solar cell, the carrier density wave and the boundary-value problem are given by[15]


where

Here Δ p, p0, Dp, τ p, and Sf are, respectively, the excess CDW, the equilibrium minority carrier density, the ambipolar diffusion coefficient, the excess carrier lifetime, and the surface recombination velocity (SRV) in the emitter side; Δ n, n0, Dn, τ n, and Sr are the respective quantities in the base side; η QE is the quantum yield; I0 is the light intensity; R(λ ) and α (λ ) are, respectively, the reflectivity and the optical absorption coefficient of the material at the light wavelength λ ; ℏ v is the photon energy of the monochromatic light; f and ω are respectively the modulated frequency and the angular frequency of the monochromatic light, ω = 2π f; and, V0 and Vac(ω ) are, respectively, the dc forward bias voltage and an ac small-signal photovoltage.
Finally, the PCR signal can be expressed as
where (λ 1, λ 2) is the spectral bandwidth of the infrared detector, F(λ 1, λ 2) denotes the proportional factor, and an, cn1, cn2, ap, cp1, and cp2 are defined as follows:

In order to analyze the influence of electron irradiation on c-Si solar cell, Monte Carlo simulation code CASINO is used to calculate the normalized hit distribution of electron and the depth-dependent concentration of the cathodoluminescence (CL) centers taking into account the c-Si solar cell structure. In this work, the electron with energy from 0.05 MeV to 1 MeV is simulated.
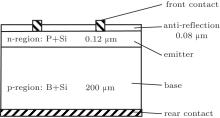
The layer structure of the c-Si solar cell consists of an anti-reflection layer (0.08 μ m), an emitter (0.12 μ m), a base (200 μ m), and a back contact (shown in Fig. 2). During the simulation, the anti-reflection layer is neglected due to its very small thickness compared to the others. According to the donor concentration of phosphorus in the n region, the ratio of phosphorus and Si is 1:500, and the boron atom in the p region can be neglected.
 | Fig. 2. Layer structure of the c-Si solar cell. |
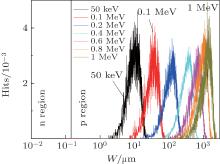
Figure 3 shows the normalized hit distribution of electron. It can be found that the peak of the electron hits rapidly shifts to the deeper region with the increase of the electron energy. Furthermore, the electron with the energy of only 0.05 MeV will pass through the p– n junction and enter into the base. Therefore, in the simulation, the electron demonstrates a very strong penetrating power, and the electron with an energy of over 0.2 MeV will pass through the whole c-Si solar cell (here, the p region of the base is supposed to infinite in the simulation, while it is only 200 μ m in the layer structure of the c-Si solar cell).
 | Fig. 3. Normalized hit distributions with different irradiation electron energies. |
The depth-dependent concentration of the CL centers is presented in Fig. 4. The depth-dependent concentration of the CL centers is related to the distribution of defect or impurity.[16] It can be observed that the depth of the maximum concentration is shifted to the deeper region with the increase of the irradiated electron energy, this indicates that more defects will be induced by the higher energy electron irradiation at the deeper region of the c-Si solar cell. Furthermore, the depth of the maximum concentration induced by the irradiated electron with the energy of about 0.2 MeV will be larger than the cell thickness, and then the defects induced by the radiation of electron will be enhanced.
 | Fig. 4. CL intensity distributions with different irradiation electron energies. |
In this work, the electron irradiation was performed at the Multi-Ions Accelerators (MIA) of Space Material Behavior and Evaluation National Key Lab (SMB& E-NKL) in the Harbin Institute of Technology, China. MIA used a three-level vacuum pumping system, which ensured the reliability of the sample chamber vacuity. In this investigation, three c-Si solar cells were irradiated with electron beams of energies of 0.05 MeV, 0.1 MeV, and 1 MeV with the same fluence of 1× 10¹⁵ e/cm2, and one non-irradiation c-Si solar cell was used for comparison analysis with the electron irradiated ones.
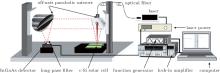
The PCR experimental system used has been described elsewhere, [11, 13] and a schematic diagram is shown in Fig. 5. An 808 nm diode laser internally modulated using the voltage output from a function generator was employed as the carrier excitation source. The laser beam was focused on the solar cell surface coincident with the focal point of an off-axis parabolic mirror that was used to collect a portion of photons. The collected light was focused onto an InGaAs detector (Throlabs PDA10CS) with a switchable gain preamplifier (0– 70 dB) and a frequency response up to 17 MHz. The detector has a spectral bandwidth of 800– 1700 nm with a peak response 0.95 A/W at 1550 nm and an active element with the area of 0.79 mm2. A long pass filter LP-1000 nm was placed in the front of the detector and was used to block the excitation laser beam from the InGaAs detector. The signal from the InGaAs detector was demodulated by a lock-in amplifier (SR830, DSP Lock-in amplifier, Stanford). All of the instruments and data acquisition were controlled by an in-house developed software. PCR frequency-scan measurements from 10 Hz to 100 kHz with the focused laser beam were carried out at room temperature with a sinusoidally modulated intensity. The spot size on the c-Si solar cell and the output power of laser were about 400 μ m and 32 mW, respectively.
 | Fig. 5. A schematic diagram of PCR experimental system. |
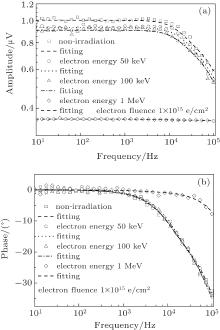
The amplitude and the phase of the PCR signal from the c-Si solar cell before and after the electron irradiation are illustrated in Fig. 6.
 | Fig. 6. (a) Amplitude and (b) phase of PCR signals obtained from experiment and best-fitting. |
From Fig. 6(a), it can be seen that the amplitude of the PCR signal of the c-Si solar cell has a similar characteristic to that of the plain silicon wafer for the given electron irradiation energy range, [9, 10] and an inflection point exists at the high frequency. The amplitude of the PCR signal has relatively little change due to the electron irradiation with the very low energy up to 0.1 MeV; however, it dramatically decreases as the electron energy increases up to above 1 MeV, and the inflection point also moves to the higher frequency. From Fig. 6(b), it can be seen that the phase of the PCR signal of the c-Si solar cell has a response similar to that of the plain silicon substrate wafer, [9] the phase of the PCR signal has no apparent change at the low frequency range and an inflection point exists at the corresponding high frequency. The phases of the PCR signals also have relatively little change due to the electron irradiation with the very low energy up to 0.1 MeV. However, the knees move to the higher frequency as the electron energy increases up to 1 MeV. In the literature, [9, 10] the knee location in the frequency domain is related to the carrier lifetime and the diffusion coefficient; in other words, the knee location of the amplitude or phase of the PCR signal is dependent on the carrier diffusion length ( 
To estimate the carrier transport parameters of the c-Si solar cell, both amplitude and phase of the PCR signal were fitted to the foregoing theoretical model, Eq. (9). In the previous work, [15] the carrier transport parameters had been extracted from only two PCR channels (amplitude and phase), and the reliability and precision measurements of the associated parameters were investigated by two independent multi-parameters best-fitting computational programs (labeled as mean-value best fit and statistical fit). In this work, we applied the mean-value best fit and the statistical fit to extract the carrier transport parameters. By assuming the quantum yield η QE = 1.0 here, the surface reflectance[17]R = 0.05, the intrinsic concentration[17]ni = 1.4 × 1010 cm− 3, the absorption coefficient[18]α = 790 cm− 1, the best-fitted curves yield the minority carrier lifetime, the ambipolar diffusion coefficient, and the surface recombination velocity in the p region, as presented in Table 1. Because the thickness of the emitter is much smaller than even the shortest diffusion length at the maximum modulation frequency, the photocarrier wave density confined within the emitter remains unchanged and these parameters are not listed here.
| Table 1. Carrier transport parameters of the base of c-Si solar cell under electron irradiation of fluence 1× 10¹⁵ e/cm2 obtained by best-fitting. |
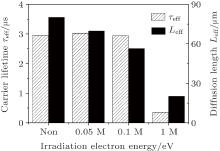
To evaluate the effects of the electron energy on the carrier transport properties of the c-Si solar cell, the carrier lifetime and the carrier diffusion length dependences on the irradiation electron energy are presented in Fig. 7.
 | Fig. 7. The dependence of excess carrier lifetime and diffusion length on the irradiation electron energy. |
It can be seen that the carrier lifetime does not apparently change with the irradiation electron energy below 0.1 MeV, while it is rapidly reduced as the irradiation electron energy increases up to 1 MeV, and correspondingly, the carrier diffusion length 
For a solar cell with energy ions irradiation at a given fluence, the short circuit current Isc can be given by[3]
where α represents the absorption coefficient of the light, and WSCR is the width of the space charge region under zero bias.
From Eq. (16), for a given irradiation fluence, the short-circuit current Isc is dependent on the minority carrier diffusion length. In order to elevate the degradation of short-circuit current Isc due to the electron irradiation at different energies with a constant fluence of 1.0 × 10¹⁵ e/cm2, the I– V characteristic of the c-Si solar cell was measured under AM1.0 condition (room temperature 25 ° C, illumination intensity 1.353 kW/m2), and then the normalized short-circuit current was obtained. Simultaneously, the normalized short-circuit current was calculated using Eq. (16) from the PCR measurement.
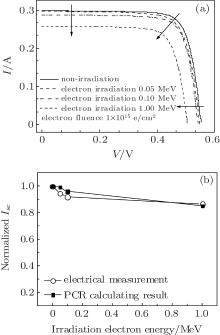
The I– V characteristic and the normalized short-circuit current Isc of the c-Si solar cell before and after electron irradiations are shown in Fig. 8.
 | Fig. 8. The dependences of (a) I– V characteristic and (b) normalized short-circuit current on the irradiation electron energy. |
From Fig. 8(a), it can be seen that the open-circuit voltage Voc and the short-circuit current Isc decrease with the increase of the irradiation electron energy, especially, the electron irradiation at the energy of 1 MeV results in strong reduction of Voc and Isc, this may be attributed to more traps induced by the irradiated ions which capture more carriers and reduce the carrier collection. From Fig. 8(b), it can be seen that the degradation of Isc is enhanced by the increase of the irradiation electron energy, and Isc is reduced by about 15% due to the electron irradiation at the energy of 1 MeV. The degradation of Isc is calculated using Eq. (16). It can been seen that the degradation of Isc in the PCR measurement is in a good agreement with that in the electrical measurement.
We introduced a noncontact photocarrier radiometry (PCR) method to evaluate the space monocrystalline silicon (c-Si) solar cell under low-energy (< 1 MeV) electron irradiation. The electron demonstrates a very strong penetrating power and induces more defects in the Monte Carlo simulation. A 1D two-layer carrier density wave model was used for the estimation of the carrier transport parameters by best-fit using two PCR channel signals (amplitude and phase), the increase of the irradiation electron energy caused large reduction of the carrier lifetime and diffusion length. Furthermore, the rear surface recombination velocity of the Si:p base of the c-Si solar cell at the irradiation electron energy of 1 MeV was obviously enhanced due to the electron passing through the whole cell. The degradation of the short-circuit current was evaluated by our PCR measurement, and it was in good agreement with the I– V characteristic evaluation by the electrical measurement. Therefore, PCR can be used as an effective contactless tool to evaluate the degradation of the space solar cell.
| 1 |
|
| 2 |
|
| 3 |
|
| 4 |
|
| 5 |
|
| 6 |
|
| 7 |
|
| 8 |
|
| 9 |
|
| 10 |
|
| 11 |
|
| 12 |
|
| 13 |
|
| 14 |
|
| 15 |
|
| 16 |
|
| 17 |
|
| 18 |
|