


Investigation of optoelectronic properties of pure and Co substituted α-Al2O3 by Hubbard and modified Becke–Johnson exchange potentials
[Rahnamaye Aliabad H. A.† ]
]
]
|
|


†Corresponding author. E-mail: Rahnama@hsu.ac.ir; rahnamaye@gmail.com
Advanced GGA + U (Hubbard) and modified Becke–Johnson (mBJ) techniques are used for the calculation of the structural, electronic, and optical parameters of α-Al2− xCo xO3 ( x = 0.0, 0.167) compounds. The direct band gaps calculated by GGA and mBJ for pure alumina are 6.3 eV and 8.5 eV, respectively. The mBJ approximation provides results very close to the experimental one (8.7 eV). The substitution of Al with Co reduces the band gap of alumina. The wide and direct band gap of the doped alumina predicts that it can efficiently be used in optoelectronic devices. The optical properties of the compounds like dielectric functions and energy loss function are also calculated. The rhombohedral structure of the α-Al2− xCo xO3 ( x = 0.0, 0.167) compounds reveal the birefringence properties.
The alumina compound has been widely studied experimentally and theoretically because of its wide range of applications and smaller number of atoms per unit cell.[1] It is crystallized in more than 15 different crystallographic phases.[2, 3] The α -Al2O3 is one of the most important oxides that has many technological applications, such as its use in insulators, ceramics, piezoelectric transducers, and electronic devices.[4] The results of Denis et al.[5] show that alumina doped with carbon and magnesium (Al2O3: C, Mg) has many applications in luminescence dosimetry.
Its properties depend mainly on the crystal structure, the purity of the oxide, and the preparation method. Most of the investigations reported up to now are concerned with the studies on the crystalline phases of α -Al2O3.[6] The results recently obtained by Yazdanmehr et al.[7] show that Al and O atoms are tightly connected by a strong dipole bond. Doping of alumina with magnetic elements, such as Ni, [8] Mo, [9] and Co, [10] leads to excellent optical properties and thermal stability. For example, the CoAl2O4 spinels have a wide range of industrial applications as ion conductors and chemical sensors.[11]
The aim of this study is to investigate the influence of Co on the electronic band structure, density of state, and optical properties of α -Al2O3. The structure of α -Al2O3 is rhombohedral that consists of close-packed planes of oxygen and aluminum. Its space group is 
The focus of the present work is to study the optoelectronic properties of α -Al2− xCoxO3 (x = 0.0, 0.167) that contains all Al atoms in the octahedral coordination, [13] and we consider the substitution of Al with Co (most likely), which occurs at the octahedral sites within the alumina structure.
The calculations were carried out with a self consistent scheme by solving the Kohn– Sham equations using a FPLAPW method in the framework of density functional theory (DFT) along with GGA, GGA + U, and mBJ using the Wien2k code.[14] The calculations were performed with 600 k-points and Rkmax = 7 (R is the smallest muffin-tin radius and kmax is the cut-off for the plane wave) for the convergence parameter, in which the calculations stabilized and converged in terms of the desired energy, e.g., less than 0.0001 Ry between steps. The magnitude of the largest vector in the charge density Fourier expansion or the plane wave cut-off was Gmax = 12. The muffin-tin radii for Al, Co, and O were 2.1 a.u., 2.38 a.u., and 1.92 a.u., respectively. The cut-off energy, which defines the separation of the valence and core states, was chosen to be − 6 Ry.
First of all, the calculations were carried out to obtain the relaxed lattice constant (theoretically) for each compound by minimizing the total energy of the unit cell of the corresponding crystal. The comparison of the calculated lattice constants with the experimental ones is summarized in Table 1. Furthermore, the calculated lattice parameter in the rhombohedral crystal structure is converted to the lattice parameters in hexagonal.
In order to calculate the optoelectronic properties of pure and doped α -Al2O3 by GGA + U, we assumed that the density matrix is diagonal, U is the same for all Coulomb interactions (Uij ≡ U), and J is also the same for all exchange interactions (Jij ≡ J). There are several methods to incorporate the U term, [16, 17] here we used the self-interaction correction (SIC) introduced by Anisimov and coworkers[18] as implemented in the Wien2k package. In the GGA + USIC method, the total energy may be written as

where N is the total number of local electrons and nm, σ is the orbital occupancy of the ℓ orbital in question (i.e., s, p, or d orbital) with spin σ . For transition metals, the ℓ orbital is usually the d orbitals. With an approximated correction value of U− J for the self-interaction correction, this is probably the best for a strongly correlated system and for a full potential method.
The effective U can be calculated within the augmented plane wave methods as implemented in the WIEN2k code.[19] Our results show that the effective U for the Co 3d orbital is about 4 eV. The study of Vladan et al. also shows that for transition metals, the suitable value for Hubbard U is 3– 5 eV.[20] The Hubbard potentials used in this work were Ueff = U − J = 4 eV, and it was applied only to the d states of Co.
The modified Becke– Johnson exchange (mBJ) potential Vxc[21] uses the mBJ exchange potential plus the GGA correlation potential and calculates the band gaps with accuracy similar to the very expensive GW calculations. This method yields gaps in very good agreement with the experiment. Therefore, we used this method for the calculation of the optoelectronic properties of pure and doped alumina. In addition, the spin polarization effect was implemented in GGA, GGA + U, and mBJ methods.
| Table 1. Calculated lattice constants (Å ), band gaps Eg (eV), static dielectric constants ε (0), and plasmon energies hω p (eV) by GGA, GGA + U, and mBJ for α -Al2− xCoxO3 (x = 0.0, 0.167) compounds. |
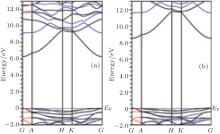
Figure 1 shows the calculated band structures of α -Al2O3. The Fermi energy is on the top of the valence band. The direct band gaps calculated by GGA and mBJ for pure α -Al2O3 are 6.3 eV and 8.5 eV, respectively. The band gap calculated by mBJ is very close to the experimental value (8.7 eV).[22] The spin polarized band structures of the α -Al1.833Co0.167O3 compound calculated with GGA, GGA + U (U= 4 eV), and mBJ are shown in Fig. 2. The results for
 | Fig. 1. Calculated band structures for α -Al2O3 by (a) GGA and (b) mBJ. |
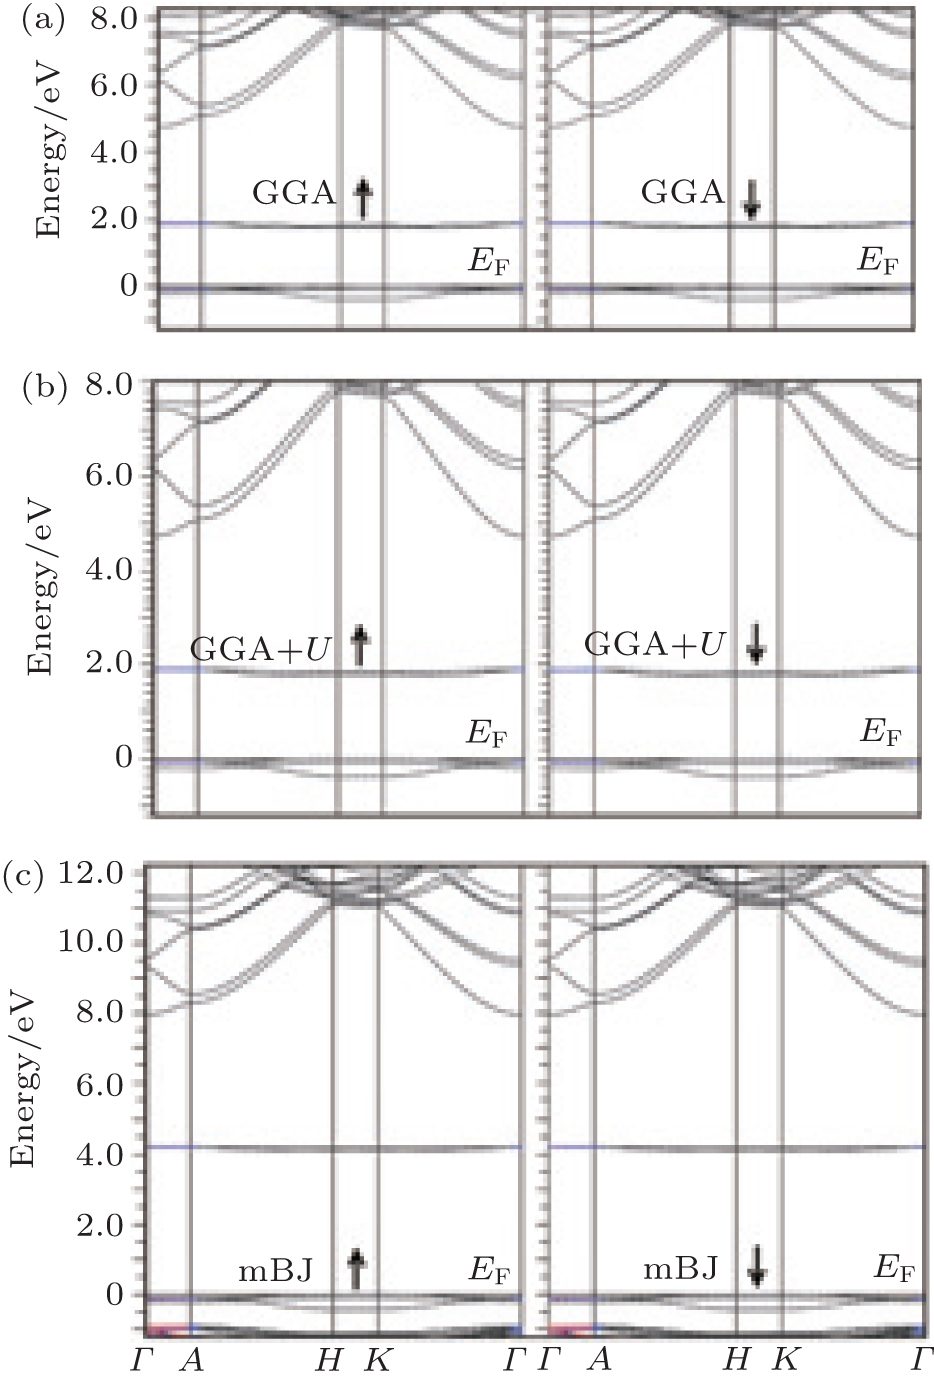 | Fig. 2. Calculated band structures for α -Al1.833Co0.167O3 with (a) GGA, (b) GGA + U, and (c) mBJ. |
both states (spin up and spin down) are the same. The band gap decreases for the Co doped alumina. There is no spin splitting by applying the three exchange correlation potentials. Since in non magnetic compounds, the spin-up density of electrons is equal to the spin-down one, the total magnetic dipole moment of electrons is zero and there is no spin splitting for electrons.
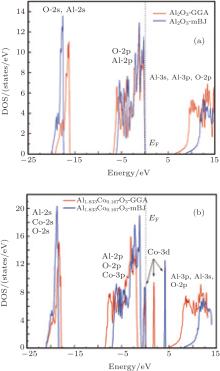
The electron distribution in the energy spectrum is described by the density of states. The total densities of states for up states of α -Al2O3 and α -Al1.833Co0.167O3 obtained by GGA and mBJ are shown in Fig. 3. The energy gap seems to be very well compatible with the band structure. The 2s orbitals make the core states, the contribution of O 2p and Al 2p orbitals is more in the top of the valence band, and the bottom of the conduction band includes O 2p, Al 3s, and Al 3p orbitals. By adding the cobalt impurity, the gap decreases in both states (spin up and down) due to the existence of Co 3d in the conduction band.
 | Fig. 3. Total densities of states for (a) α -Al2O3 and (b) α -Al1.833Co0.167O3 obtained by GGA and mBJ. |
Transitions between occupied and unoccupied states, including plasmons and single particle excitations, are caused by the photon electric field. The dielectric function ε (ω ), which describes the linear response of a system to an electromagnetic radiation, can be obtained via the following well-known relation:[23]

The corresponding real part of the interband expression is obtained by the Kramers– Kronig transformation

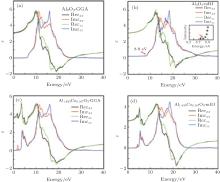
Figure 4 shows the real and imaginary parts of the dielectric functions of pure and doped α -Al2O3 in the x and z directions. The real part of the dielectric function gives us information about the electronic polarizibility of a material. The static dielectric constants, ε (0), are given in Table 1. In comparison with GGA, mBJ gives optical spectra in good agreement with the experiment.[24] Therefore, we discuss the mBJ results. The band gap of α -Al2O3 is larger than that of α -Al1.833Co0.167O3 and ε (0) of pure alumina is smaller than that of the doped alumina, hence ε (0) varies inversely with the band gap for these compounds. Beyond the static dielectric constant, ε xx(ε zz) increases and reaches a peak value of 4.84 (5.08) at 12.08 eV (12.44 eV) for α -Al2O3. After the maximum, ε xx (ε zz) decreases and is below zero in the negative regime for the range 19.73– 29.89 eV (18.47– 29.89 eV) for α -Al2O3. A material is metallic when the real part of the dielectric function is negative, and dielectric otherwise. Hence in these ranges, α -Al2O3 is metallic. Substituting by Co changes the configuration of the dielectric function and creates new fluctuation at 4.07– 8.79 eV for α -Al1.833Co0.167O3. The creation of this fluctuation at low energies may affect the optical properties.
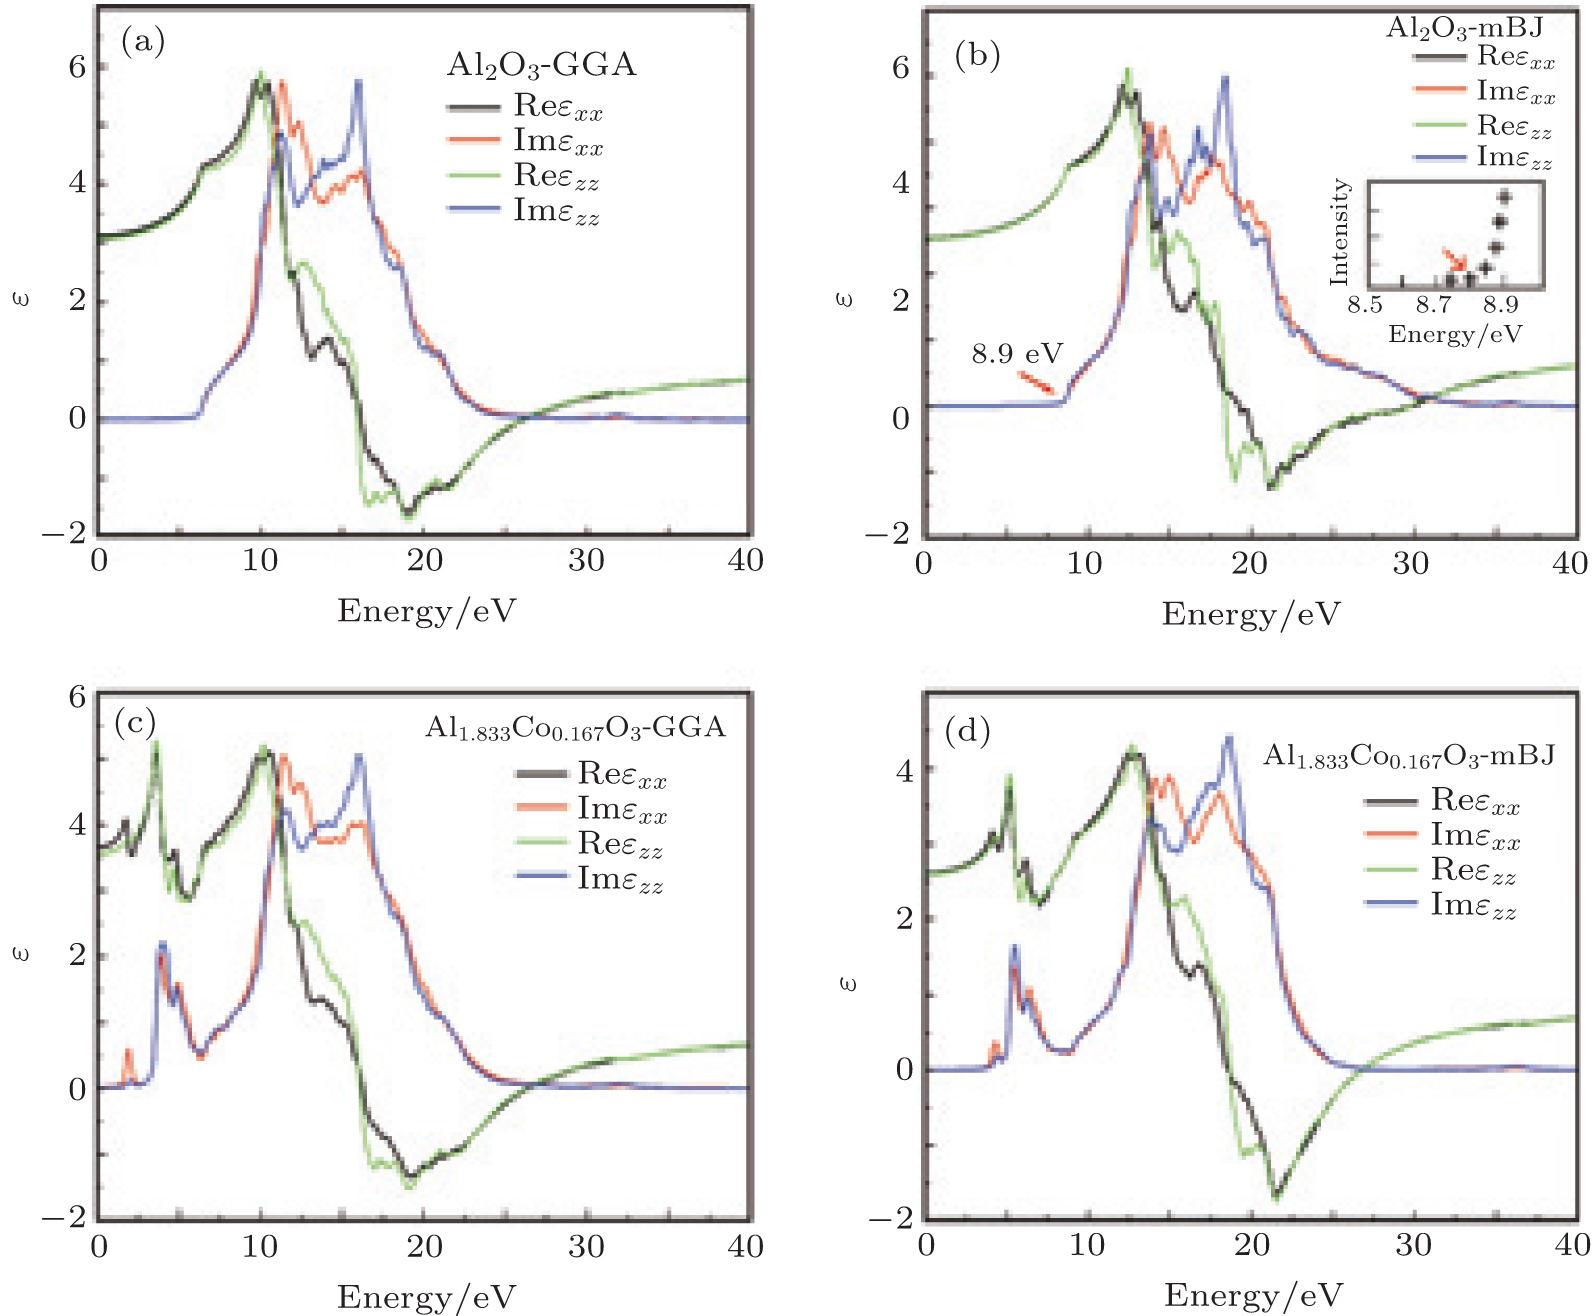 | Fig. 4. Real and imaginary parts of the dielectric functions of (a), (b) α -Al2O3 and (c), (d) α -Al1.833Co0.167O3 obtained by GGA and mBJ. The inset experiment result is from Ref. [24] for pure α -Al2O3. |
The peaks in the imaginary part of the frequency dependent dielectric function show several transitions from the valence band (VB) to the conduction band (CB). The first peak, in both compounds, is equal to the band gap energy. The other peaks show the transitions from the lower valence bands to the conduction band. The peaks in the range of 8.5– 14.6 eV for α -Al2O3 appear due to the transitions of electrons from the O 2p and Al 2p states to the Al 3s, Al 3p, and O 2p states in the CB, while the peaks in the range of 14.6– 28.5 eV are due to the transitions of electrons from the O 2s and Al 2s states of the VB to the unoccupied states of the CB. The peaks in the range of 4.07– 8.79 eV for α -Al1.833Co0.167O3 appear due to the transitions from Al 2p, O 2p, Co 3p, and Co 3d (VB) to the unoccupied states of Co 3d and other conduction band states, while the peaks in the range of 10.8– 24.5 eV are due to the transitions of electrons from Al 2s, Co 2s, and O 2s to the unoccupied states of the CB.
The electron energy-loss function describes the energy loss of a fast moving electron by interaction with a material. It plays an important role in the material design related to the dielectric.[25] These spectroscopes have the advantage of covering the complete energy range, including non-scattered and elastically scattered electrons (zero loss), as well as electrons that excite an atom' s outer shell (valence loss) or valence interband transitions. One can calculate the EEL spectrum from the following relation:[26]

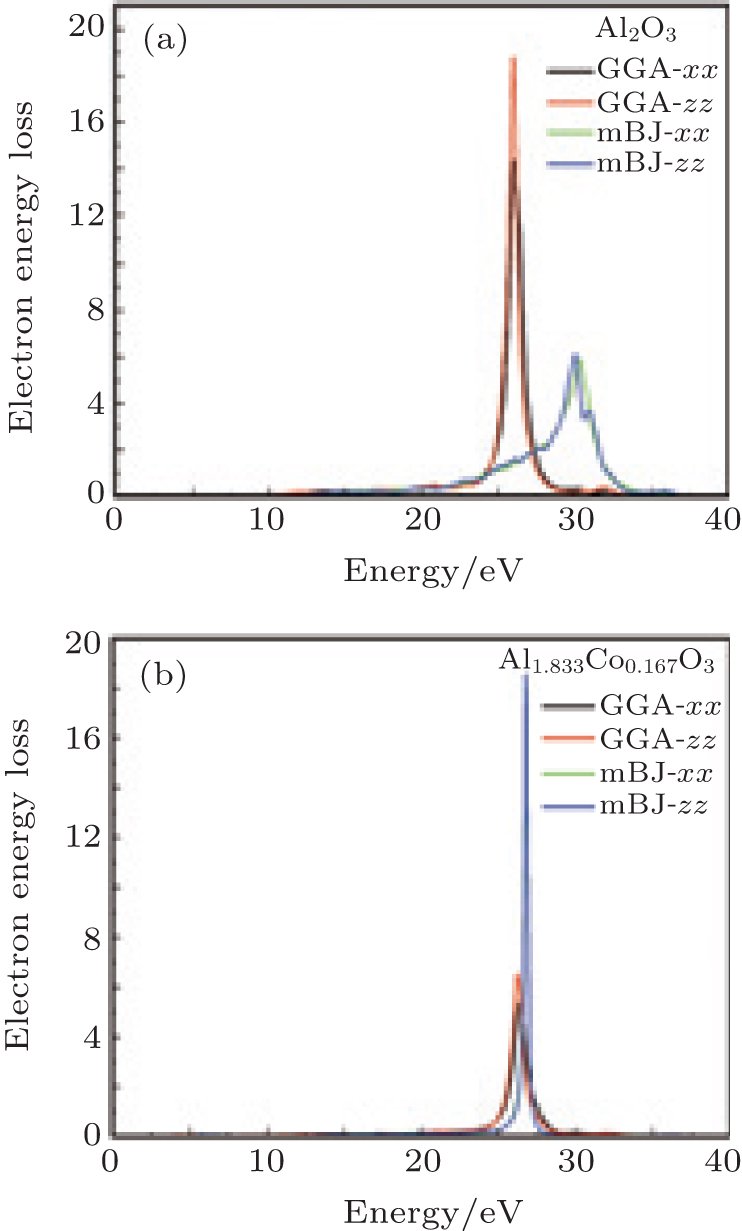 | Fig. 5. Electron energy loss spectroscopy for (a) α -Al2O3 and (b) α -Al1.833Co0.167O3 obtained by GGA and mBJ. |
Figure 5 shows the electron energy loss spectroscopy of α -Al2O3 and α -Al1.833Co0.167O3. The energy of the main maximum of im[− ε − 1(ω )] is assigned to the energy of volume plasmon hω p. The hω p obtained in this work and by others are given in Table 1. It is usually a broad peak in mBJ, situated at 28– 31 eV and 25– 26 eV for α -Al2O3 and α -Al1.833Co0.167O3, respectively, which corresponds to a collective excitation of electrons in the crystal. From the partial density of states of the O atoms, it can be seen that the O 2s state has a narrow band separated from the upper valence band, therefore, the participation of the O 2s state in the volume plasmon excitation is rather weak. For the α -Al1.833Co0.167O3 compound, the energy of volume Plasmon hω p is lower than that for pure α -Al2O3 in mBJ calculation. There is another small peak at lower energy, 5.7 eV, which is mainly due to the Co 3d state. The intraband transitions are due to the excitations of the valence electrons into the conduction band. It is possible to obtain the band gap from the low energy loss spectrum. The band gaps calculated with EELS are in close agreement with the band structure results. The high energy region is characterized by atomic ionization, in which the electrons are ejected from the core shells of the atoms (Al, O, and Co 2s). This process requires that the core electron receives energy greater than the minimum energy of the conduction band.
In this study, we have applied the FP-LAPW method to investigate the electronic and optical properties of α -Al2O3 and α -Al1.833Co0.167O3 using different approximations such as GGA, GGA + U, and mBJ. The direct band gaps calculated by GGA and mBJ for α -Al2O3 are 6.3 eV and 8.5 eV, respectively. The band gap obtained by the mBJ method is in very good agreement with the experiment. The calculations show that the energy gap reduces by adding Co impurity to α -Al2O3. There is no spin splitting in the α -Al1.833Co0.167O3 compound by all approximations. For α -Al2O3, a static dielectric function of 2.54 (2.53) and an EEL spectrum of 30.37 eV (30.05 eV) in the x (z) direction are obtained by mBJ. The substitution of Co with Al increases the dielectric function to 2.61 (2.60) for α -Al1.833Co0.167O3, and this is mainly due to the states originating from Co 3d in the conduction band. The mBJ results also show that substituting by Co changes the configuration of the dielectric function and creates new fluctuation at 4.07– 8.79 eV for α -Al1.833Co0.167O3. For the α -Al1.833Co0.167O3 compound, the energy of volume Plasmon hω p is lower than that for pure α -Al2O3. These results are useful to obtain a satisfactory explanation for different approximations used in the calculations of optoelectronic properties and also reveal the properties of α -Al2O3 substituted with Co.
The author is grateful to P. Blaha (Vienna University of Technology, Austria) for his technical assistance in using the Wien2k code.
| 1 |
|
| 2 |
|
| 3 |
|
| 4 |
|
| 5 |
|
| 6 |
|
| 7 |
|
| 8 |
|
| 9 |
|
| 10 |
|
| 11 |
|
| 12 |
|
| 13 |
|
| 14 |
|
| 15 |
|
| 16 |
|
| 17 |
|
| 18 |
|
| 19 |
|
| 20 |
|
| 21 |
|
| 22 |
|
| 23 |
|
| 24 |
|
| 25 |
|
| 26 |
|
| 27 |
|
| 28 |
|
| 29 |
|
| 30 |
|
| 31 |
|
| 32 |
|
| 33 |
|
| 34 |
|
| 35 |
|