Gas adsorption and accumulation on hydrophobic surfaces: Molecular dynamics simulations
[Luo Qing-Qun, Yang Jie-Ming† ]
]
]
|
|


†Corresponding author. E-mail: yangjieming@tyut.edu.cn
*Project supported by the National Natural Science Foundation of China (Grant No. 21376161).
Molecular dynamics simulations show that the gas dissolved in water can be adsorbed at a hydrophobic interface and accumulates thereon. Initially, a water depletion layer appears on the hydrophobic interface. Gas molecules then enter the depletion layer and form a high-density gas-enriched layer. Finally, the gas-enriched layer accumulates to form a nanobubble. The radian of the nanobubble increases with time until equilibrium is reached. The equilibrium state arises through a Brenner–Lohse dynamic equilibrium mechanism, whereby the diffusive outflux is compensated by an influx near the contact line. Additionally, supersaturated gas also accumulates unsteadily in bulk water, since it can diffuse back into the water and is gradually adsorbed by a solid substrate.
Nanoscopic gaseous domains formed at hydrophobic interfaces are recent discoveries in condensed matter physics. They indicate that the gas dissolved in water can be adsorbed at a hydrophobic interface. The first direct experimental evidence for such gas adsorption was provided by Miller et al.[1] in 1999, using Fourier-transform infrared spectroscopy (FTIR) to investigate butane-saturated water on a hydrophobized silicon surface. The spectra contained peaks corresponding to butane gas.
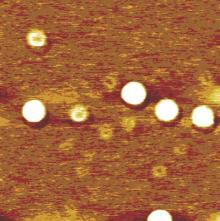
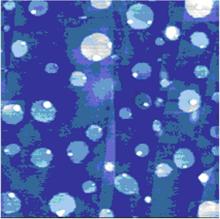
Opinion is divided on the nature of such gas adsorption, with some researchers favoring the formation of individual nanobubbles, [2– 15] but others envisaging the formation of a gas layer.[16– 22] Lou et al.[3] used tapping mode atomic force microscopy (AFM) to obtain topological images of individual nanobubbles at a water/mica interface, as shown in Fig. 1. However, the topological images obtained by Tyrrell and Attard[4] using AFM showed densely packed arrays of nanobubbles, which, due to their crowding and tip distortion, [11] led to the new concept of “ soft domains” .[21] Such soft domains termed “ micropancakes” were first identified in the nanobubble research of Zhang et al., [16] which are nanometer-high and micron-wide gas layers that form at the solid/liquid interface, as shown in Fig. 2. Thomy’ s[22] description of a micropancake is that the gas molecules are condensed within there or four molecular layers, where each layer is sufficiently densely packed to support the layers above.
It is generally understood that the gas dissolved in water can be adsorbed at a hydrophobic interface. However, some issues remain to be resolved. (i) Is the gas present in the form of several individual bubbles or a gas layer? (ii) What are the details of the formation process? (iii) What are the mechanisms that make the gas stable? If the radius of a nanobubble is nanoscale (≤ 200 nm), the inner pressure will reach hundreds of atm according to the Laplace equation, which should make them quickly disperse, yet they are apparently stable for a long time.[8] (iv) What is the law of the adsorbed gas flow?
The molecular dynamics (MD) community has become more interested in gas adsorption and accumulation. Because the temporal resolution of MD simulations is of the order of femtoseconds (fs) and the motion of all atoms is resolved, the spatial resolution is intrinsically high enough to resolve gas adsorption and accumulation.
In 2006, Dammer et al.[23] used MD simulation to study the effects of dissolved gas on liquid– wall and liquid– gas interfaces. They found gas enrichment at walls, which for hydrophobic walls could correspond to an increase in gas density of more than two orders of magnitude compared with that in the bulk liquid.
In 2008, Wang et al.[24] simulated N2 and H2 at the water/graphite interface at ambient temperature and pressure. They found that both N2 and H2 molecules are first adsorbed and then accumulate at the interface. However, the process of adsorption and the process of accumulation were simulated independently. The simulation of accumulation was modeled on the adsorption results.
In 2009, Sendner et al.[25] simulated several specific gases (Ar, Ne, O2, and an “ ideal” gas type “ X” ) dissolved in a real water model on a diamond-like structure. They found gas enrichment within approximate 1 nm of a hydrophobic surface for all gas types investigated. In contrast, no enrichment occurred on a diamond surface that had been rendered hydrophilic by the addition of OH groups. Furthermore, they showed that the hydrophobic enrichment effect is, at most, weakly dependent on the degree of supersaturation.
In 2012, Weijs et al.[26] studied surface nanobubbles by an MD simulation of ternary (gas, liquid, and solid) systems of Lennard– Jones fluids. They found that in heavily gas-supersaturated liquids, nanobubbles nucleate spontaneously and can then migrate towards the surface. They also found gas flows near the contact line. These gas flows are caused by symmetry breaking due to the solid substrate, and are suggestive of a dynamic equilibrium condition, whereby the diffusive outflux is compensated by an influx near the contact line.
Evidently, molecular dynamics research has focused more on gas adsorption than on accumulation. The reason for this is insufficient simulation time. As MD simulation is limited by computational power, the time of simulation is usually less than the nanosecond (ns) level. In this study, we
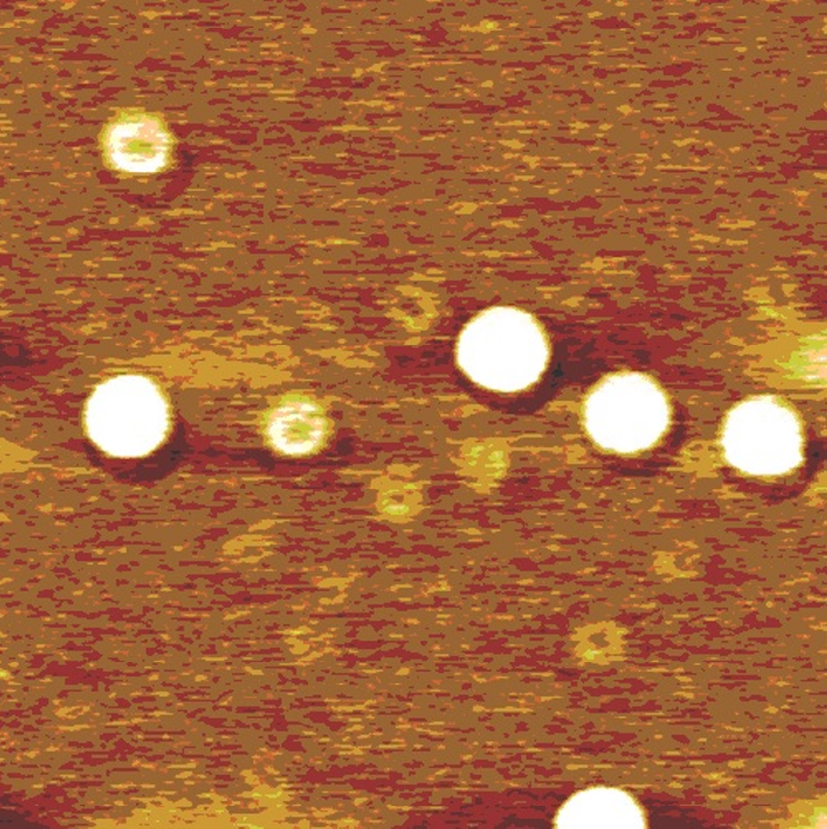 | Fig. 1. Image of surface nanobubbles created at a water/mica interface. The lateral scale is 1mμ × 1mμ .[3] |
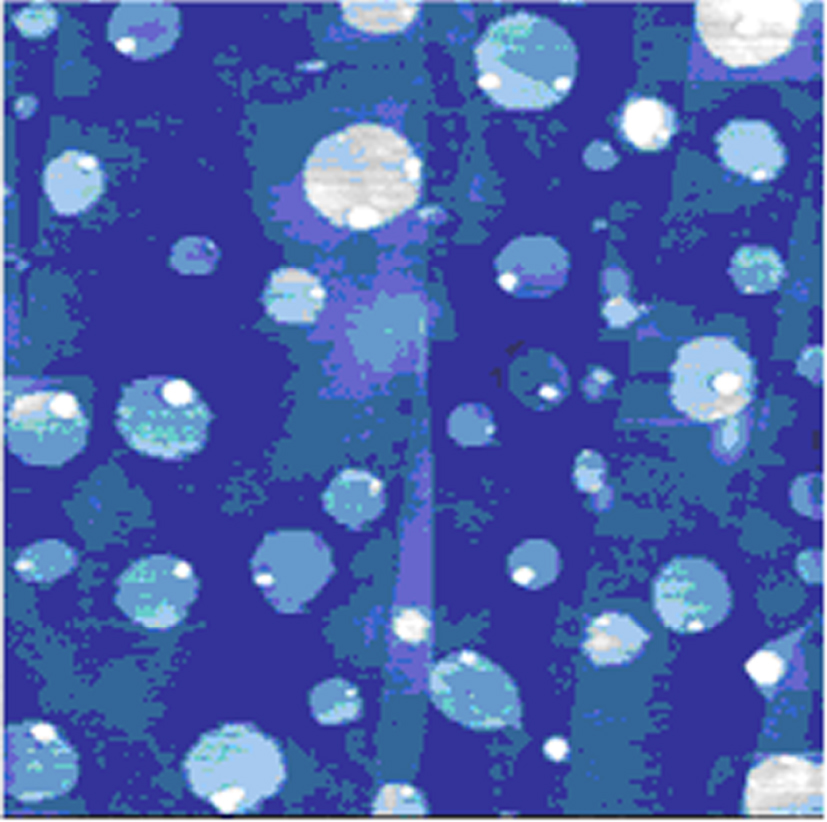 | Fig. 2. Micropancakes on the surface of highly oriented pyrolytic graphite. The image represents 5μ m × 5μ m.[16] |
performed an MD simulation of gas adsorption and accumulation continuously for 300 ns. We studied the process of adsorption in detail and are able to summarize the rules of accumulation.
We describe the computational model set and diagnostics method in Section 2. The core content of the paper is laid out in Section 3. The need for water as a necessary condition for gas accumulation is explained in Section 3.1. The depletion layer and the process of gas adsorption are discussed in Section 3.2. The structure and the contact angle of gas adsorption and accumulation are described in Section 3.3. Stability and flows of adsorbed gas are described in Section 3.4. Finally, Section 4 contains the conclusions and outlook.
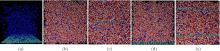
To study gas adsorption and accumulation, a series of binary systems and tertiary systems were simulated, as specified in Table 1 and shown in Fig. 3.
| Table 1. A series of models for MD simulations. |
All simulations were performed for fixed numbers of molecules, at constant volume and temperature, using the GROMACS code; [27] the system at T = 300 K was coupled to a Berendsen thermostat. Periodic boundary conditions were applied in the x, y, and z directions. The particle mesh Ewald method[28, 29] was used to treat long-range electrostatic interactions with a cut-off of 1 nm. The integration time step was 2 fs. Bond stretching between two covalently bonded atoms i and j was represented by a harmonic potential V(r) = 1/2kb(r − b0)2, where kb and b0 represent the force constant and standard bond length of the harmonic potential, respectively. The interactions between molecules were expressed by the Lennard– Jones potential function U = 4ε ij[(σ ij/r)12 − (σ ij/r)6], [29] where σ ij and ε ij are the length scale and the energy scale of the Lennard– Jones potential, respectively. The parameters between particles obeyed the rules: σ ij = (σ ii + σ jj)/2 and ε ij = (ε iiε jj)1/2.
In all of the simulations, nitrogen was used as the gas phase. Carbon atoms were fixed in their respective initial positions to represent hydrophobic surfaces. About 1000 carbon atoms were set in an area of 10 × 10 nm2 according to the atomic diameter of 3.40 Å , and about 800 carbon atoms were set in an area of 9 × 9 nm2, which is similar to graphite. SPC[30] was used for water with a number density of 33/nm3.
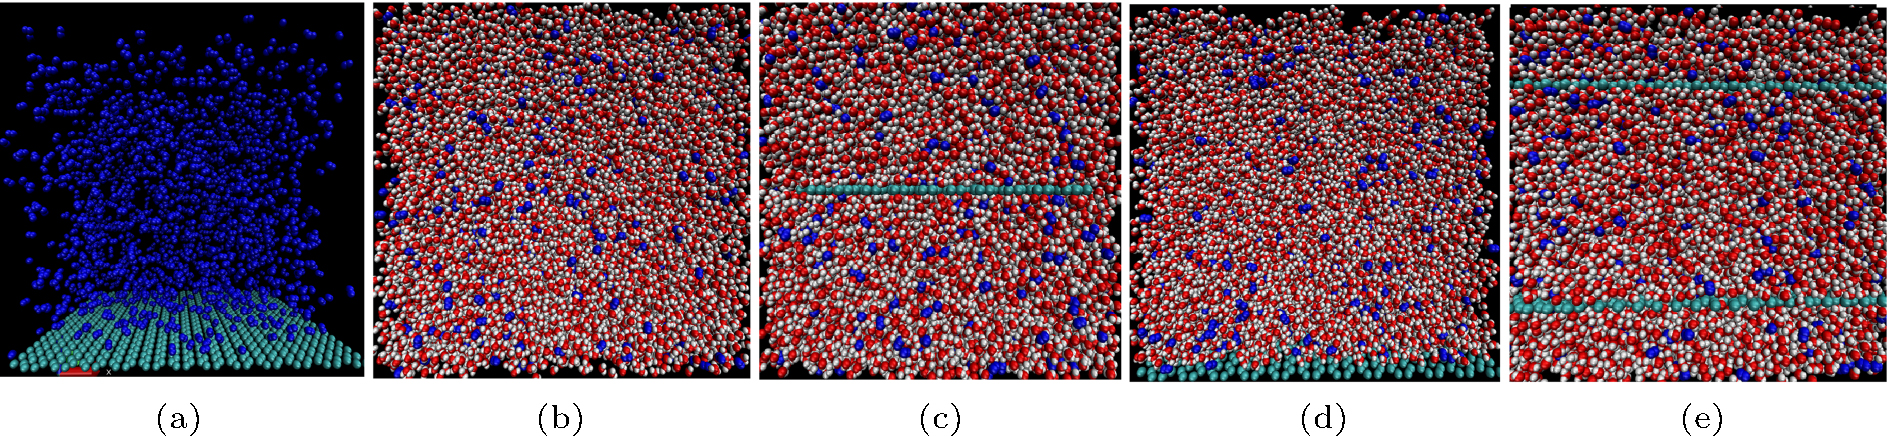 | Fig. 3. (a) Model of Case 1. (b) Model of Case 2. (c) Model of Case 3. (d) Model of Case 4. (e) Model of Case 5. |
Force-field parameters for gas and solid are listed in Table 2. The Amber 96[31] force field was used in all simulations.
| Table 2. Simulation parameters. |
Density matrices and nephograms and density profiles were obtained from the trajectories of MD simulation by introducing cubical bins. The grid sizes of the bins were 0.02 nm and they were of equal volume.
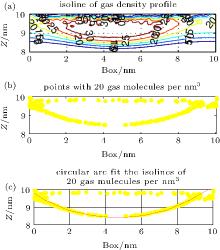
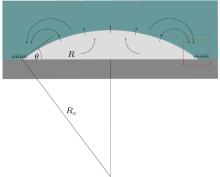
Isolines of density (Fig. 4(a)) and points of the same density (Fig. 4(b)) were extracted from the density matrix. A best-fit circular arc of these points was then extrapolated, as shown
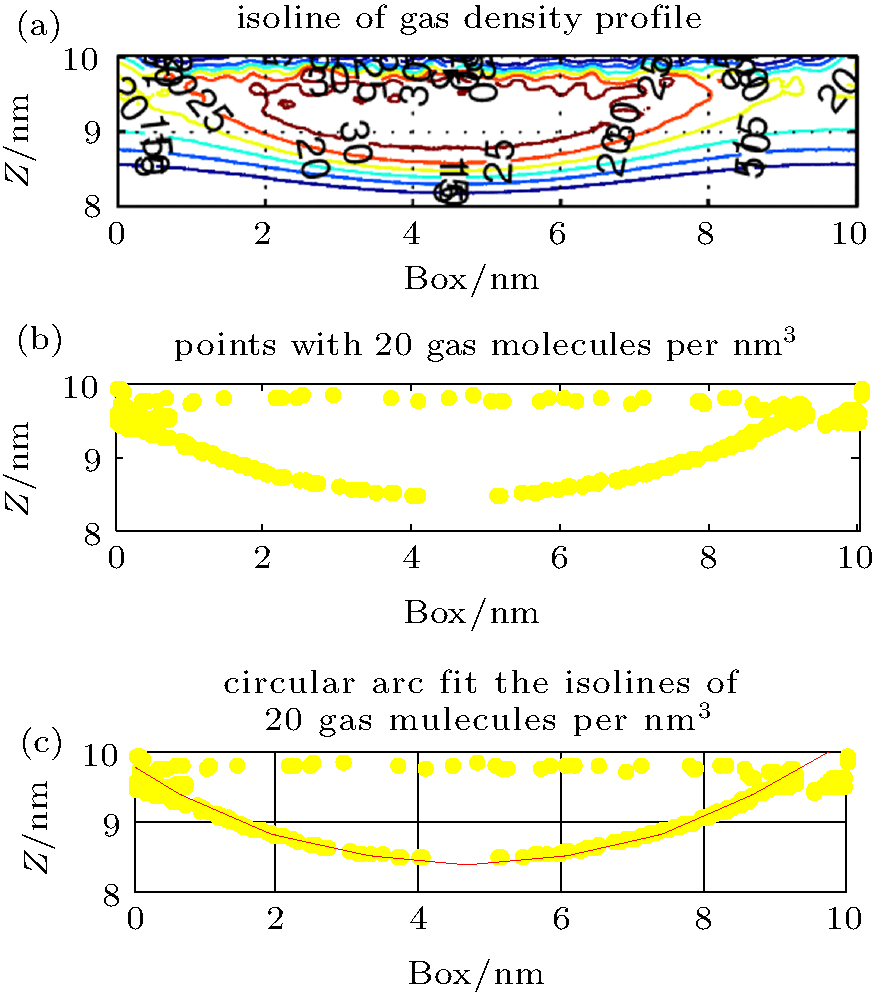 | Fig. 4. (a) Isolines of gas density at 200 ns obtained from a density matrix. The yellow line is the isoline with 20 gas molecules per nm3. (b) The points with 20 gas molecules per nm3. (c) Best-fit circular arc of the isoline with 20 gas molecules per nm3. |
in Fig. 4(c). The radius Rc and the height h of the circular arc represent the radius and the height of the isopycnic surface, respectively. The contact angle of the isopycnic surface was calculated from Rc and h.
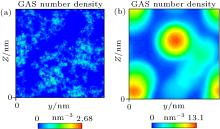
Simulation of Case 1 was carried out to study whether gas molecules can adsorb on a substrate in the absence of water. The results showed that gas molecules cannot accumulate and cannot be adsorbed by the substrate, as indicated in Fig. 5(a). Simulation of Case 2 was performed to study whether gas molecules can accumulate in water without a substrate. As shown in Fig. 5(b), supersaturated gas molecules can indeed accumulate in water. Hence, water is a necessary condition for gas accumulation.
 | Fig. 5. (a) Nephogram of gas density obtained by simulation of Case 1 shows that gas molecules distribute uniformly. (b) Nephogram of gas density obtained by simulation of Case 2 shows that gas molecules accumulate in water. |
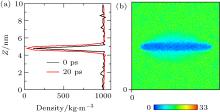
We next turned our attention to what happens when the hydrophobic surface closely approaches water. Frank and Stillinge[32, 33] found that the water layer adjacent to the solid was immediately depleted in comparison to the bulk water. Depending on the nature of the substrate, the density may be halved, with the effect extending from a few Å to a nanometer.[34– 38] The content of the depletion layer in terms of vapors or gas dissolved in water was unclear. Case 3 was simulated to address this issue. In the initial state of Case 3 (0 ps), the water molecules were set uniformly in the box, except in the space occupied by the C atoms. We compared the water density at 0 ps with that after 20 ps of simulation, as shown in Fig. 6(a). It can be seen that the water density at 20 ps was distinctly lower than that at 0 ps near the graphite, showing that a depletion layer arises at ca. 20 ps (see Fig. 6(b)). This verified that the formation of the depletion layer was caused by water and substrate because there was no gas in the box.
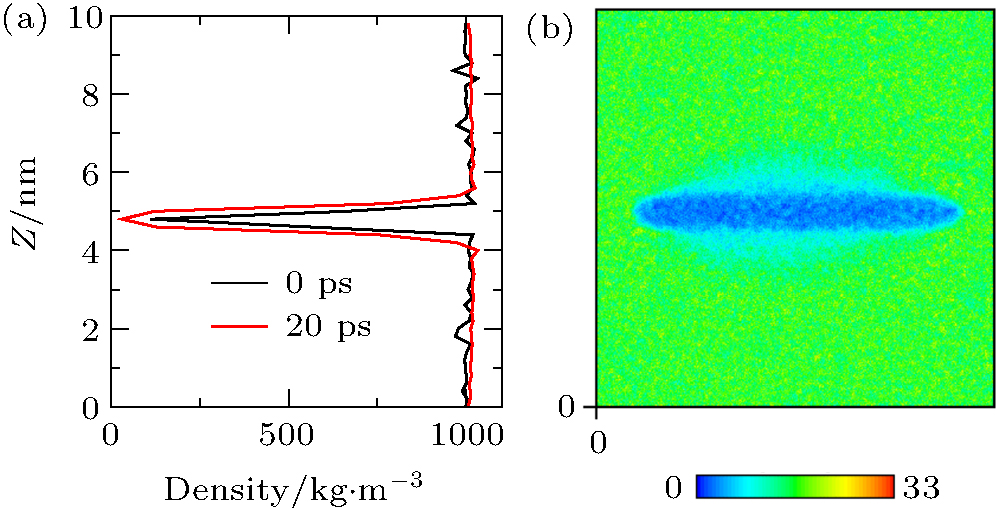 | Fig. 6. (a) Water densities at 0 ps and 20 ps obtained by simulation of Case 3 show that, near the graphite, the density at 20 ps is distinctly lower than that at 0 ps. (b) Nephogram of water density at 20 ps obtained by simulation of Case 3 shows that the depletion layer appears at 20 ps. |
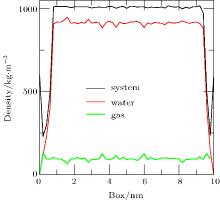
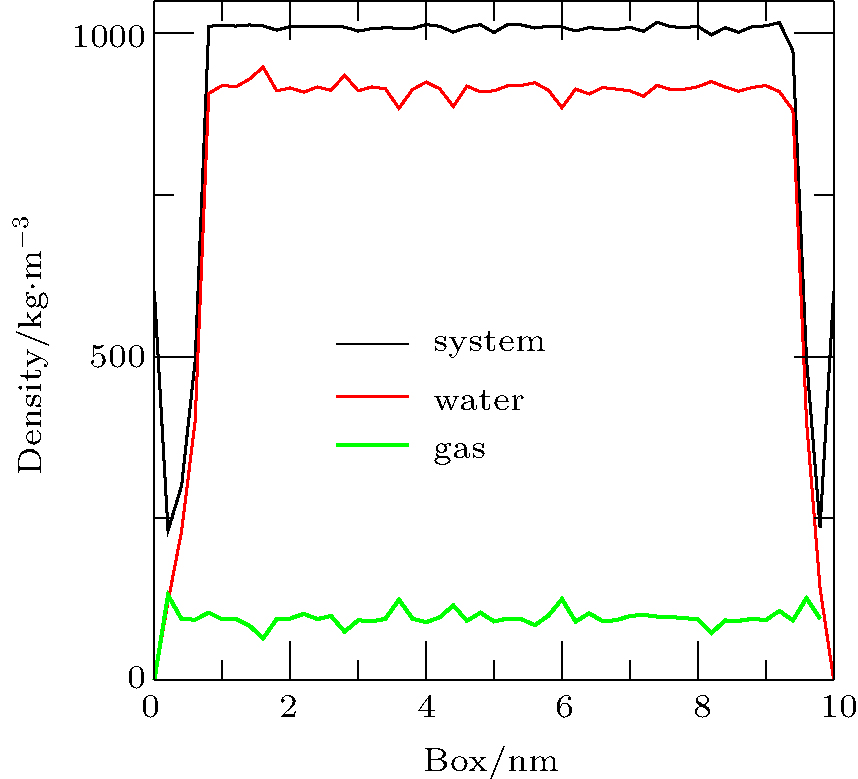 | Fig. 7. Density distributions of system, water, and gas at 20 ps obtained by simulation of Case 4. The diagram shows that the densities of the system and the liquid were significantly reduced on either side of the substrate, but the density of the gas was almost unchanged. Note that the positions 0 and 10 on the x axis are the same under periodic boundary conditions and they are the location of the substrate. |
To address the issue of whether the depletion layer can contain gas molecules, we performed the simulation of a ternary system (gas, liquid, and solid) as Case 4. When the simulation was performed for 20 ps, the density distributions of the system, water, and gas were shown in Fig. 7. A “ valley” appears in the curves of system density and water density on either side of the substrate, which is a feature of depletion layers. However, no obvious changes are seen in the curve of gas density. The results show that the depletion layer is still caused by water and substrate in the ternary system, but that it contains gas molecules.
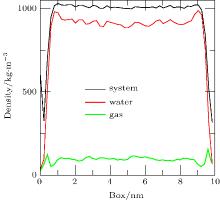
When the simulation (Case 4) is performed for 40 ps, the densities of the system, water, and gas are shown in Fig. 8. In the depletion layer, the gas density increases significantly whereas the water density decreases. However, in the adjoining area of the depletion layer, the gas density decreases significantly and the water density increases significantly. The results show that gas molecules near the depletion layer could enter it. In addition, fluctuations in the gas density in the bulk water become larger, indicating accumulation of the gas dissolved in the bulk water.
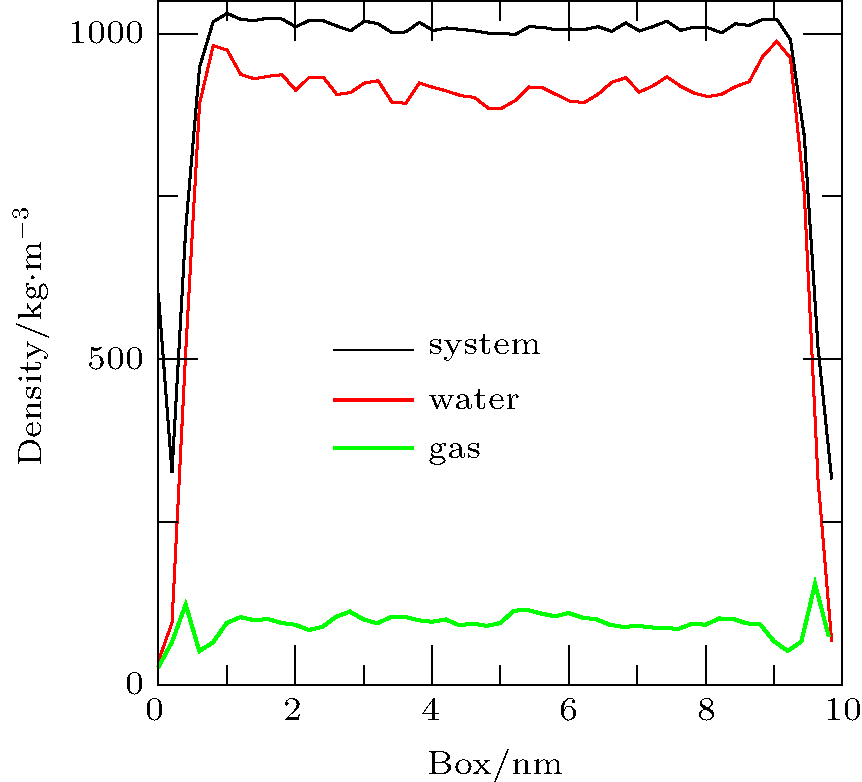 | Fig. 8. Density distributions of system, water, and gas at 40 ps obtained by simulation of Case 4. In the depletion layer, the density of gas increases significantly and the density of water decreases; however, adjoining the depletion layer, the density of gas decreases significantly and the density of water increases significantly. In addition, the fluctuations in the gas density in the bulk water increase. |
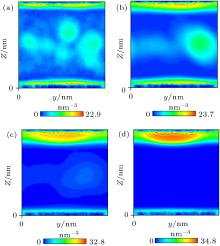
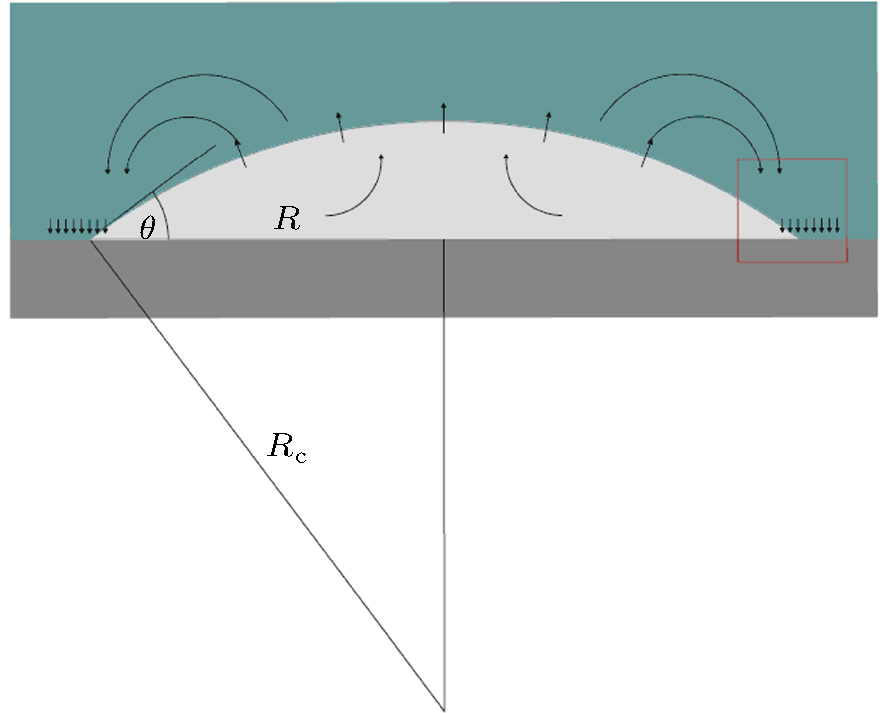
Nephograms of gas density at different times are shown in Fig. 9. According to these nephograms and the effects of the depletion layer, we can summarize the process of gas adsorption and accumulation as follows. First, gas molecules enter the depletion layer and are adsorbed by the substrate to form a high-density gas-enriched layer. The adsorbed gas molecules then accumulate to form a “ nanobubble” . At the same time, supersaturated gas in the bulk water also accumulates unsteadily, as shown in Figs. 9(a) and 9(b). It diffuses back into the water and is gradually adsorbed by the substrate. The process of gas accumulation shows that a “ nanobubble” has a “ zone of control” in the substrate around it, from which it attracts gas. The dynamic equilibrium model of Brenner and Lohse, as shown in Fig. 10, [39] certainly starts to look appealing.
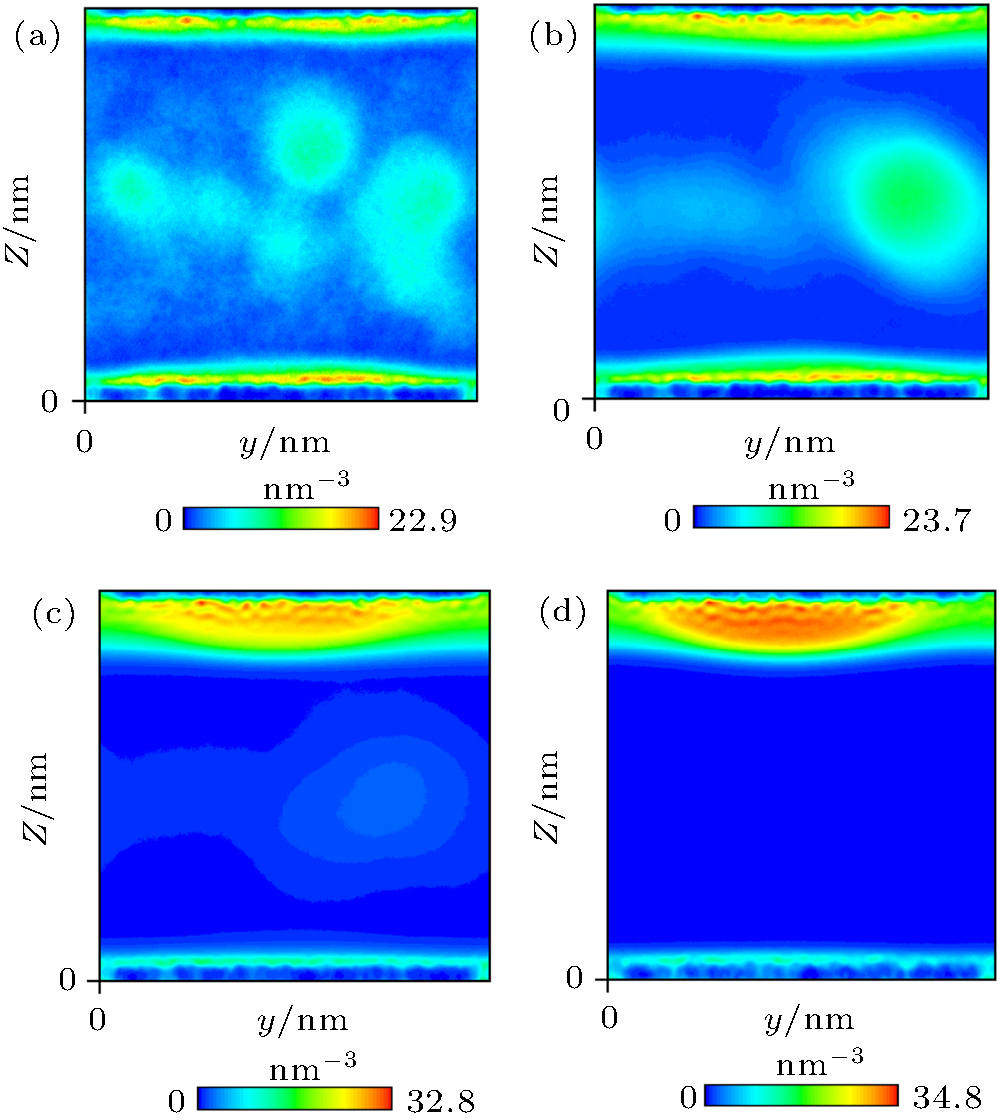 | Fig. 9. Nephograms of gas density at different times obtained by simulation of Case 4. (a) 1 ns; (b) 10 ns; (c) 100 ns; (d) 300 ns. |
Defining the gas/liquid interface is the key to studying the structure of gas adsorption and accumulation. From Fig. 9, it can be seen that there was a mixed area of gas and water. As the density of pure water at T = 300 K corresponds to about 33 molecules per nm3, we consider a water density greater than 33 molecules per nm3 to correspond to pure water. According to the simulation, we found that when the gas density exceeded about 20 molecules per nm3, there were no water molecules in the gas. Hence, we consider the gas density greater than 20 molecules per nm3 to correspond to the pure gas. On this basis, we define the gas surface as an isopycnic surface with 20 gas molecules per nm3 and the water surface as an isopycnic surface with 33 water molecules per nm3.
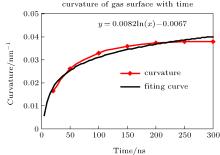
The curvature of the gas surface increased with time, but the rate of increase gradually decreased. The curve could be roughly fitted by a plot of the function y = 0.0082ln(x) − 0.0067, as shown in Fig. 11. Assuming that the gas molecules can ultimately accumulate into a sphere and that the maximum density is 34.8 molecules per nm3, the radius of a sphere containing 2000 gas molecules should be ca. 2.394 nm. According to the above function, the accumulation time should be ca. 5.726 × 1051 ns (≈ 1.36 × 1036 years). This can be deemed to be an impossible event. Moreover, the increase rate of the curvature is lower than the growth rate of the function according to the diagram. Therefore, gas molecules cannot accumulate indefinitely and the shape of the gas surface will reach a stable equilibrium after a certain time, which is ca. 200 ns according to the results of the simulation. The final shape of the gas surface is a spherical crown with radius of curvature Rcg ≈ 10 nm and height h ≈ 1.6 nm. However, the curvature of the water surface was always between 400 and 450 nm throughout the simulation and the final height was ca. 1.8 nm. As is customary, the gas/liquid interface was defined as an isopycnic surface with 16.5 water molecules per nm3 (half of the water density). The radius of curvature and height were Rc ≈ 50 nm and h ≈ 1.7 nm, and the contact angle of the nanobubble was approximately 14.98° , in agreement with experimental values of around 15° .[7, 9, 20, 40]
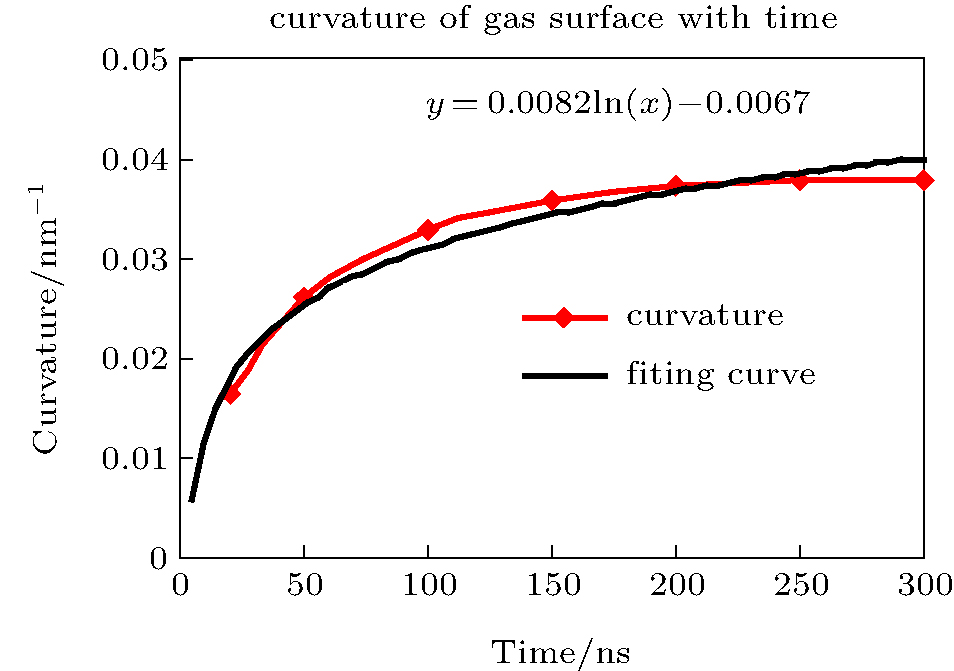 | Fig. 11. Curvature of gas surface with time. Curvature of the gas surface increases with time, but the rate of increase gradually decreases. The plot is roughly similar to a plot of the function y = 0.0082ln(x) − 0.0067. |
The most puzzling question concerning the nanobubble as described in Section 1 is the “ high inner pressure” calculated by the Laplace equation P = 2γ /Rc, where Rc is the radius of curvature of the nanobubble, and γ is the surface tension. If one uses γ = 72.75 × 10− 3 N· m− 1 as the surface tension of water and considers the water surface (Rcw = 400– 450 nm) as the interface of the nanobubble, the inner pressure of the nanobubble should be P = 1.146 − 1.019 atm. The result is similar to the experimental values obtained by Zhang et al.[41, 42] in two ways, that is, from the width of the rotational fine structure (Pgas < 2 atm) and from the intensity in the IR spectrum ( Pgas = 1.1 ± 0.4 atm). Hence, the small difference in gas pressure between the bubbles and the ambient environment (1 atm) is consistent with their long lifetime.
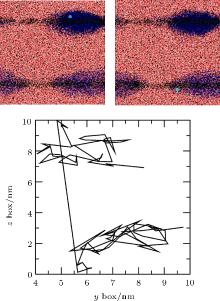
In order to study the flow of adsorbed gas, simulation of Case 5 was performed. In the first 5 ns, gas molecules were adsorbed by two pieces of graphite and formed two respective nanobubbles. In further simulations, we analyzed the motion of gas molecules and found the flows to be consistent with the Brenner– Lohse model.[39] For example, figure 12 shows the positions and trajectory of a gas molecule containing the 5th N atom at two frames from 5.075 ns to 5.095 ns. Because of the periodic boundary condition, the top surface coincides with the bottom surface. The straight line from top to bottom shows that the atom escapes from the top of the upper bubble and enters the lower bubble from the edge of the bottom surface, which is consistent with the Brenner– Lohse model.[39] Taking this together with the process of accumulation as described in Section 3.2, we can confirm the existence of the Brenner– Lohse dynamic equilibrium.
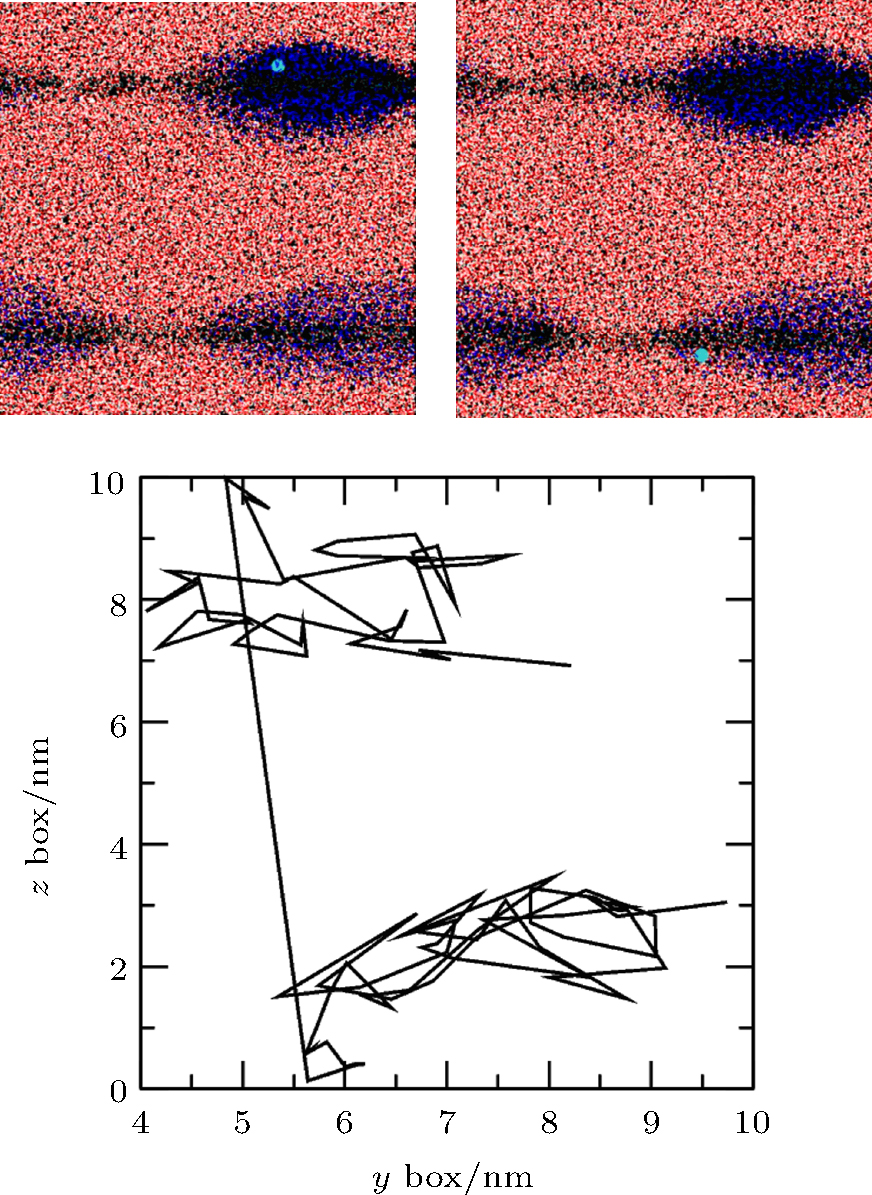 | Fig. 12. Positions and trajectory of the 5th N atom from 5.075 ns to 5.095 ns obtained by simulation of Case 5. Because of the periodic boundary condition, the top surface coincides with the bottom surface, and the line from top to bottom shows that the atom escapes from the top of the upper bubble and enters the lower bubble from the edge of the bottom surface. |
In order to assess the reproducibility and cumulative error of our simulations, simulation of Case 4 was performed repeatedly.
Firstly, we observed the results obtained by energy files such as volume, pressure, and density, as shown in Table 3. The results of two simulation runs were almost the same. Estimates of cumulative error and RMSD (root-mean-square deviation) in every item were within a reasonable range.
| Table 3. Comparison of the results of two simulations of Case 4. |
Secondly, we observed the results obtained by trajectory files, such as displacement of molecules and density distributions. Again, these were almost the same in two simulations of Case 4.
The results showed the reproducibility and cumulative error of the simulation to be acceptable.
(i) Water is a necessary condition for gas accumulation.
(ii) The process of gas adsorption and accumulation at a hydrophobic interface is as follows. Initially, a water depletion layer appears on the hydrophobic interface. Gas molecules then enter the depletion layer and form a high-density gas-enriched layer. Finally, the gas-enriched layer accumulates to form a nanobubble. The radian of the nanobubble increases with time until equilibrium is reached. At the same time, supersaturated gas in the bulk water accumulates unsteadily, since it can diffuse back into the water and is gradually adsorbed by the substrate.
(iii) The stability of a gas nanobubble is achieved by Brenner– Lohse dynamic equilibrium, and the inner gas pressure of nanobubbles is consistent with the ambient pressure (1 atm).
(iv) Gas molecules in a nanobubble can escape through the mixed layer and enter another nanobubble.
(v) The contact angle of a nanobubble obtained through simulation is about 15° .
The simulation results of gas adsorption and accumulation almost consist with the experiential results reported in the literature. The results of simulation are pursuant to the fact that only the equilibrium time of adsorption and accumulation cannot be unified. Experimental results range from several minutes[18] to several days.[42] Therefore, the equilibrium time of adsorption and accumulation needs to be further studied.
| 1 |
|
| 2 |
|
| 3 |
|
| 4 |
|
| 5 |
|
| 6 |
|
| 7 |
|
| 8 |
|
| 9 |
|
| 10 |
|
| 11 |
|
| 12 |
|
| 13 |
|
| 14 |
|
| 15 |
|
| 16 |
|
| 17 |
|
| 18 |
|
| 19 |
|
| 20 |
|
| 21 |
|
| 22 |
|
| 23 |
|
| 24 |
|
| 25 |
|
| 26 |
|
| 27 |
|
| 28 |
|
| 29 |
|
| 30 |
|
| 31 |
|
| 32 |
|
| 33 |
|
| 34 |
|
| 35 |
|
| 36 |
|
| 37 |
|
| 38 |
|
| 39 |
|
| 40 |
|
| 41 |
|
| 42 |
|