
Viscosities and their correlations with structures of Cu–Ag melts
[Zhao Yan†a), b)  , Hou Xiao-Xia
a) ]
, Hou Xiao-Xia|
|


†Corresponding author. E-mail: dzuzhy@126.com
*Project supported by the Science and Technology Development Program of Shandong Province, China (Grant No. 2011YD03099) and the Natural Science Foundation of Shandong Province, China (Grant No. ZR2014EL001).
The viscosities of a series of Cu–Ag melts in a temperature range from 1473 K to nearly liquid temperatures are measured by using an oscillating viscometer. At the same temperature, the value of viscosity increases first with silver content increasing, and reaches a maximum value at the eutectic component Cu40Ag60, then decreases. All the temperature dependences of the viscosities of Cu–Ag melts conform with the Arrhenius equation. The parameters of correlation length D of the studied Cu–Ag melts are calculated according to the experimental results of x-ray diffraction. The temperature dependence of correlation length D shows an exponential decay function, which is similar to the Arrhenius equation. Based on the values of viscosities and correlation length D, a direct correlation between viscosity and liquid structure is found for the investigated Cu–Ag melts through comparative analysis.
Viscosity, one of the main atomic transport properties, is considered to be most important not only from practical considerations, such as the applications in processing, chemical and metallurgical industries, but also from the theoretical point of view as a “ structure sensitive” property.[1, 2] As one of the most important properties of melts, the viscosities of molten metals and alloys are studied extensively by many experimental and calculational methods.[3] Because of experimental difficulties, systematic investigation of alloy viscosity at elevated temperatures is rather limited.[4] Many physical models expressed by different characteristic parameters based on quantum mechanics and statistic mechanics have been established.
Since the viscosity is seen as a “ structure sensitive” property, [1] there must be some correlations between viscosity and structural characteristics. Born and Green[5] proposed an expression of the viscosity of liquid as a function of the pair correlation function g(r) and the pair interatomic potential ϕ (r)

where m is the mass of the atom, k is the Boltzmann constant, and n0 is the average density. Based on Brownian motion, Zwanzig et al.[6] and Rice and Allnatt[7] proposed a similar equation
where ζ is the friction coefficient, and ψ 2 the boundary condition function for a finite differential equation. The Born– Green and Kirkwood– Rie models set up the correlations between viscosity and structure, and can obtain good results in some mono-atomic liquid metals, but some calculated results are not satisfied.[8] In addition, it is usually difficult to accurately estimate the pair interatomic potential ϕ (r). Its validity still needs to be investigated.
In the aspect of experimental study, Sun[9] found that the component with a more intense pre-peak (a peak on the left of the main peak of structure factor S(Q)) has the bigger viscosity value for Al– Cu melt. In our previous studies on In– Sn[10] and Cu– Sn[11] melts, viscosity and some structural parameters, such as the correlation radius rc, and the coordination number N1, have the same abnormal change range with temperature. All the studies can only reflect the viscosity changing qualitatively. To date, a direct correlation between liquid structure and viscosity quantitatively through an experimental method has not been set up.
In this study, the viscosities of Cu100− xAgx (x = 20, 40, 60, 80, at.%) melts are investigated by an oscillating viscometer for high temperature melts. By comparing with our previous structural investigations through an x-ray diffraction method, [12] the correlation between viscosity and liquid structure is investigated and discussed.
The samples for viscosity and x-ray diffraction measurements were prepared by melting from pure ingots of Cu, Ag (99.99% in purity) in a vacuum inductive furnace. The samples were cooled into ingots in the furnace, and then were processed into a sample of 25 mm× 18 mm× 8 mm for x-ray diffraction experiments, and a sample of 28 mm× 48 mm for viscosity measurements.
The viscosity measurements were performed by using an oscillating viscometer for high temperature melts. The corundum crucible was used. The detailed process of measurement can be seen elsewhere.[13, 14] The kinematic viscosity obtained by the logarithmic damping decrement of a melt can be calculated by the following Schvidkovskii equation:[15]


where Δ = δ /2π , a, b, c are constants, m is the mass of the liquid sample, I is the momentum of inertia of the suspended system, R is the radius of the vessel, H is the height of the liquid sample in the vessel, δ is the logarithmic damping decrement, and T is the period time of the oscillations, while the subscript 0 refers to an empty vessel, n the number of solid planes contacted horizontally by the liquid sample (i.e., in the case of a vessel having its lower end closed and its upper surface free, n = 1, if the vessel encloses the fluid top and bottom, n = 2). The dynamic viscosity η can be calculated from the following formula:

where ρ is the density of the sample.
X-ray diffraction measurements were carried out using a high temperature θ – θ type diffractometer. The detailed process of measurement can be seen in Ref. [12]. The scattering intensity measured in arbitrary units was converted into the coherent scattering intensity per atom in an electron unit 

where f is the scattering factor, ρ (r) is the radial density function, and ρ 0 is the average density. Then the Ashcroft– Langreth structure factor S(Q) can be obtained from the scattering intensity as the following function:[19, 20]

where cj is the mole fraction, and fj(Q) is the total atomic scattering factor of the j-th component in the alloy. The detailed processing and error analysis of the x-ray diffractometer used in this work are described somewhere else.[21, 22]
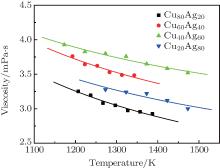
Figure 1 shows the temperature dependences of the viscosity of equilibrium liquids for the Cu– Ag alloys. It can be seen that at the same temperature the viscosity increases with increasing Ag content till the eutectic component Cu40Ag60 and then decreases in the Cu– Ag melts. The data as a function of temperature can be expressed by Arrhenius equation:
where η 0 is a constant depending on the nature of the liquid, Ea, V is the activation energy for viscous flow, R the gas constant, and T the temperature. By fitting the discrete data in Fig. 1, the values of η 0 and Ea, V/R of the four Cu– Ag melts can be obtained. The eutectic Cu40Ag60 alloy has a maximal value of η 0 (2.340) and the minimum value of Ea, V/R (609.952). The detailed results are shown in Table 1.
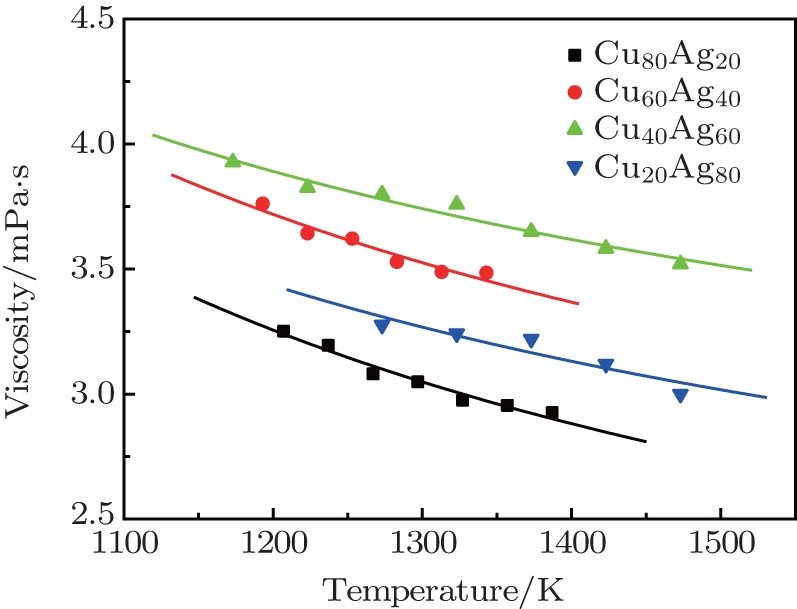 | Fig. 1. Temperature dependences of viscosities of Cu– Ag melts (the lines are fitted by Arrhenius equation). |
| Table 1. Parameters η 0 and Ea, V/R of the Cu– Ag melts fitted by Arrhenius equation. |
Many efforts have been made to study the correlation between viscosity and liquid structure. Based on the Born and Green formula (Eq. (1)), Morioka[23] put forward a dense gaslike model of viscosity for liquid metals. Mi et al.[24] studied the correlation between viscosity and liquid structure of aluminum by the molecular dynamics simulation. Mi et al. studied the kinematic viscosity of magnesium[2] and Mg– 9Al[24] melts and their relationship with the microstructure. However, as mentioned above, the direct quantitative correlation between liquid structure and viscosity in a wide range of temperature is not found experimentally due to the complexity of liquid structure and the instability of viscosity measurement, especially for the alloy melts.
To find a direct correlation between viscosity and structure, the structural parameters such as the mean nearest neighbor distance r1, the correlation radius rc, the atom numbers Nc, etc. are all investigated thoroughly. They all show a “ saltation pattern” , i.e., the parameters keep stable in a temperature range and an abrupt change arises at the critical temperature, which is different from the continuous temperature dependence of viscosity. Therefore, other parameters should be introduced. In the study of solids, the half-height-width of the Bragg peak of x-ray diffraction can be used to estimate the microcrystalline size. For the amorphous material, usually the correlation length D (or named the size of structural unit) is used to estimate the size of ordered domain, it can be calculated from the following equation:[25, 26]

where Δ Q is the half-height-width of the first peak of S(Q).
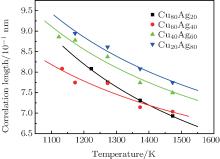
Figure 2 shows the temperature dependences of the correlation length D of the studied Cu– Ag melts. It can be seen that the discrete data follow an exponential function changing with temperature. The solid lines in Fig. 2 are fitted by the Arrhenius equation
where D0 is a constant, and Ea, D the activation energy for structural evolution. By fitting the discrete data in Fig. 2, D0 and Ea, D/R of the four Cu– Ag melts can be obtained. The detailed results are shown in Table 2.
 | Fig. 2. Temperature dependences of correlation length of Cu– Ag melts (the lines are fitted by the Arrhenius equation). |
| Table 2. Parameters D0 and Ea, D/R of the Cu– Ag melts fitted by the Arrhenius equation. |
The viscosity η and correlation length D both show Arrhenius-type temperature dependence, i.e., an exponential variation with temperature. This provides a chance to investigate the direct correlation between liquid structure and viscosity quantitatively. At the first, a linear scaling adjustment between η and D is employed as[27]

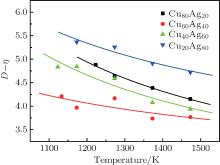
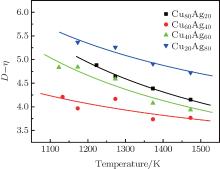
where a, b, and c are constants. This relation is similar to the linear function between the size of average atomic cluster dS and kinematic viscosity ν of magnesium and Mg– 9Al melts in Refs. [2] and [24]. Although this simple equation can reflect a good correlation between η and D, the fitted constants (a, b, c) are stochastic without any physical interpretation. To set up the direct correlation between liquid structure and viscosity, a correlation factor k (in 10− 1 mPa· s· nm− 1) is introduced, which can make the units of η and D unified. The data of kD– η are investigated. Encouragingly, kD– η also shows an exponential function varying with temperature when the value of k is 1, which is shown in Fig. 3. The solid lines in Fig. 3 are fitted by the Arrhenius type equation
where k = 1, α and β are constants. The fitted results of α and β /R for the four Cu– Ag melts are shown in Table 3.
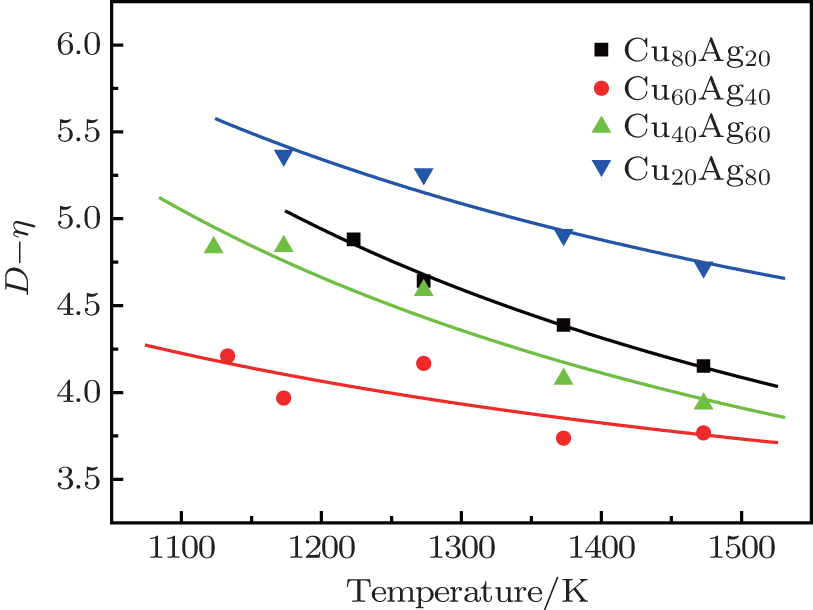 | Fig. 3. Temperature dependences of kD– η (k = 1) of Cu– Ag melts (the lines are fitted by the Arrhenius type equation). |
| Table 3. Parameters α and β /R of the Cu– Ag melts fitted by the Arrhenius type equation. |
To make parameters α and β have certain physical significances rather than the fitted values, the data in Tables 1– 3 are compared carefully. Parameters α and β can be expressed as

then parameter α has the same unit (mPa· s) as η 0 and parameter β has the same unit (J· mol− 1) as Ea, D or Ea, V. The calculated parameters kD0– η 0 (k = 1), 


Table 4. Calculated parameters kD0– η 0 (k = 1),  |
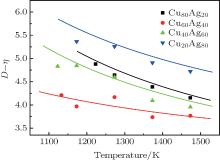
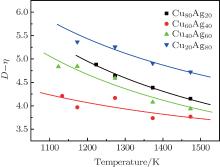
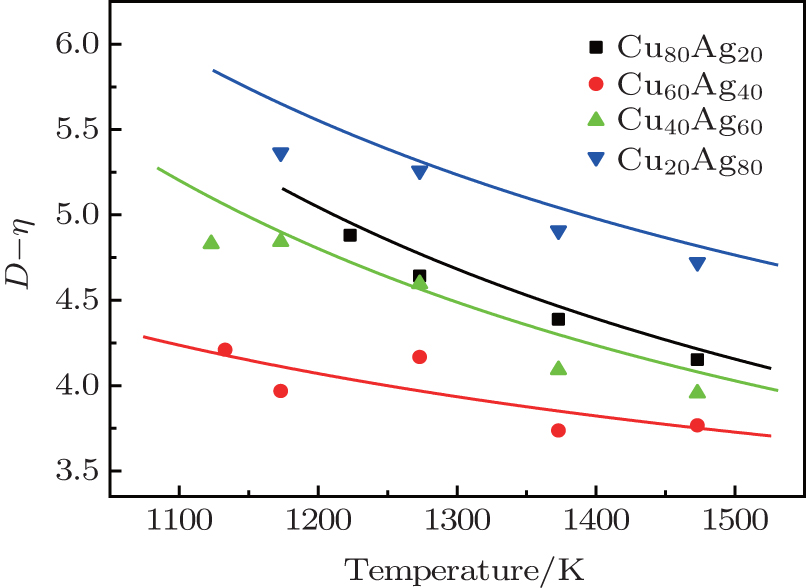 | Fig. 4. Temperature dependences of kD– η (k = 1) of Cu– Ag melts (the lines are calculated from Eq. (13) with α = kD0– η 0,  |
If kD– η (k = 1) curves are calculated from Eq. (13) with fixing α = kD0– η 0 (k = 1), fitting β /R or fixing β /R = 
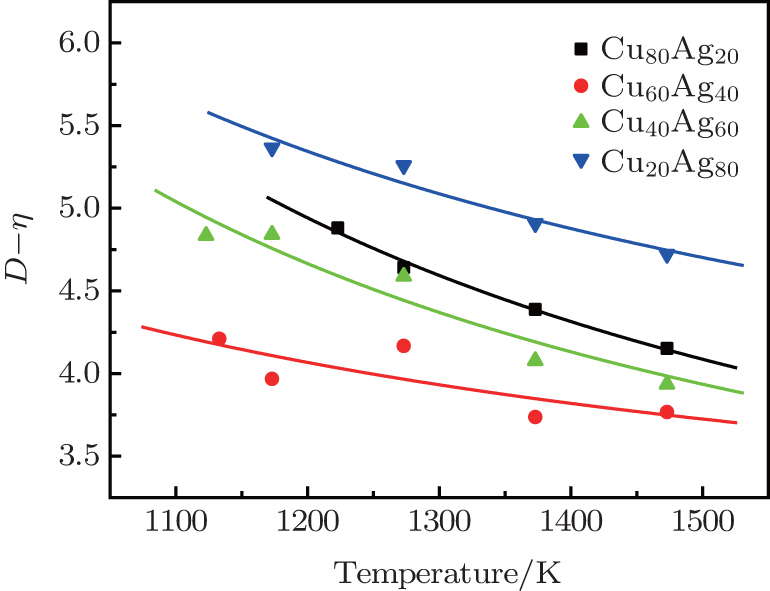 | Fig. 5. Temperature dependences of kD– η (k = 1) of Cu– Ag melts (the lines are fitted by Eq. (13) with α = kD0– η 0). |
 | Fig. 6. Temperature dependences of kD– η (k = 1) of Cu– Ag melts (the lines are fitted by Eq. (13) with  |
Table 5. Fitted β /R with fixing α = kD0– η 0 (k = 1), fitting α with fixing  |
The viscosities of Cu– Ag melts are investigated by an oscillating viscometer. Combined with the structural results obtained by the x-ray diffraction method, the correlation between viscosity and liquid structure is investigated. The results of this work will enhance the understanding of the correlations between dynamic properties and liquid structure of alloy melts. Some conclusions from the present study are summarized as follows.
(i) Temperature dependences of the viscosities of Cu– Ag melts conform with the Arrhenius equation. The eutectic component Cu40Ag60 alloy has the biggest viscosity in all the investigated Cu– Ag melts, and has a maximal value of η 0 (2.340) and a minimum value of Ea, V/R (609.952).
(ii) Each of the temperature dependences of the correlation length D of the studied Cu– Ag melts shows an exponential decay function, which is similar to the Arrhenius equation.
(iii) Based on analyses of the experimental data of viscosity and correlation length D, a direct correlation between them is found. It can be expressed as η = kD– α exp(β /RT) with k = 1, α = kD0– η 0, and 
| 1 |
|
| 2 |
|
| 3 |
|
| 4 |
|
| 5 |
|
| 6 |
|
| 7 |
|
| 8 |
|
| 9 |
|
| 10 |
|
| 11 |
|
| 12 |
|
| 13 |
|
| 14 |
|
| 15 |
|
| 16 |
|
| 17 |
|
| 18 |
|
| 19 |
|
| 20 |
|
| 21 |
|
| 22 |
|
| 23 |
|
| 24 |
|
| 25 |
|
| 26 |
|
| 27 |
|