

ReaxFF molecular dynamics study on oxidation behavior of 3C-SiC: Polar face effects
[Sun Yu†a)  , Liu Yi-Jun
a), b) , Xu Feia) ]
, Liu Yi-Jun|
|


†Corresponding author. E-mail: npuyusun@gmail.com
*Project supported by the 111 Project (Grant No. B07050) and the National Natural Science Foundation of China (Grant No. 11402206).
The oxidation of nanoscale 3C-SiC involving four polar faces (
To improve the performance of space vehicles for extremely harsh service environment, it is crucial to develop the materials and structures for their thermal protection systems. Due to the advanced features, composite materials based on carbon, silicon carbide (SiC), silica (SiO2), and carbon fibers become the latest choice for the thermal protection system.[1– 3] However, because of the high-temperature and high-pressure working condition, oxidation occurs which can lead to system degradation.[4– 7] Therefore, the understanding of related behaviors involving chemical reaction and microstructure evolution turns out to be a critical issue.
Plenty of experimental efforts have been devoted to explore the oxidation process of these silicon carbide materials, while limitation exists for reaching temperature higher than 2000 K as well as understanding the break and formation of molecular bonding during chemical reaction.[8– 17] Besides, recent studies on compressive properties of SiC composite materials also found temperature-dependent phenomena and attributed them to the oxidation of SiC. Therefore, it is difficult to provide a clear explanation due to the limitation of observation condition.[18] Modeling approaches have their advantages and can play important roles in the study. Previously, calculations based on density functional theory (DFT) were utilized to investigate the oxygen adsorption behavior for different SiC polytypes.[19– 21] Although stable configurations and reaction pathway have been achieved, computational cost was too high to contain sufficient numbers of atoms.[22– 24] Classical molecular dynamics simulation on oxygen diffusion in SiC was also performed without providing information on chemical reaction details.[25] Basically, the oxidation process includes chemical reactions, mass transport, and electrostatic interactions, all of which have its own complexity.[26, 27] To be able to model the profile at a lower calculation cost, a sophisticated bond-order potential, ReaxFF method, was established by the group of Duin.[28] The parameters have been extended for Si/C/H/O system by Newsome et al. They studied the oxidation process of 2H-SiC(0001) by O2 and H2O in a temperature range of 500– 5000 K.[29] Furthermore, by developing the Deal– Grove (D– G) theory, results from MD simulation have been fitted to compute the transport diffusivity at various temperatures and further to obtain the activation barriers.[30] They focused on 2H-SiC(0001) face without providing information on the cubic SiC phase (3C-SiC), which is technologically important related to crystal growth.[9, 13, 19, 31] Besides, the anisotropic oxidation nature of SiC has not been taken into account by MD simulations according to the best knowledge of the authors.
In the present work, we concentrate on the polar face effects, to first investigate the oxidation behavior of 

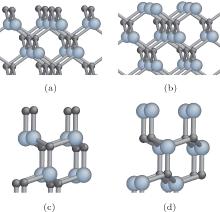
The crystal structures of 3C-SiC polar faces including
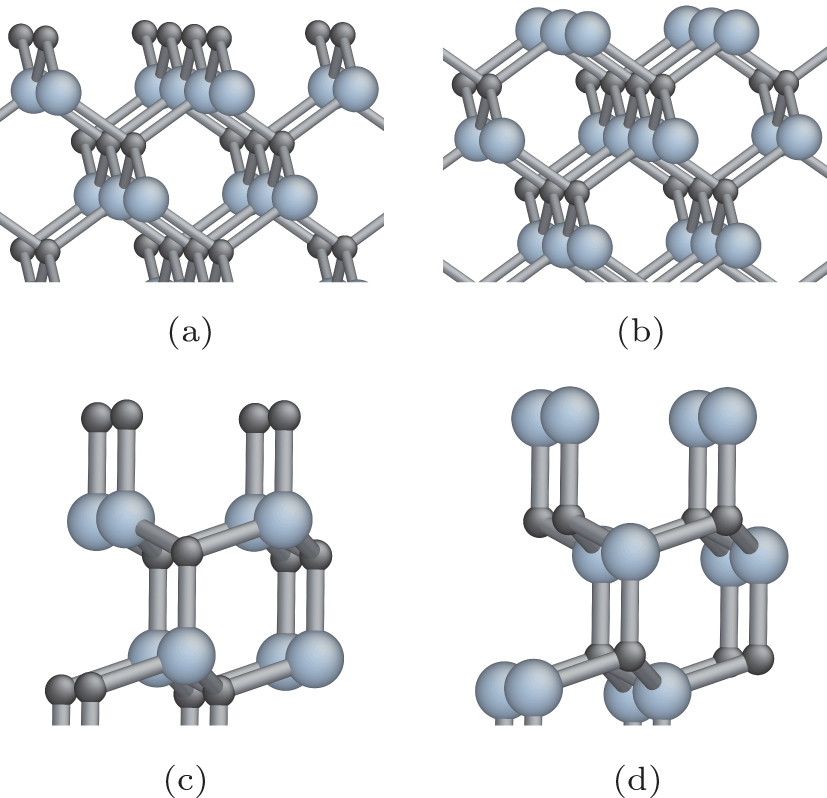 | Fig. 1. Side view of 3C-SiC polar face. In this and all the following figures showing atomistic structures, black, and gray spheres indicate carbon and silicon atoms, respectively. (a) |
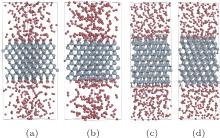
 | Fig. 2. Initial configurations for MD. In this and all the following figures showing atomistic structures, red, and white spheres indicate oxygen and hydrogen atoms, respectively. (a) |
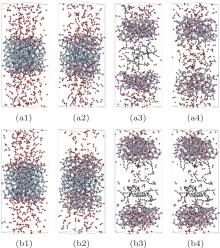
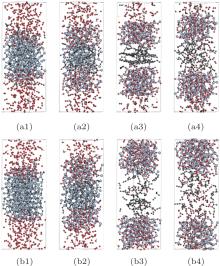
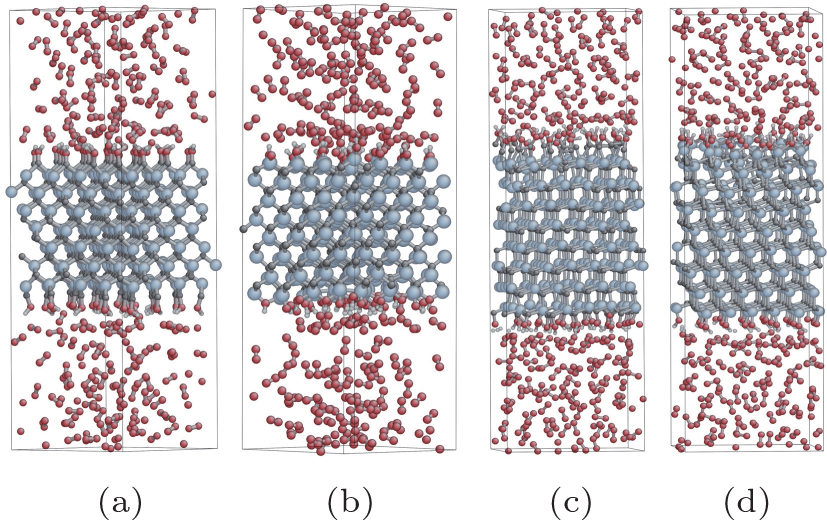
The configurations with [100] and [111] directions for C- and Si-terminated face oxidized under 1000 K, 2000 K, 3000 K, and 5000 K are presented in Figs.3 and 4, respectively. All of them are observed by ReaxFF MD at 80 ps. It is noticeable that all the four polar faces turn to react very fast with oxygen when the temperature is higher. Above 2000 K, there is a mixture of carbon chain and SiOx in the middle part of simulation cell, and almost all the oxygen molecules have been consumed according to Figs. 3 and 4. Since the melting point of SiO2 is nearly 1800 K given by Castro-Marcano et al., [29, 34] the separated slab is forming a liquid, amorphous silica phase as temperature increases above 2000 K. While comparing with the structures of 2H-SiC oxidation given by Newsome et al., [29] the consistency seems to be broken at earlier stage for 3C-SiC. These results imply that the oxidation degree of 3C-SiC could be greater than that of 2H-SiC. However, by simply comparing the ReaxFF MD configurations of
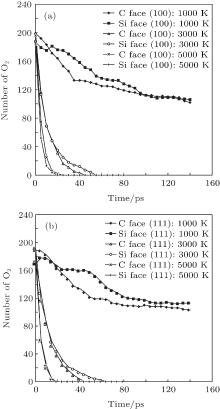
To further understand the structure evolution, the numbers of O2 molecules changing with time at various temperatures have also been tracked during the simulation. The O– O bond consumptions for (100) and (111) surfaces oxidized at 1000 K, 3000 K, and 5000 K are illustrated as Fig. 5. The consumption rates of oxygen increase greatly as temperature increasesfor all cases. C-face consumes O– O bond faster than that of Si-face, with a more evident difference at 1000 K, while less obvious under higher temperature. It may be attributed to the activity enhancement of subsurface as temperature increases, so that the effect of terminated element as C or Si on surface is weakened. By means of oxygen concentration data at 800, 1000, 1400, 2000, 3000, 4000, and 5000 K obtained from MD simulation, analysis on transport rate and energy barriers is conducted in subsection 3.2.
 | Fig. 3. Configurations of (100) face oxidation at 80 ps. |
 | Fig. 4. Configurations of (111) face oxidation at 80 ps. |
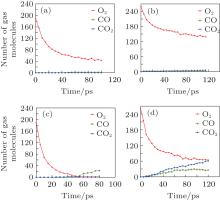
Moreover, to investigate the effect of initial oxygen concentration, 300 O2 molecules were inserted and relative simulations at 2000 K and 3000 K have been performed for the model with Si(100) face. The configurations after oxidizing for 80 ps are presented in Fig. 6. It has been shown that there are CO2 molecules formed in the middle part of the slab at 3000 K, where SiC was separating and producing graphitized layer. The analysis of gas concentration changing with time at 2000 K and 3000 K is illustrated in Fig. 7, including O2, CO, and CO2. Obviously, CO2 molecules have been generated when both the initial concentration of O2 and system temperature are high. It seems that excess O2 molecules have passed through the liquid, amorphous silica phase and totally reacted with carbon layers under 3000 K to form CO2. These results could be instructive to realistic situation under high temperature and high pressure to some extent.
 | Fig. 5. Consumption of O2 with time during the oxidation at 1000 K, 3000 K, and 5000 K. (a) (100) face. (b) (111) face. |
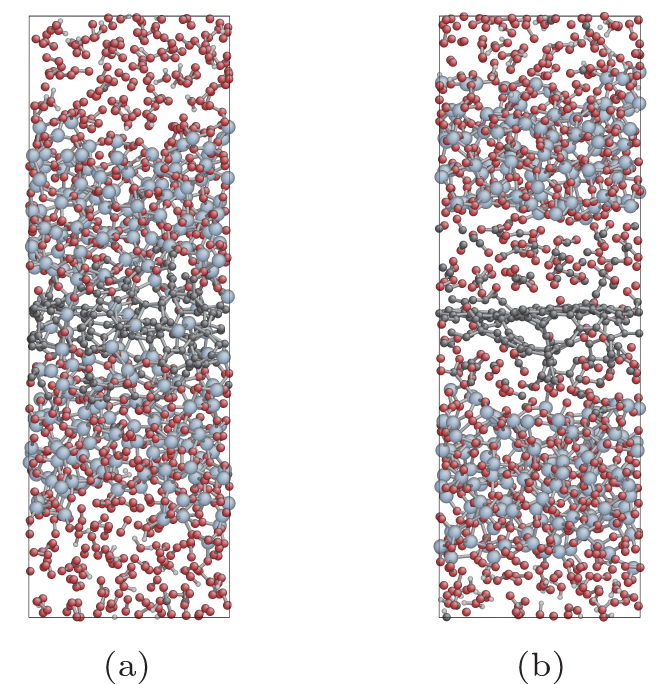 | Fig. 6. Configurations of SiC oxidation at 2000 K (a) and 3000 K (b) for 80 ps. Systems contain 300 O2 molecules initially. |
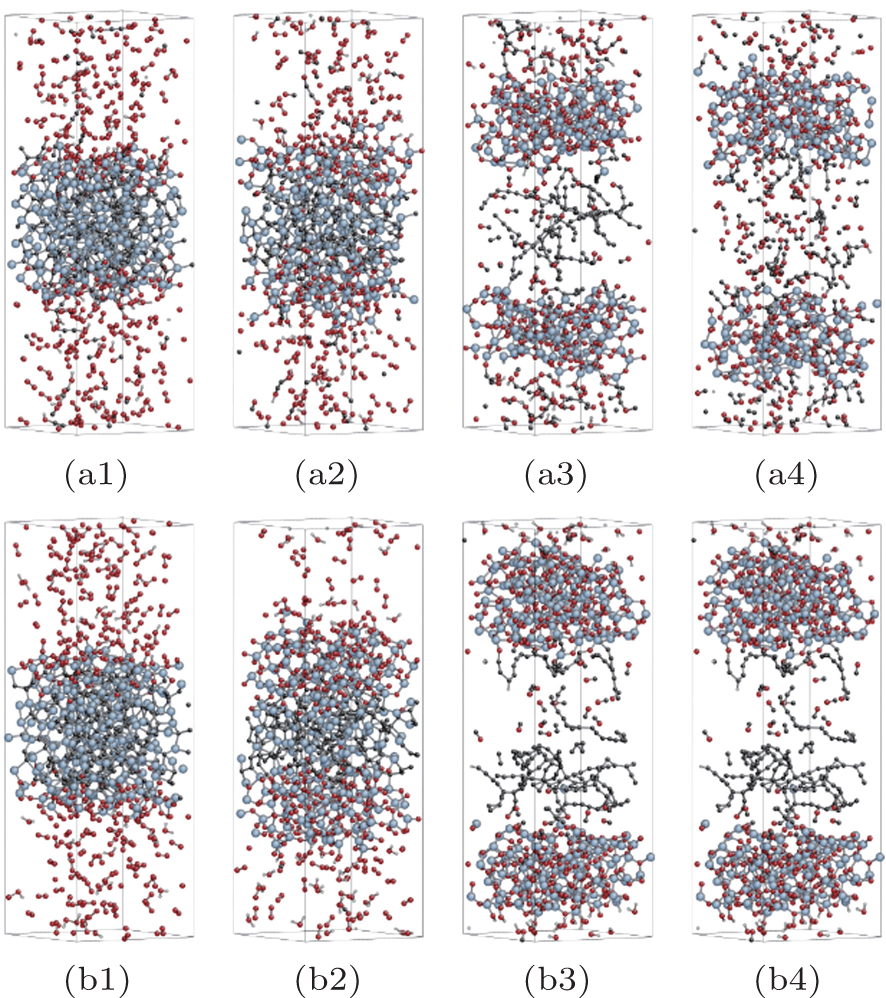
 | Fig. 7. Comparison of systems with different initial O2 concentrations at 2000 K and 3000 K. (a) 2000 K, contained 200 O2 molecules initially. (b) 2000 K, contained 300 O2 molecules initially. (c) 3000 K, contained 200 O2 molecules initially. (d) 3000 K, contained 300 O2 molecules initially. |
The transport rate theory to model gas and solid reaction was developed by Newsome et al. It provides a way to quantify the rate parameters, which is difficult to conduct via experiments. The relation between oxygen concentration and reaction time is given by[30]
where 


By fitting the MD data shown in Fig. 5 with the concentration-time relationship as Eq. (1), the values of α and β for each temperature are obtained. Then, using Eq. (2) or Eq. (3), two values of Dt could be calculated from α or β . By weighted averaging, these two Dt values to maximize the correlation coefficient of theory and simulation results, final determination of Dt is made. After all the Dt at various temperatures as 800, 1000, 1400, 2000, 3000, 4000, 5000 K for (100) and (111) face are obtained, activation energies and pre-exponential factors are calculated by Arrhenius equation as follows:

Take the logarithm to make a linear form as

where Ea and D0 are the activation energy and pre-exponential factor respectively, and R is the gas constant taken as 8.3145 J· K− 1· mol− 1.
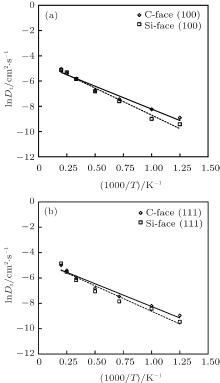
The fitting of lnDt with 1000/T as Eq. (5) for (100) and (111) face are shown in Fig. 8. The correlation coefficients of all cases are larger than 0.95. By these fittings, Ea and D0 are calculated for each situation, as displayed in Table 1. The activation barriers of C-face oxidation are lower than that of Si-face for both (100) and (111) crystal planes, which indicates the oxidation facility of C-terminated polar face. Previous results have shown that the oxide growth rate of Si-face was about 1/10th that of C-face, and both rates were much higher than the evaluation given by D– G model at oxidation thickness less than 20 nm. However, almost all the studies only focused on the oxidation properties under temperature lower than 2000 K for hexagonal structures.[14, 35, 36] Here, the small difference between C-face and Si-face presented in Table 1 may result from the influence of the data point at higher temperature. As temperature increases, the polar face effects seem to be reduced. Moreover, at the initial stage involving extremely thin oxide layer, the oxidation rate is high and correspondingly leads to smaller activation barriers. Apart from the difference between C- and Si-face, comparison between (100) and (111) plane reveals slight energy-favorable of (111) plane, while it is not noticeable.
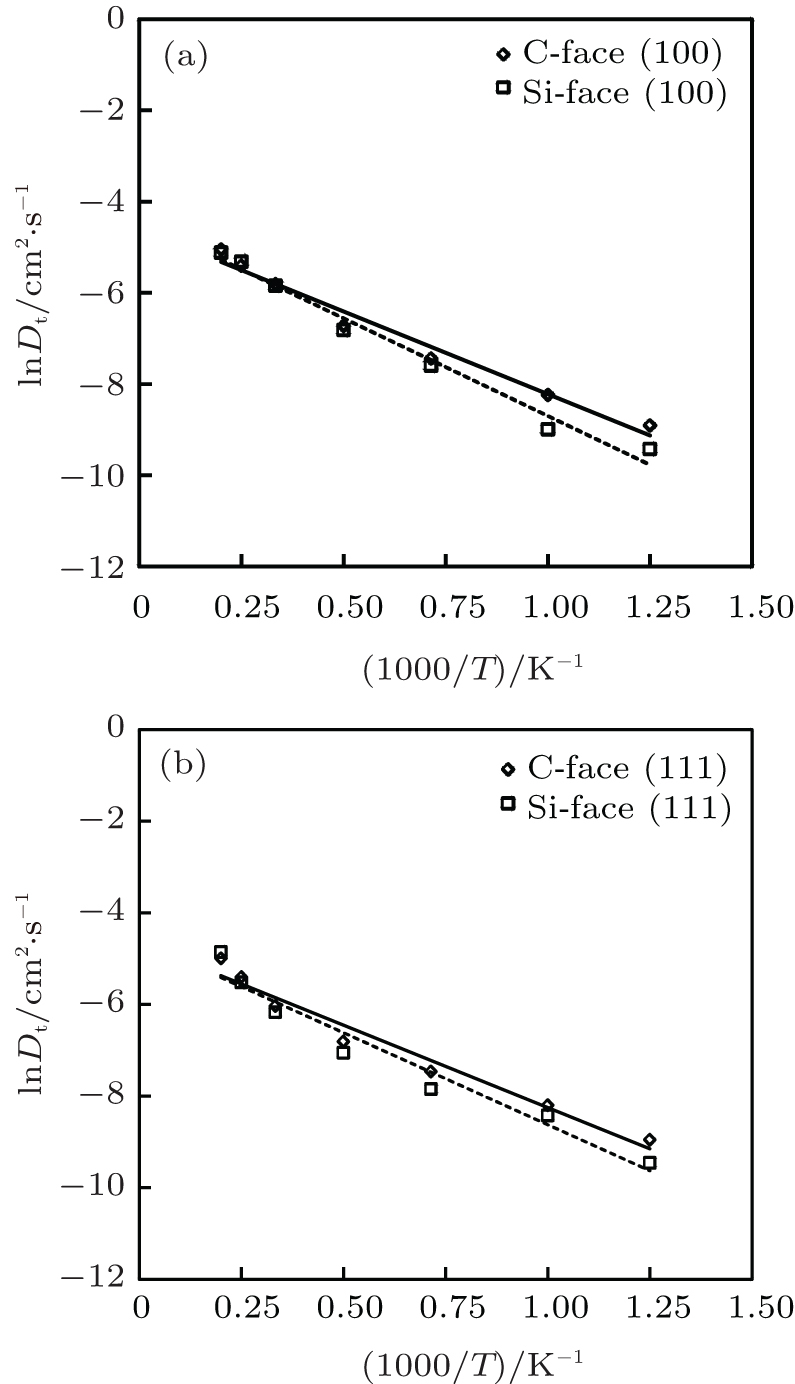 | Fig. 8. Fitting of Arrhenius equation for oxidation of 3C-SiC (a) (100) face and (b) (111) face. |
| Table 1. Activation energy and pre-exponential factor for SiC oxidation with different polar faces. |
All the Ea values are less than that of 2H-SiC (see Ref. [30]: 46.3 kJ· mol− 1), revealing higher oxidation rate of 3C-SiC. D0 is similar for each case, nearly 10− 2 cm2· s− 1. It has reported that the oxidation rates of SiC were dependent on crystal polytypes.[9] An experimental oxidation test on β -SiC and the comparison with α -SiC done by the same group revealed that the activation energy for β -SiC were much lower than α -SiC.[37, 38] These seem to be in qualitative agreement with our calculations which show that the value of activation energy of 3C-SiC oxidation is less than that of 2H-SiC. However, since the oxygen concentration is much higher in the present simulation than in experiments, all the values of activation energy obtained here are obviously lower. Additionally, research on the formation of porous SiC ceramics manifested that the cubic phase with oxide was unstable and further converted to hexagonal form.[39] These could also indicate the weaker oxidative stability of 3C-SiC in agreement with our simulation results.
To find the root of polytype effect on oxidation behavior, it is necessary to analyze the differences of their crystal structures. Among SiC polymorphs, 3C-SiC is the only cubic one with stacking sequence as · · · ABCABC· · · along its [111] direction. This layer stacking direction is defined as the c axis along [0001] direction for hexagonal structures, along which 2H-SiC has · · · ABAB· · · sequence. Following the notation rule by Jagodzinski, [40] the letter h is used to describe the stacking position with a 180° rotation, whereas the letter k refers to the stacking without rotation. As shown in Fig. 9, 3C-SiC and 2H-SiC are two typical structures with only k or h stacking sequence. This means that 3C-SiC has only cubic structure component, while 2H-SiC has only hexagonal one. The oxidation behavior of these polytypes may be influenced by the amount of k or h component which causes differences in bonding strength and further induces different adsorption barriers of oxygen. As the results given by density functional theory (DFT) calculation, [20] the adsorption energy of oxygen to Si-terminated surface of 3C-SiC is approximately 0.2 eV less than that of 2H-SiC. The surface configurations are also different depending on the surface sequence. 3C-SiC has larger relaxed bond angle than that of 2H, which means that cubic structure may experience inward relaxation and can be more flexible than 2H while 2H has a closer structure to sp3. This sp3 character gives rise to a stronger bonding between adsorbed oxygen and Si atoms on surface for 2H and makes it more difficult for Si– O bond formation. Such kind of state can facilitate the initial oxygen adsorption to Si-terminated surface of 3C-SiC and further increase the oxidation rate of 3C bulk. As to C-terminated SiC surfaces, all the adsorption energy values are much lower than that of Si-terminated surfaces for both 3C and 2H, which indicates that the polytype effect may diminish whereas the influence of top layer can become the dominating factor.
Apart from the analysis above, the configurations containing only two neighboring bonding tetrahedrons for 3C and 2H stacking are shown in the bottom half of Fig. 9. The adjacent layer of 3C is twisted by 60° with respect to the atom position of 2H. Due to such twisting, the distance between Si atom and C atom belong to the neighboring stacking (shown by the arrow) for 3C is slightly larger than that of 2H. Thus, 3C-SiC may provide a wider space for oxygen, correspondingly holding more oxygen molecules and enhancing the reaction. This can partially lead to the higher oxidation rate of 3C than that of 2H-SiC.
 | Fig. 9. Comparison between the micro-structures of 3C- and 2H-SiC. |
The anisotropy property of SiC oxidation is of great importance for both theoretical and technical development, which was seldom studied at a high temperature range of above 2000 K. With the aid of ReaxFF MD, the structure evolution and oxygen consumption at initial oxidation stage for
We thank Prof. Satoshi Izumi of the University of Tokyo for valuable suggestions.
| 1 |
|
| 2 |
|
| 3 |
|
| 4 |
|
| 5 |
|
| 6 |
|
| 7 |
|
| 8 |
|
| 9 |
|
| 10 |
|
| 11 |
|
| 12 |
|
| 13 |
|
| 14 |
|
| 15 |
|
| 16 |
|
| 17 |
|
| 18 |
|
| 19 |
|
| 20 |
|
| 21 |
|
| 22 |
|
| 23 |
|
| 24 |
|
| 25 |
|
| 26 |
|
| 27 |
|
| 28 |
|
| 29 |
|
| 30 |
|
| 31 |
|
| 32 |
|
| 33 |
|
| 34 |
|
| 35 |
|
| 36 |
|
| 37 |
|
| 38 |
|
| 39 |
|
| 40 |
|