


Atomistic simulation of topaz: Structure, defect, and vibrational properties
[Niu Ji-Nan†a), b)  , Shen Shai-Shai
b) , Liu Zhang-Shengb) , Feng Pei-Zhongb) , Ou Xue-Meib) , Qiang Ying-Huaib) , Zhu Zhen-Caia) ]
, Shen Shai-Shai
 , Shen Shai-Shai
†Corresponding author. E-mail: jinan.niu@cumt.edu.cn
*Project supported by the Natural Science Foundation of Jiangsu Province, China (Grant Nos. BK20140212) and the Fundamental Research Funds for the Central Universities China (Grant Nos. 2012QNA08).
The clay force field (CLAYFF) was supplemented by fluorine potential parameters deriving from experimental structures and used to model various topazes. The calculated cell parameters agree well with the observed structures. The quasi-linear correlation of the b lattice parameter to different F/OH ratios calculated by changing fluorine contents in OH-topaz supports that the F content can be measured by an optical method. Hydrogen bond calculations reveal that the hydrogen bond interaction to H1 is stronger than that to H2, and the more fluorine in the structure, the stronger the hydrogen bond interaction of hydroxyl hydrogen. Defect calculations provide the formation energies of all common defects and can be used to judge the ease of formation of them. The calculated vibrational frequencies are fairly consistent with available experimental results, and the 1080-cm−1 frequency often occurring in natural OH-topaz samples can be attributed to Si–F stretching because of the F substitution to OH and the Al–Si exchange.
Topaz is a fluoroaluminosilicate mineral with fairly constant composition of Al2(SiO4)(OH, F)2. The only major difference between samples is the F/OH ratio. The structure consists of silicon– oxygen tetrahedron linking aluminum– oxygen/fluorine octahedron, four of the six anions surrounding Al ion belong to silicon– oxygen tetrahedron, and the remaining two are either fluorine or hydroxyl oxygen. The structure is orthorhombic with space group Pbnm.[1, 2] Topaz has important applications in radiation dosimetry, [3] and its optical properties may be modified by ion radiation.[4– 6]
Computer modeling methods have been increasingly used in the past decade to simulate a wide range of materials and to evaluate their microscopic structures, physical, and thermodynamic properties. Some force fields have been developed successfully for aluminosilicates and related minerals, such as Teppen’ s covalent force field, [7] Bougeard’ s Zeolite-based force field, [8] Sainz-Diaz’ s force field[9] and Cygan’ s CLAYFF.[10] CLAYFF differs from most others in which most interatomic potentials are treated as nonbonded, i.e., no bond interaction between metal cations and anions; this allows us to effectively use the force field for relatively large and highly disordered systems while keeping the number of parameters small. CLAYFF has been successfully used to reproduce boehmite, portlandite, kaolinite, pyrophyllite, montmorillonite and the vibrational spectra of more complicated hydrotalcite which agreed with experimental results well; [10– 16] so CLAYFF has an obvious advantage especially in complicated simulations for aluminosilicates in contrast to other fields.[10]
Earlier, the perfect lattice and defect properties of two end members of topazes: Al2(SiO4)F2(F-topaz) and Al2(SiO4)(OH)2 (OH-topaz) were investigated by Jackson et al., [2, 5, 17] using a force field transferred from their previous zeolite simulation. In their potentials, the normal charges were adopted which introduced a stronger stabilizing influence to the structure, thus the Coulomb interaction would be overestimated.[10] It may lead to that their calculations for some defects did not converge which caused the corresponding complex defect formation energies. In this paper, CLAYFF using the partial charges which are environment-dependent and can simulate the target structures more accurately[10] was supplemented by F potential, and then first applied to study the lattice properties of topaz with a series of F/OH ratios; in addition, the properties of basic and complex defects of F- and OH-topaz were investigated to find the lowest energy process; at the same time, vibrational frequencies were also calculated and compared with available experimental results, then a new point for the absence of 1080-cm− 1 frequency was put forward.
The total energy has contributions from the Coulomb interactions, the van der waals interactions, and the bonded hydroxyl interactions. The bonded terms include the bond stretch term and the angle bend energy term which is helpful in describing hydroxyl bend behavior of metal-hydroxyl. The van der waals (VDW) energy term is represented by Lennard– Jones 12– 6 (LJ12– 6) function
where the “ arithmetic mean” combining rule is used for the distance parameters Ro, ij and the “ geometric mean” combining rule for the energy parameters Do, ij. Combination rules allow Lennard– Jones parameters for single atom species to be combined in one of several ways to avoid the explicit definition for every possible atom– atom interaction in a simulation

where Ro, i, Ro, j and Do, i, Do, j are the distance parameters and the energy parameters, respectively, which can be derived from the fitting of the observed structures.
The bond stretch term uses a harmonic function to describe hydroxyl group stretch energy

where k1 is a force constant and ro represents the equilibrium bond length, while rij is the distance between atoms i and j. There are no Coulomb interactions between atoms coupled by a bond stretch term, as it is assumed that this potential describes all components of the interactions between both atoms.
An angle bend term is included to improve the vibrational behavior of surface hydroxyl groups

where k2 is a force constant and θ o represents the equilibrium bend angle, while θ ijk is the bend angle for metal– oxygen– hydrogen. This bend term is considered as an optional feature of CLAYFF and does not affect the total energy obviously, but it is computationally expensive to apply, [10] however, in the present paper, we still included it in modeling for more accuracy. Moreover, in order to describe the relationship of two splitting H sites in the OH-topaz well, a three-body function with the above harmonic form was also used, then θ ijk presents the angle for hydroxyl hydrogen (site 1, H1)-hydroxyl oxygen-hydroxyl hydrogen (site 2, H2). All the potentials parameters are given in Table 1.
| Table 1. Potentials parameters. |
No parameters about F ions are included in the initial CLAYFF, so LJ12– 6 parameters for F ions were derived from the fitting of the observed structures. Aluminium trifluoride structure [18] was first used to fit for the initial F ions parameters, then F-topaz structure[1] was supplemented to a further fitting, finally a relax fitting[19] was needed to avoid the worse structure. When fitting the angle potential for H1-hydroxyl oxygen-H2 in OH-topaz, simple point charge (SPC) water model[20] was used as initial parameters, then a conventional fitting and next a relax was processed. In order to keep the electrostatic equilibrium of the unit cell and just modify the initial force field slightly, the charge of F ions was assigned to be equal to hydroxyl, − 0.525e, where e is the charge of an electron. All fitting calculations were performed by means of the general utility lattice program (GULP), [19] and the Newton– Raphson method with Broyden– Fletcher– Goldfarb– Shanno (BFGS) updating of Hessian was used.[21]
The cell parameters and atom coordinates for F- and OH-topaz [1] were used as the initial structures in the calculations. In OH-topaz, every hydroxyl hydrogen has two possible sites, H1 and H2, as shown in Fig. 1. Each H site is one-half occupied and the diagonal configuration of H atoms provides a geometrically reasonable model.[22] Here, a mean field (or virtual crystal) approximation[9] was adopted to describe this configuration and the space group of pbnm was still adopted.[22] In order to model nature topazes with different F percentages, an attempt of the substitution of F for OH in OH-topaz was carried out, and the results would be used to compare with the experimental results.
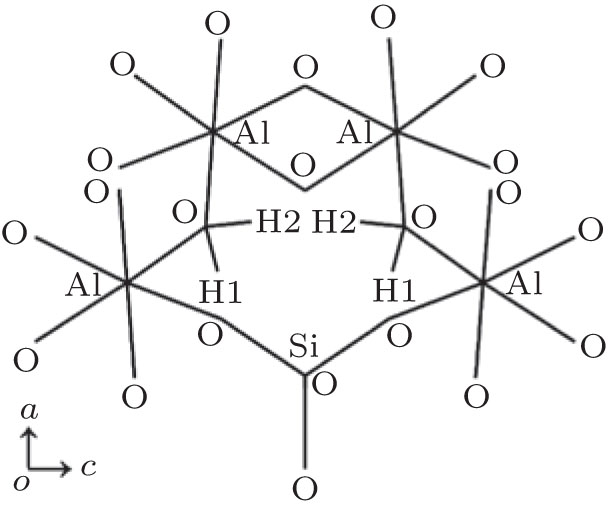 | Fig. 1. Schematic diagram of H sites in OH-topaz viewed along the b axis. |
Before each calculation, the structure optimization was firstly performed by means of the Newton– Raphson minimization method with BFGS updating of Hessian, [21] the accuracy factor for lattice sums was default to 8.0 and the max gradient tolerance was 0.001. The Coulomb energy summation used the standard Ewald method, the short VDW energy used a cutoff radius of 8.5 Å . For preserving a continuous transition of potential surface, a polynomial was used to taper potentials to zero between 8.0 and 8.5 Å .
The defect energy calculations were performed by the Mott– Littleton method, [23] which divides the crystal into inner and outer regions, with the former being modeled by an explicit atomistic approach and the latter by quasi-continuum methods.[24, 25] The calculations employed an inner region size of 6 Å and an outer region size of 12 Å . When performing defect calculations, the Newton– Raphson optimizer with the BFGS hessian update and the maximum gradient tolerance of 0.001 was used to get the minimum energy for the final defect.
In order to investigate the role of the hydrogen bonds, bond valence theory[26, 27] was used to estimate the strength of hydrogen bonds. The bond valence theory is based on the point that the bond length can describe the bond strength, it suggests that the longer the bond, the weaker the bond, and the smaller the bond valence; the bond valence sum of all bonds to one atom is equal to the valence of this atom. The relationship between the bond length and the bond valence was deducted from the accumulated experimental data[25]

where Sij and rij are the bond valence and the distance between atoms i and j, Ro and N are experiential parameters relating to the atom type and the valence which can be found in “ Accumulated table of bond valence parameters” .[28] Here, Ro is 0.087 nm and N is 2.2 for the bond valence between hydroxyl hydrogen and hydroxyl oxygen.
The vibrational frequencies of a molecule can be calculated from the Hessian matrix which is produced in the process of energy minimum.[29] In calculation, the Hessian matrix in Cartesian coordinates was firstly transformed to the matrix in mass– weight coordinates, and then the corresponding eigen-equation was solved for its eigenvalue λ i. The normal frequency ν i could be determined by

The calculated frequencies can be used to compare with the experimental results and test the force field.[2, 5, 17] In the present work, the k point used in the frequency calculation was default to the gamma point, and the direction of approach to the gamma point for the nonanalytic correction to the dynamical matrix was default to (1, 1, 1).
Calculated perfect lattice properties for F- and OH-topaz are shown in Table 2. It can be seen that a good agreement with experimental values is gained and all lattice parameters reproduced by CLAYFF have the difference of less than 1%, which are better than Jackson’ s results.[2, 5, 17] In addition, the H– H distance between two diagonally non-equivalent sites calculated here is 2.5 Å which is close to the experimental result.[1] Table 2 also gives the lattice properties for structures with different F/OH ratios, Al2(SiO4)[F0.70(OH)0.30]2[30] (here named as 0.70F-topaz), Al2(SiO4)[F0.72(OH)0.28]2[31] (0.72F-topaz), Al2(SiO4)[F0.78(OH)0.22]2 (0.78F-topaz), and Al2(SiO4)[F0.79(OH)0.21]2 (0.79F-topaz).[32] Once it was noted that the F-topaz structure was used to derive LJ12– 6 parameters, then calculations for other complex topazes containing F ions might be used to test supplemented CLAYFF. All calculated lattice parameters agree well with the observed structures and have the difference of less than 1%. The small deviations further indicate that the improved CLAYFF can model topazes with different F/OH ratios well.
| Table 2. The calculated lattice parameters for topazes with different F/OH ratios. |
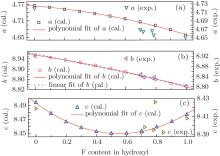
With OH-topaz as initial structures, lattice parameters with different F contents were also calculated by changing the F/OH ratio, the polynomial fit curves are shown in Fig. 2. The parameters of polynomial regression of a, b, and c, and the linear regression parameters of b are given in Table 3. For comparison, the experimental values of 0.70F-topaz, [30] 0.72F-topaz, [31] 0.78F-topaz, and 0.79F-topaz, [32] F- and OH-topaz[1] are also given in Fig. 2, it can be seen that the trends of calculated values agree with the experimental values, especially for b and c, although the values of a are a little higher than the experimental results in the middle range. In addition, although the polynomial regression seems more appropriate than linear regression, the values of b do not deviate from the simple linear correlations with F contents apparently.[33] This can be confirmed by the mean deviation between experiment and linear fit of b values, 0.0034, which is close to that between experiment and polynomial fit, 0.0032. The quasi-linear nature supports that the F content in topazes can be conveniently measured by the optical method because of the strong correlation between b and the optic axial angle.[33, 34]
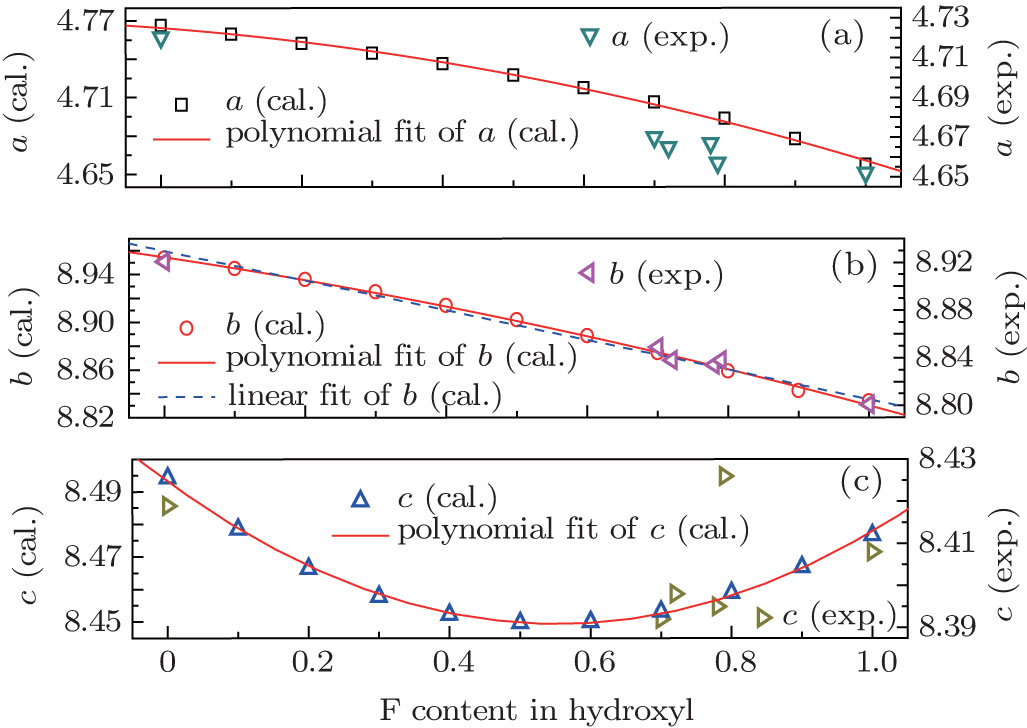 | Fig. 2. Lattice constants (a (a), b (b), and c (c)) of different F contents and their fit curves, and some experimental values for comparison. |
| Table 3. Polynomial regression equations of lattice parameters of different F contents (standard errors for the regression coefficients are given in brackets). |
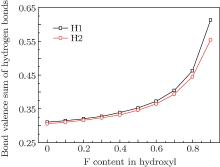
In order to investigate the role of the hydrogen bonds, bond valence theory[27] was used to estimate the strength of hydrogen bonds. Here, the sum of hydrogen bond interaction was considered and derived by subtracting OH bond valence from the H atom bond valence sum. It is noted that the hydrogen bonds include not only H· · · O interaction but also H· · · F interaction. The curves of the bond valence sum of the hydrogen bond around each H site are given in Fig. 3. As can be seen, with the increase of the F content, both bond valence sums of hydrogen bonds gradually increase, this means that the more F there is in hydroxyl of the structure, the stronger the hydrogen bonds. This may be the reason why there is a uniform contraction of cation polyhedra in F-topaz relative to OH-topaz.[1] In is also shown in Fig. 3 that the hydrogen bond sum around the H1 site is higher than the H2 site, which is consistent with the results[1, 35] and suggests the different circumstances around them.
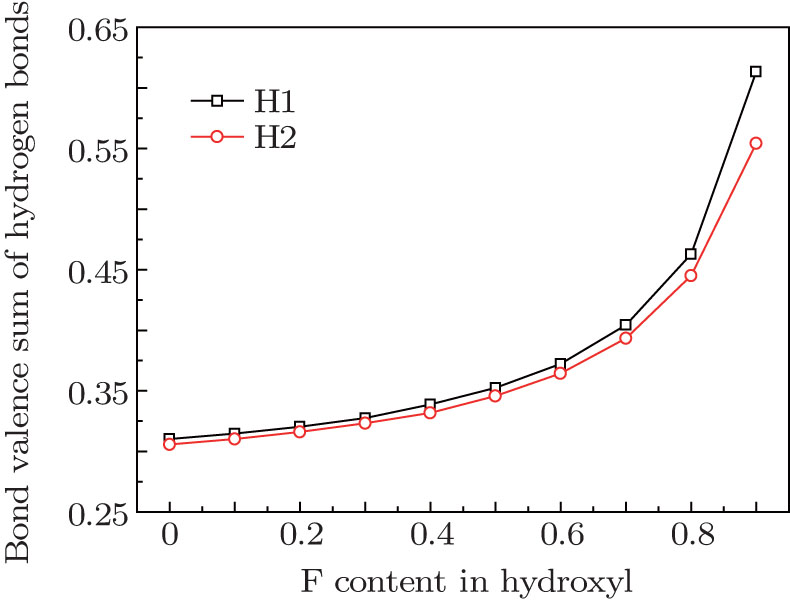 | Fig. 3. Bond valence sum of hydrogen bond in topazes with different F contents. |
The formation energies for the basic intrinsic defects in F and OH-topaz are given in Table 4 where the Krö ger– Vink defect notation[36] is used. All defect optimizations converge well, an exception is for Ali in OH-topaz, but this could be overcome by using a unit diagonal matrix as the starting point for Hessian when the exact Hessian is ill-conditional; [25] in Jackson’ s results, [2, 5, 17] the calculation for Sii did not converge and the corresponding Sii and Si Frenkel formation energies were absent. For both F-topaz and OH-topaz, cation vacancies have the highest formation energies which indicate that VAl and VSi defects are difficult to form. Ali, Sii, and SiAl in both topazes and OF in F-topaz have the negative formation energies which means that these defects are much easier to form and more stable in the lattice than the other basic degects. The formation energies of above basic defects are defined as the energies calculated from the difference between the pure and the defective lattices. These energies were then used in the calculation of the Frenkel and Schottky energies, which are reported in Table 5. Here, the interstitial site is (0.89723, 0.3691, 0.75) for F-topaz, (0.90189, 0.3679, 0.75) for OH-topaz and the hydrogen site of the interstitial hydroxyl is (0.69839, 0.40087, 0.75), as shown in Fig. 4. For F-topaz, the exchange between O and F, and the exchange between Al and Si are the lowest energy processes, which will be favored over Schottky defect formation. For OH-topaz the lowest energy processes is exchange between Al and Si, which is favored over Schottky defect formation and OH Frenkel formation, this contradicts Jackson’ s results, [2, 17] in which OH Frenkel formation is the lowest energy process. It can be reasonably explained: the bigger volume of OH than F will bring more lattice distortion, therefore, more forming energy is required. Al– Si exchange is supported by the observation that the spectra of the luminescence is due to AlO4, [37– 39] a centre formed when Al substitutes for Si and an extra hole is captured to neutralize the defect.
| Table 4. Basic defects formation energy. |
| Table 5. Calculated Frenkel, Schottky and ion exchange energies (U1 and U2 are the lattice energies of F-topaz and OH-topaz per unit chemical formula). |
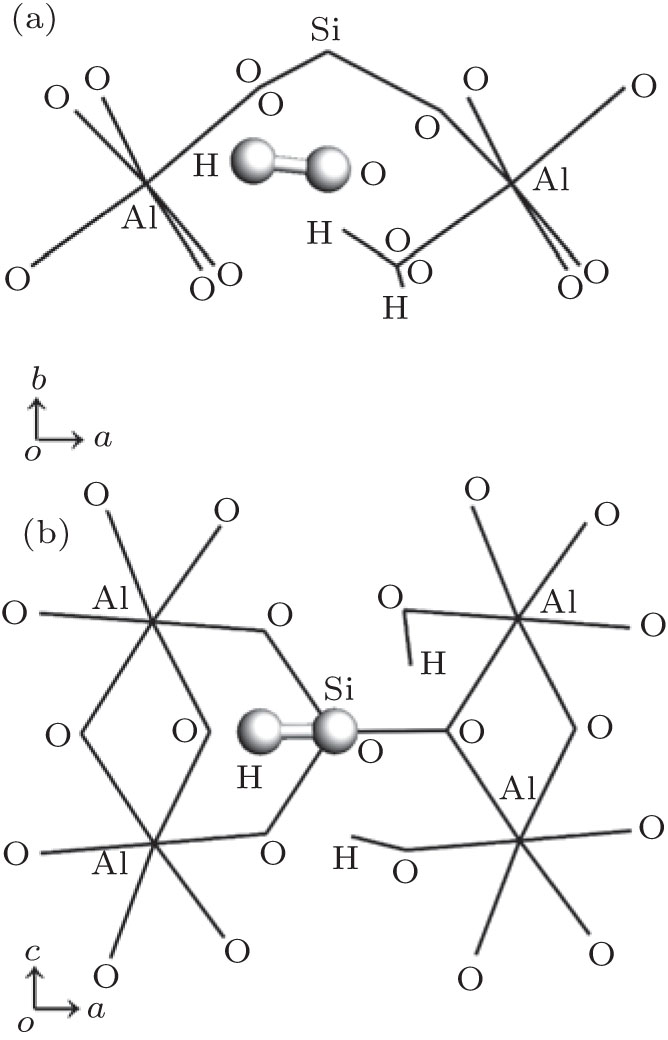 | Fig. 4. The considered interstitial site of hydroxyl group in OH-topaz, interstitial oxygen site is equal to that of hydroxyl oxygen. (a) viewed along c axis; (b) viewed along b axis. Hydroxyl group occurs in the interspaces formed by four octahedrons and a tetrahedron. |
In this paper, the derivation of F potential parameters supplemented in CLAYFF was reported. With supplemented CLAYFF, the lattice properties of F-topaz, OH-topaz, and some other complex topazes were calculated and the results agree with the available experiment data well. The calculations for topaz with different F contents indicate that b does not deviate from the simple linear correlations to fluorine content obviously, which supports that the content of F in topaz may be measured by an optical method. The role of the hydrogen bond was also discussed in this paper; the results reveal that the more F in hydroxyl of the structure, the stronger the hydrogen bonds; the hydrogen bond sum around the H1 site is higher than that around the H2 site. Defect calculations provide the formation energies of all common defects and can be used to judge the ease of formation of them. The frequency calculations reproduce experimental IR and Raman vibration well, and the 1080-cm− 1 frequency occurring in natural OH-topaz samples can be attributed to Si– F stretching caused by the F substitution to OH and the Al– Si exchange.
| 1 |
|
| 2 |
|
| 3 |
|
| 4 |
|
| 5 |
|
| 6 |
|
| 7 |
|
| 8 |
|
| 9 |
|
| 10 |
|
| 11 |
|
| 12 |
|
| 13 |
|
| 14 |
|
| 15 |
|
| 16 |
|
| 17 |
|
| 18 |
|
| 19 |
|
| 20 |
|
| 21 |
|
| 22 |
|
| 23 |
|
| 24 |
|
| 25 |
|
| 26 |
|
| 27 |
|
| 28 |
|
| 29 |
|
| 30 |
|
| 31 |
|
| 32 |
|
| 33 |
|
| 34 |
|
| 35 |
|
| 36 |
|
| 37 |
|
| 38 |
|
| 39 |
|
| 40 |
|
| 41 |
|
| 42 |
|
| 43 |
|