Laser-driven flier impact experiments at the SG-III prototype laser facility
[Shui Min, Chu Gen-Bai, Xin Jian-Ting, Wu Yu-Chi, Zhu Bin, He Wei-Hua, Xi Tao, Gu Yu-Qiu† ]
]
]
|
|


†Corresponding author. E-mail: yqgu@caep.cn
Laser-driven flier impact experiments have been designed and performed at the SG-III prototype laser facility. The continuum phase plate (CPP) technique is used for the 3 ns quadrate laser pulse to produce a relatively uniform irradiated spot of 2 mm. The peak laser intensity is 2.7×10¹³ W/cm2 and it accelerates the aluminum flier with a density gradient configuration to a high average speed of 21.3 km/s, as determined by the flight-of-time method with line VISAR. The flier decelerates on impact with a transparent silica window, providing a measure of the flatness of the flier after one hundred microns of flight. The subsequent shock wave acceleration, pursuing, and decay in the silica window are interpreted by hydrodynamic simulation. This method provides a promising method to create unique conditions for the study of a material’s properties.
The shock compression of condensed materials can be induced by lasers via direct drive, indirect hohlraum drive, and flier plate impact. As relatively mature techniques, flier acceleration by explosive and two-stage gas gun has been extensively employed for the study of the dynamic properties of materials such as equation of state (EOS), [1] phase changes, [2] and strength due to their high measurement precision. However, achievable flier velocity is limited to 10 km/s by these methods and the shock pressure is restricted below tera-Pascal (TPa). Compared with these conventional flier accelerations, a laser-driven flier has received considerable attention in recent years because it can achieve higher speed and produce higher pressure. A very high pressure of 75 TPa has been achieved by an x-ray driven gold flier impact.[3] Furthermore, unlike laser direct drive, a laser-driven flier is free from x-ray or hot electrons preheat and thus generates clean shock in materials. A laser-driven flier has many promising applications, such as EOS measurements under ultrahigh pressure, material dynamic properties under high strain rate (> 106 s− 1), high-speed impact simulation for aircraft protection, as well as explosive ignition.
For a laser-driven flier, we are mainly concerned with its velocity, impact planarity, and integrity during flight. To achieve high flier velocity, high laser intensity is needed, which is easy to achieve for a short duration pulse. The impact planarity and integrity mainly depends on the uniformity of the drive laser source. Once the laser intensity is not spatially uniform, different parts of the flier will be subjected to different forces, thus leading to a bad planarity. Even worse, the flier will tend to collapse after a time of flight. Hence, the drive laser should be spatially smoothed to produce a more uniform beam. For the flier target design, single-layered or multi-layered fliers configuration are adopted. The single-layered flier has been extensively employed because it is easy for design and fabrication. The multi-layered fliers usually consist of shine-through-shield layer, ablator, and metal flier layer, [4– 6] which has an advantage of a potential to achieve a high velocity free from preheat.
In this paper, we have designed and conducted laser driven flier impact experiments with a single-layered aluminium (Al) flier. The Al flier has been accelerated up to an average velocity of 21.3 km/s and impacts the fused silica sample with a time nonuniformity of 3.6%. The flier impact generates shocks in the silica, induces phase transition, and increases the wave front reflectivity, making the shock velocity detectable.[7] In this way, we indirectly deduce the flier state by analyzing the shock wave characteristic in the silica. The experimental results are in good agreement with the hydrodynamic simulation.
Table 1 shows the recent laser-driven flier results. The highest flier velocity has been achieved by Fu et al.[8] who succeeded in launching a 10-μ m Al flier to 30.3 km/s. They obtained the flier average velocity on the basis of observation of the shock luminescent signal from the rear surface of an inclined target impacted continuously by the flier. Their idea and design were innovative; however, they could not directly measure the shock wave velocity in the target and, therefore, could not infer the state of the flier. Besides, the planarity of the flier could not be deduced due to the inclined target design. Nevertheless, considering the flier size and thickness, the momentum of the flier in Ref. [8] is a little (about 1.2 times) higher than ours. Similarly, in Ref. [9], Okada et al. have accelerated an 8-μ m three-layered Ta flier to 23.6 km/s. An advantage of the multilayered flier is the potential of achieving a very high velocity without preheating. Similarly, they obtained the flier average velocity by measuring the time difference of the flier impact with a quartz step and also could not determine the status of both the flier and the target simultaneously, like the present system. In general, the problem of high-speed flier study is how to continuously measure the instantaneous flier velocity, where a short and strong laser pulse is usually employed. This is difficult since the flier free-surface has always been damaged by strong shocks. Nevertheless, the present system is considered to be readily applicable to EOS measurement at high pressure, especially when the flier velocity is not very high.[12]
| Table 1. Recent laser-driven flier results. |
The experiments have been performed at the SG-III prototype laser facility of CAEP. The wavelength of the laser beam is 351 nm and the temporal profile is a quasi-square shape with a rise time of 200 ps and a FWHM time of 3 ns. Each of the four beams is smoothed by continuum phase plate (CPP) and irradiates the target at an incident angle of 45° , producing a uniform focal spot diameter of 2 mm. The peak laser intensity on the target is 2.7× 10¹³ W/cm2 with a total energy of 2698 J.
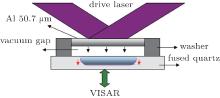
In the experiments, a single Al foil flier was launched and the flying distance between the flier and fused silica was 100 μ m. As shown in Fig. 1, the Al flier flew in the vacuum gap and decelerated on impact with the fused silica. Before flier impact, the probe beam of the line-imaging velocity interferometer systems for any reflector (VISAR) passes through the fused silica window and irradiates the free surface of the flier. In this way, the flier velocity could be deduced by the fringe shift associated with the Doppler shift during the duration of the flight. After the flier collides with the 2-mm-thick fused silica, a shock wave is generated and the wave front reflectivity increases due to phase transition, making the shock velocity detectable. To obtain accurate velocity data in case of fringe discontinuities, two VISARs with different velocity sensitivities (7.37 km/s and 5.34 km/s) were used to discern 2π fringe ambiguities.[13] The wavelength of the VISAR probe beam is 532 nm and pulse duration is 14 ns with a shape of quasi-flat-top profile. Streak cameras were used to record the fringe pattern and a portion of the VISAR probe beam was guided into the streak camera by a fiber to monitor the fringe intensity. The field of view at the target plane is about 600 μ m, and the recorded time range is 20 ns with a time resolution of 20 ps.
 | Fig. 1. Schematic diagram of the flier target configuration and experimental setup. |
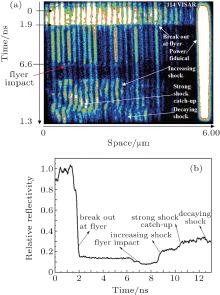
A typical VISAR image is shown in Fig. 2(a) and the corresponding fringe intensity reflectivity normalized by the power fiducial is shown in Fig. 2(b).
 | Fig. 2. (a) Raw line VISAR image for shot 114. (b) Normalized relative reflectivity profile deduced by the power fiducial. Time 0 refers to the instant the drive laser loading. |
As shown in Fig. 2(a), the VISAR fringe pattern clearly shows the process of flier launch, flight, and impact. As the drive laser has a shape of quasi-square profile and high intensity, a strong shock is quickly generated in the flier. As shown in Fig. 3, before the flier impact, the intensity of the fringe pattern can be expressed as

where Iin is the input VISAR probe beam intensity, Rw and RAl is the reflectivity of fused silica surfaces and Al flier free-surface, respectively. At 1.4 ns after the drive laser loading, the shock breaks out and the rear surface of the flier releases into a vacuum. Shock heating and wave reverberation make the rear surface of the flier melt or ionize, which then strongly absorbs the probe laser (RAl ≈ 0) and the corresponding VISAR fringe intensity falls suddenly. As shown in Fig. 2(b), the relative reflectivity of VISAR fringes drops abruptly to 18% at the moment of shock breaking out, mainly stemming from the fused silica surface reflection (IinRw). Since the fused silica surface is not deposited with anti-reflective coatings, the fringe intensity due to the front and rear surface reflection (Rw ≈ 8%) is still apparent. According to (IinRw)/(IinRw + Iin (1 − Rw)RAl(1 − Rw)) = 0.18, we obtain the absolute static Al reflectivity RAl = 0.42, where high-order small items RwRAl and 
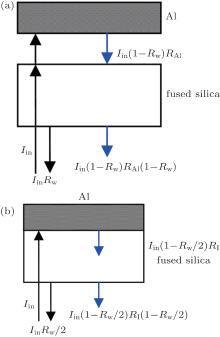
 | Fig. 3. Reflection of the VISAR probe laser before (a) and after (b) flier impact. |
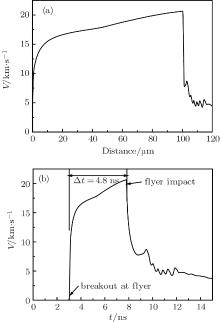
From Δ t and vacuum gap distance, an average flier velocity of 21.3 km/s is obtained. This is in very good agreement with the simulation results using a hydrodynamic code, MULTI, as shown in Fig. 4. MULTI is a 1D and two-temperature hydrodynamic code with coupled thermal radiation transport, heat conduction, and several energy deposition mechanisms: laser beams, ion beams, and fusion produced α -particles.[14] The Al and silica samples are divided into 200 and 500 cells, respectively, while the vacuum gap only occupies 1 cell. At time 0, the laser beam front arrives at the front surface (left side) of the Al layer, and the laser energy is deposited by direct ablating a part of Al cells. The laser ablation generates shock waves and drives the remaining Al cells fly towards the silica until impact occurs. The simulation can give the velocity and displacement of every cell, density, pressure, and ion temperature between two adjacent cells.
 | Fig. 4. One-dimensional simulation results for flier acceleration and impact. The Al flier reaches its maximum velocity after 4.8 ns time of flight. (a) Flyer velocity versus flight distance. (b) Flyer velocity versus time. |
The flier-colliding planarity is determined to be 3.6%, based on the time dispersibility (Δ t/t) of the spatial fringe pattern at the impact moment. This planarity may result from spatial variations of the drive laser intensity distribution, thickness variations of the Al foil and fused silica, as well as the vacuum gap length. Edge rarefaction will reduce the flier edge velocity and ruin the planarity, limiting the vacuum gap distance and thus the achievable larger flier velocity.
It is worth noting that there exists a step in the falling edge of the reflectivity at around 6.5 ns. The reflectivity first decreases to 12% and further to 10%, which is slightly higher than half of that before flier impact. As shown in Fig. 3(b), we have

where RI is the reflectivity of Al/silica interface. The RI is determined to be 0.01– 0.02, suggesting a reflectivity decrease of the front silica surface at the beginning of the flier impact. Ideally, a high-speed solid flier impact will generate two reversely propagating shocks, one in the flier and the other in the sample. For some transparent materials (such as liquid Deuterium, [15] quartz, [16, 17] sapphire (Al2O3), and lithium fluoride (LiF)[18]), the strong shock will bring pressure-induced ionization or phase change and lead to a resultant optical reflectance increase at the shock front. Simultaneous measurements of shock velocity and optical reflectance at different wavelengths of a high-pressure shock front propagating through liquid deuterium show a continuous increase in reflectance (pressure range 17– 50 GPa), which indicates that the shocked deuterium reaches a conducting state characteristic of a metallic fluid.[15] Shock melting of α -quartz, detected using temperature measurements, was observed at 1.1 Mbar.[16] Silica transforms from a liquid near melt into a dense plasma within a pressure range of 2– 15 Mbar.[17] Transparent Al2O3 and LiF have transformed from wide band-gap insulators into partially degenerate liquid semiconductors with optical reflectivities of several percent.[18] Here the VISAR fringe shift with an optical reflectivity related to the electronic conductivity increases after flier impact means that the resultant shock wave has resulted in silica transforming from nonconductive solid state to the conducting state characteristic of a metallic fluid.
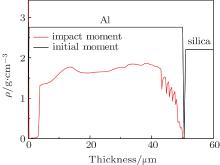
The reflectivity decrease for about 1 ns after flier impact in our case suggests the Al flier is not in its initial solid state. Figure 5 shows the simulation results of density distribution in the flier and silica at the moment of flier impact. We can see that the whole density decreases within the flier and a falling edge close to the flier rear surface. As our laser intensity is quite high, a strong shock is generated in the flier. Once the shock reaches the flier free surface, it begins to release and the free-surface expands fiercely to the vacuum, making it melting or even vaporise.[19] This will subsequently reduce the density around the flier free-surface and result in a falling edge with a density platform profile. This density characteristic will subsequently influence the shock wave behavior in the silica by the flier collision.
 | Fig. 5. Simulated density of flier and silica at different sample position. Black line shows the density at initial moment, and the red line shows the density at impact moment. The 100 μ m vacuum gap is omitted. |
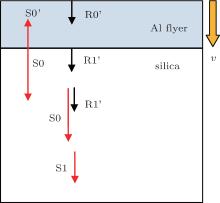
Generally, when a solid thin flier (Al) collides with a solid target (silica), two shocks S0 and S0’ will be generated with opposite directions, one propagates in the flier S0 and the other in the target S0’ , as shown in Fig. 6.
 | Fig. 6. Ideal shock wave behavior by flier impact. S denotes shock wave, R denotes rarefaction wave. |
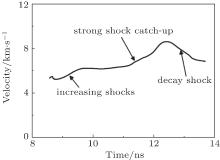
Since the flier is much thinner than the target, the rarefaction wave R0’ by free-surface reflection in the flier will quickly enter the silica to catch up with the shock S0 and this shock S1 begins to decay. Thus, we would observe a short propagating shock within the target and rapidly decay due to rarefaction wave chase from the flier. The duration of the fully supported shock by flier impact is approximately the shock round-trip time in the flier. However, in our case as shown in Fig. 7, the shock velocity in the silica deduced from the VISAR data displays a quite different pattern, which consists of three processes: increasing shocks, strong shock catch-up and decaying shocks. This can be interpreted by the 1D flier density characteristic (see Fig. 5) and two-dimensional (2D) density distribution (see Fig. 8).
 | Fig. 7. Shock velocity curve in the fused silica obtained from the VISAR data. |
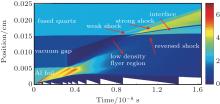
 | Fig. 8. Density distribution versus cell position (cm) and time (s) obtained by 1D MULTI simulation. |
As shown in Fig. 8, the flight leading edge of the flier has a higher velocity but relatively lower density, while the rear flier layer has lower velocity but higher density. The low density flier impact generates weak compression wave in the fused silica and the subsequent impact of the higher density region drives a subsequent stronger shock. After several nanoseconds, the latter strong shock catches up with the weak one and then the shock decays. As shown in Fig. 2(b), the absolute reflectivity of the shock front Rs in fused silica is determined to be 0.08 ≤ Rs ≤ 0.15. According to the phase diagram of fused silica and its shock reflectivity as a function of temperature, the corresponding shock temperature is 1.1– 1.5 eV and shock pressure is 171– 223 GPa in silica, respectively.[9] Therefore, the high-speed Al flier with a density profile here has produced a shockless compression in silica in addition to an initial shock, which is different from a usual solid flier impact loading.
In conclusion, we have designed and conducted a laser-driven flier impact experiment at the SG-III prototype laser facility. We have accelerated a single Al flier to a high average velocity of 21.3 km/s using a 3-ns quadrate laser pulse at 351 nm after spatial homogenization. We have employed line VISAR to monitor the processes of flier launch and flight in a vacuum gap and inferred the shock velocity associated with phase change in fused silica target after flier impact. The reflectivity variations of the VISAR fringe pattern and the shock velocity in the fused silica suggest that the flier owns a density gradient characteristic. This flier’ s impact has produced a complex-path loading in the target, a ramp compression following an initial shock. Based on one-dimensional hydrodynamic simulation, we have qualitatively interpreted the flier’ s impact processes, including increasing shocks, strong shock catch-up and decay shock. According to the shock reflectivity, the peak shock temperature in the fused silica is 1.5 eV and peak pressure is 223 GPa, respectively.
The authors are very grateful to the faculty in the division of target science and preparation for fabricating the flier targets used in our experiment. The authors also would like to thank the SGIII prototype faculty for operating the laser facility and the division of experimental physics for VISAR measurements.
| 1 |
|
| 2 |
|
| 3 |
|
| 4 |
|
| 5 |
|
| 6 |
|
| 7 |
|
| 8 |
|
| 9 |
|
| 10 |
|
| 11 |
|
| 12 |
|
| 13 |
|
| 14 |
|
| 15 |
|
| 16 |
|
| 17 |
|
| 18 |
|
| 19 |
|