

X-ray communication based simultaneous communication and ranging*
[Song Shi-Bina) , Xu Lu-Ping†a)  , Zhang Hua
a) , Gao Nab) ]
, Zhang Hua

†Corresponding author. E-mail: lpxu@mail.xidian.edu.cn
*Project supported by the National Natural Science Foundation of China (Grant Nos. 61172138 and 61401340), the Research Fund for the Doctoral Program of Higher Education of China (Grant No. 20130203120004), and the Fundamental Research Funds for the Central Universities, China (Grant Nos. 201413B, 201412B, and JB141303).
To improve the link efficiency and decrease the payloads in space explorations, a novel simultaneous communication and ranging method based on x-ray communication (XCOM) is proposed in this paper. A delicate signal symbol structure is utilized to achieve simultaneous data transmission and range measurement. With the designed symbol structure, the ranging information is imbedded into the communication signal and transmitted with it simultaneously. The range measurement is realized by the two-way transmission of the range information. To illustrate the proposed method, firstly, the principle of the method is introduced and the signal processing procedure is presented. Then, the performance of the proposed method is analyzed theoretically in various aspects, including the acquisition probability, the bit error rate, the ranging jitter, etc. Besides, numerical experiments are conducted to verify the proposed method and evaluate the system performance. The simulation results show that the proposed method is feasible and that the system performance is influenced by the parameters concerning the signal symbol structure. Compared with the previous methods, the proposed method improves the link efficiency and is beneficial for system miniaturization and integration, which could provide a potential option for future deep space explorations.
With the development of space explorations, large volumes of data are generated in various formats. These data need to be transmitted rapidly for timely processing. Therefore, how to guarantee a high-rate data transmission link becomes a critical issue.[1] On the other hand, range measurement, an essential characteristic in space exploration, has found its application in various areas, such as navigation, [2, 3] satellite constellation configuration, [4, 5] spacecraft navigation and control, [6] etc. Since the transmission environment changes frequently in deep space, the duration of the available link is limited. Thus, high efficiency in the utilization of the link is critical, and simultaneous operation could be an option. Simultaneous communication and ranging not only saves the power and the bandwidth, but also efficiently takes advantage of the link availability. Besides, simultaneous communication and ranging can provide lighter and cheaper onboard equipment, which is beneficial for system miniaturization and integration.
There are several works in the literature focusing on developing a composite system for simultaneous communication and ranging.[7– 9] However, the present composite system cannot fully achieve simultaneous operations. It is actually a time-sharing system, which conducts the communication and the ranging at different time periods. This will lead to a low link efficiency and a waste of the system resource. In Ref. [10], Andrews et al. proposed a telemetry-based ranging method. The most notable feature of this method is that the downlink signal is replaced by a telemetry signal while the uplink signal remains in its original form. By estimating the delay between the arrival time of the uplink signal and the emitting time of the telemetry signal and sending the delay to the ground station, the range could be obtained. The flaw of this method is that the data can only be transmitted along the downlink, limiting its application. Sun et al. demonstrated the simultaneous communication and ranging between the satellite laser ranging (SLR) station at NASA’ s Goddard Space Flight Center (GSFC) and the Lunar Reconnaissance Orbiter (LRO).[11] The communication was carried out by a 4096-ary pulse position modulation and the ranging measurement was conducted by recording the pulse arrival time and sending it back to the emitter. In the system, an extra microwave link was required to send the time information back to the emitter, which consumed the link power and bandwidth and needed an extra microwave equipment.
Given the flaws of the available methods, in this paper, we propose a novel simultaneous communication and ranging method based on the x-ray communication (XCOM). XCOM is a revolutionary concept of deep space communication proposed by NASA, [12] which utilizes x-ray as the medium to convey information. The development in areas such as x-ray source, [13– 15] x-ray detector, [16, 17] etc. has inspired the further application of x-ray. Similar to XCOM, the proposed method also utilizes x-ray as the transmission medium and adopts the circular polarization method to modulate the signal. Different from the previous methods, the proposed method can realize the communication and the ranging simultaneously with a unique signal format in both uplink and downlink. With the designed signal format, the ranging and communication information is integrated and sent at the same time, which enhances the link efficiency. Besides, the communication and the ranging share the same equipment, providing the potential of system miniaturization and integration.
In this paper, the proposed method is analyzed in detail. In Section 2, both the principle of the proposed method and the structure of the designed signal symbol are presented. The signal modulation scheme and the signal processing procedure are also discussed. Then, the detailed analysis of the system performance, both mathematically and numerically, is presented in Section 3. Finally, a conclusion is made in Section 4.
In the range measurement, the ranging signal is used to inform the signal arrival and can be regarded as a trigger signal for the receiver. Thus, the form of the uplink signal can be diverse, not necessarily the pure ranging signal. To conduct a range measurement, the ranging information is imbedded in the ranging signal and transmitted between objectives. The ranging information could also be integrated into the communication signal and would have little interference on the communication data transmission. Thus, there is a possibility that the communication and the range measurement can be performed simultaneously.
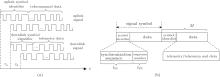
Figure 1(a) presents the time scheme of the simultaneous communication and ranging method and figure 1(b) indicates the designed signal symbol structure. It should be noted that the uplink and downlink signals share a similar symbol structure. For the uplink signal, there is an uplink symbol identifier at the head of the symbol. Following the identifier is the communication data. The symbol identifier contains two parts: the synchronization sequence and the sequence number (SN). The synchronization sequence is generally a pseudo random code with a fine autocorrelation property, used for the acquisition of the symbol. The SN is the unique identifier of the symbol that is used for the time synchronization of the range measurement. The SN is transmitted to the slave station and sent back to the master station. By pairing up the received SN with the local SN at the master station, we could obtain the arrival time of the specific SN. Knowing the emitting time of the specific SN, we could acquire the two-way light travel time τ . Subsequently, the range can be calculated by

where c is the speed of light.
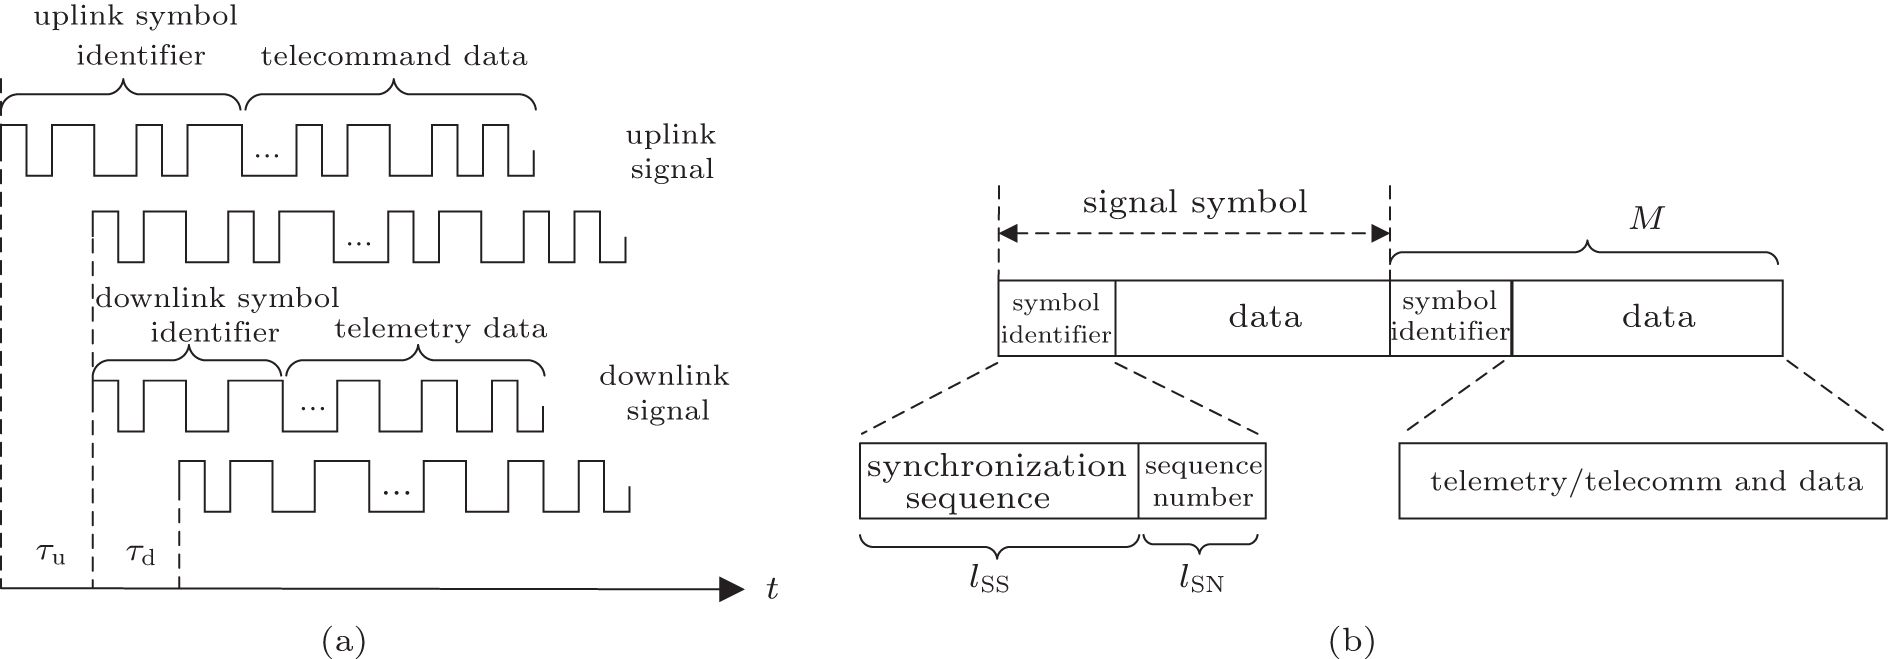 | Fig. 1. Simultaneous communication and ranging method: (a) time scheme of the proposed method, (b) signal symbol structure. |
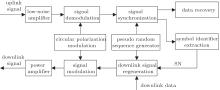
The flow charts of the signal processing procedures in the master station and the slave station are presented in Figs. 2 and 3, respectively. It can be seen that the master station and the slave station share some similarities in the signal processing procedure. In the following sections, we discuss the system structure by analyzing the key points of the proposed method.
 | Fig. 2. Flow chart of signal processing in the master station. |
 | Fig. 3. Flow chart of signal processing in the slave station. |
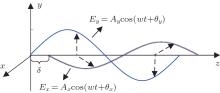
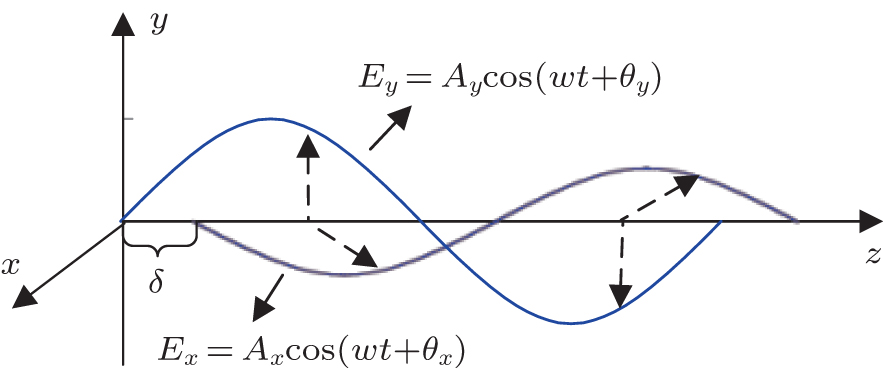
The proposed method utilizes the circular polarization modulation to modulate the x-ray signal. Polarization is the unbalanced vibration of the light vector on the plane perpendicular to the light propagation direction.[18] A polarization state shows fine stability in space propagation, [19, 20] which makes it a proper choice for space communication.[21, 22] The circular polarization modulation is to convert binary codes into circular polarization states. To describe the circularly polarized signal, the Stokes vector is adopted
where Ax and Ay are the amplitudes of the light components, and δ is the phase error between the two light components, i.e., δ = θ x − θ y, with θ x and θ y being the phases of the light components indicated in Fig. 4. The δ determines the type of polarization state. Then, we can express the circularly polarized signal as

where M is the length of the signal sequence,
and s(t) is the signal wave defined as

where T is the slot duration, g(t) is the gate signal, and {di} is the signal in binary form.
 | Fig. 4. Light vector components of polarized light. |
The detection of the circularly polarized signal is realized with a series of optical devices and the differential detection is adopted to mitigate the noise interference. The details in detecting the circularly polarized signal will be presented in the sections of performance analysis.
Signal synchronization aims at separating one signal symbol from another and setting the boundaries of the symbols. The synchronization is conducted by correlating the synchronization sequence of the symbol with the local sequence. The property of the correlation process determines the quality of the signal acquisition. Thus, choosing a proper synchronization sequence becomes an issue of great importance.
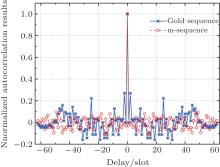
The m-sequence and Gold sequence are widely used synchronization sequences in various areas, such as spread spectrum communication, navigation, signal synchronization, etc. The Gold sequence is generated by the modulo-2 addition of two m-sequences.[23] As to the correlation property, the m-sequence has a better auto-correlation property than the Gold sequence while the Gold sequence shows better performance in cross-correlation, as shown in Fig. 5. For the proposed method, we are concerned more about the autocorrelation property of the sequence. Thus, the m-sequence is chosen as the synchronization sequence for the proposed method.
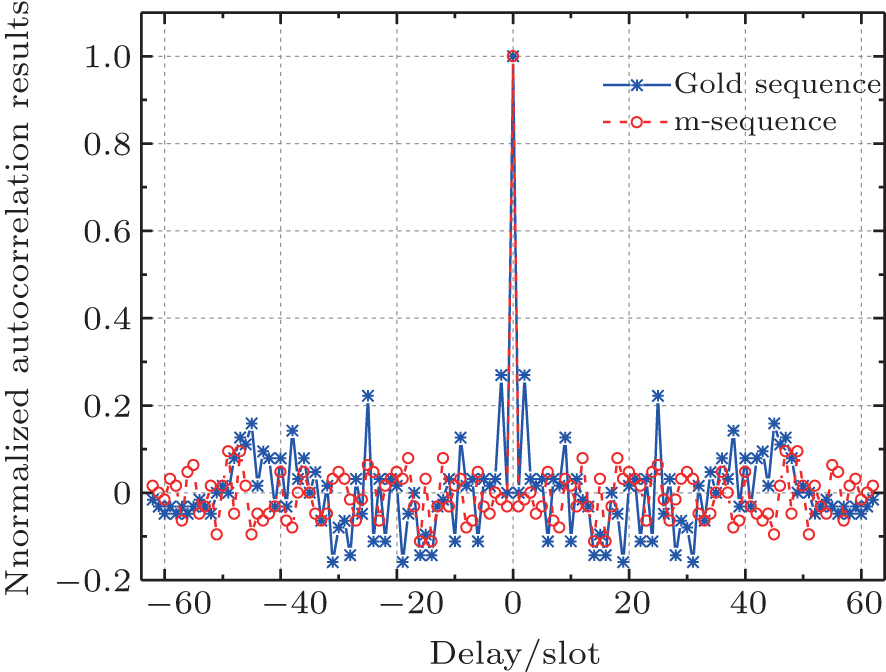 | Fig. 5. Normalized autocorrelation property of the m-sequence and the Gold sequence. The generation of the m-sequence is based on a simple sequence register generator (SSRG) with an order of 6, and the Gold sequence is generated with two m-sequences with the order of 6 using the parallel generation structure.[23, 24] For the m-sequence, the ratio of the correlation peak value to the second peak value, termed as the peak ratio, is 10.5, while for the Gold sequence it is only 3.7. It means that the m-sequence has a better autocorrelation property for detection than the Gold sequence under the same condition. |
For the proposed method, the regeneration pattern is used for the downlink signal generation. Compared with the transparent pattern, which generates the downlink signal by reflecting the uplink signal, the regeneration process is to regenerate the downlink signal based on the received uplink signal. The regenerated signal shares the same structure with the uplink symbol. The difference is that the SN is extracted from the uplink signal and is reassigned to the downlink symbol instead of local generation. Besides, to distinguish the downlink from the uplink, the synchronization sequence of the downlink symbol is the reverse of that of the uplink. With the regeneration process, the signal-to-noise ratio (SNR) of the downlink signal is raised, which consequently improves the system performance.
The time synchronization between the master station and the slave station is achieved by the pair-up of SNs. An SN, denoted as SNi, is generated at the master station and assigned to an uplink symbol. SNi satisfies SNi ∈ [0, 2lSN − 1] and SNi ∈ N. In a sense, we can use SNi to represent the uplink symbol. Based on the flow charts shown in Figs. 2 and 3, the time delay can be calculated. When the symbol is transmitted, its emitting time is recorded by correlating the signal with the local synchronization sequence. Through transmission, at the slave station, the uplink signal is received and SNi is extracted. Then, SNi is reassigned to the downlink symbol during the regeneration process and sent back to the master station. Back at the master station, the downlink signal is correlated with the local synchronization sequence to determine the arrival time of the downlink symbol, and the downlink SN is paired up with the local SN. Thus, by pairing up SNs, we know the emitting time and the arrival time of a specific symbol. By measuring the travel time of SNi, we can obtain the two-way time delay τ .
As shown in Fig. 2, an SN generator is used to generate SN for the signal symbol. The function of SN is for the time synchronization in the system. It should be noted that SN increases monotonically when generated. The repetition rate of the SN generator is defined as frep_SN = 1/2lSN, where lSN is the length of SN. It should be noted that the repetition rate is not directly related to time, but to the length of SN. On the other hand, the ranging repetition rate is related to the length of the symbol, defined as frep_range = 1/MT, where M is the length of the signal symbol in units of slots and T is the slot duration. To guarantee a proper ranging repetition rate, the length of the symbol is limited.
As shown in Fig. 1, the data region of the signal symbol has a length of M − lSS − lSN, where lSS is the length of the synchronization sequence. As the signal is modulated by the circular polarization modulation method, the data transmitted by one symbol is M − lSS − lSN bits. Thus, the data rate (bit/s) is defined as
From Eq. (6), we know that the data communication rate is related to the symbol structure and the slot duration. Besides, the data communication rate conflicts with the ranging repetition rate. Therefore, there should be a balance between the data communication rate and the ranging repetition rate.
As discussed in the previous section, the length of SN determines the repetition rate of SN, frep_SN. Further, frep_SN influences the maximum unambiguous range (Rmax). The maximum number of symbols marked by SN is NSN = 2lSN. For the proposed method, the maximum unambiguous range is defined as half of the maximum range that the symbol travels before another symbol with the same SN is emitted. Then, the maximum unambiguous range Lm can be expressed as
Based on Eq. (7), with a larger lSN, a longer Rmax could be obtained. It can also be concluded that Rmax is in conflict with the range repetition rate. To obtain a long Rmax, the ranging repetition rate is limited. Besides, it should be noted that SN only contributes to the ranging process and has little impact on the communication data transmission.
For the proposed method, an m-sequence with a length of lSS is adopted as the synchronization sequence, which is used for the signal symbol acquisition. We define the synchronization sequence as
where {mi, i = 0, … , lSS − 1} is the m-sequence code and g(t) is the gate function defined as
Passing through the deep space channel, sSS (t) is influenced by noise and becomes
where n(t) is a zero-mean additive Gaussian white noise with a two-sided power spectral density of N0/2. To acquire the signal symbol, the received synchronization sequence is correlated with the local synchronization sequence. The correlation between sSS(t) and 
where Tcorr is the correlation time and ξ SS is the influence of noise on the correlation. We have

The ξ SS(k) is a Gaussian variable with zero mean value. As n(t) has a two-sided power spectral density of N0/2, the variance of ξ SS(k) is N0Tcorr/2.
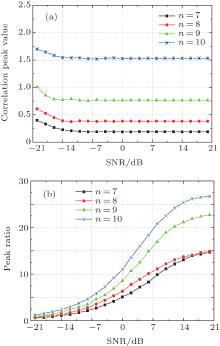
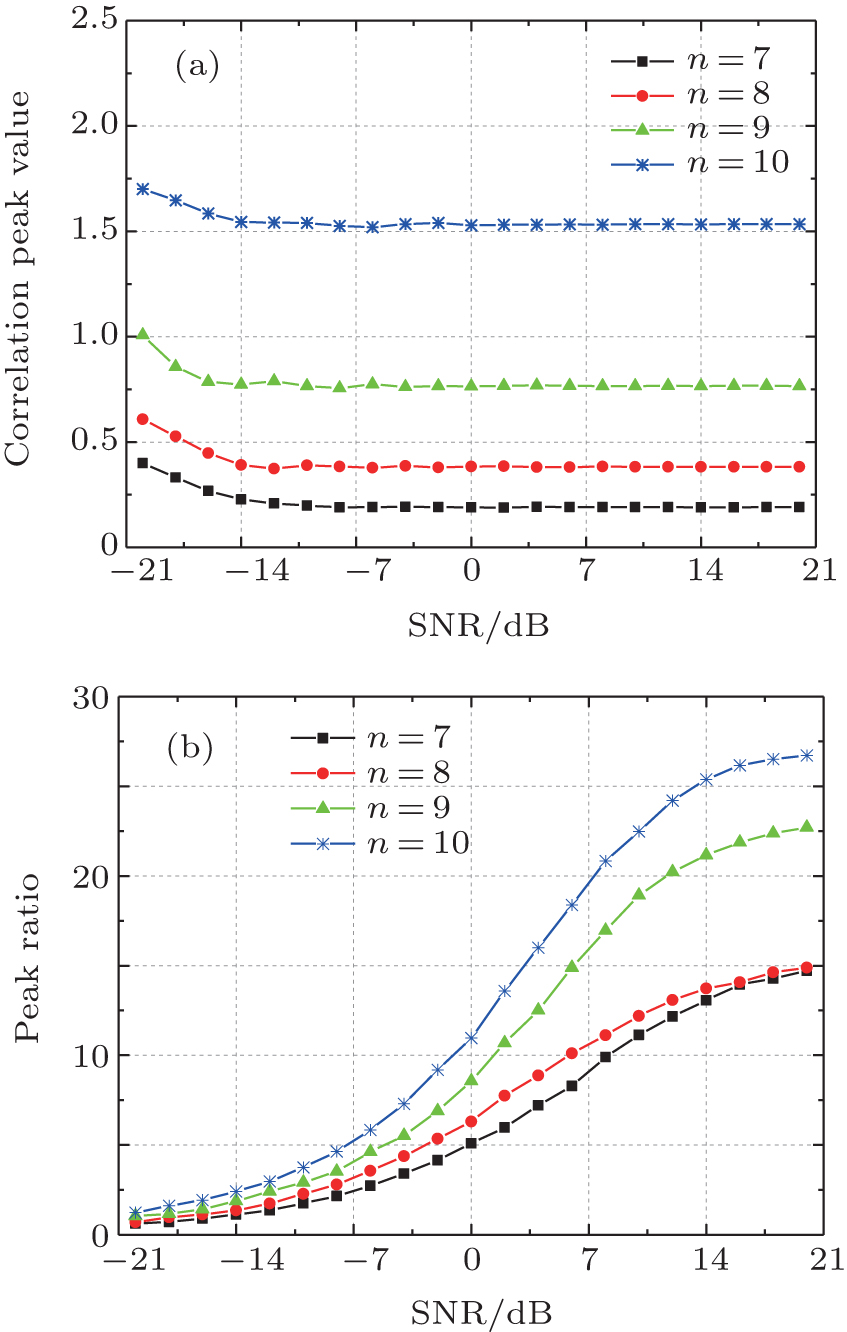 | Fig. 6. Impact of noise on synchronization: (a) average correlation peak values, (b) peak ratio of the correlation results under different SNR. |
A simulation is performed to show the impact of noise on the synchronization. For the simulation, m-sequences with different orders (n = 7, 8, 9, 10) are used and additive Gaussian noises with different power levels are added to the m-sequences. Then, the noise-interfered m-sequence is correlated with the local sequence without noise. The slot duration is set to T = 10 ns. Figure 6(a) shows the average correlation peak values. For each SNR in the figure, the peak values of the correlation results are averaged over 100 trials. It can be observed in Fig. 6(a) that the correlation peak is high and fluctuant at lower SNR. The high and fluctuant correlation at low SNR is caused by the high noise power. When SNR is large, the peak values become steady, which indicates the weak influence of noise. Figure 6(b) is the peak ratio of the correlation results under different SNR. Here, we define the peak ratio as pr = pin− phase/pmax, where pin− phase is the peak value of the correlation result when the two sequences are in-phase, termed as the in-phase peak, and pmax is the peak value of the correlation results excluding the in-phase peak. Similar to Fig. 6(a), for each SNR, the correlation process is performed 100 times and the peak ratios are averaged over the 100 trials. It can be seen that as the SNR increases, the peak ratio increases accordingly, which means with high SNR, the peak value can be clearly separated. At low SNR, the peak ratio is small because of the influence of noise. When the SNR is extremely low, the peak ratio is under 1. The reason is that the in-phase peak is overwhelmed by noise and then the in-phase peak value cannot be correctly detected.
Besides the correlation results, the acquisition probability, denoted by Pacq, is utilized to evaluate the acquisition performance. The acquisition probability is defined as the probability of successfully acquiring the peak value of the correlation results. Then, we have the following expression:
Though ξ SS(0) and ξ SS(k) are both Gaussian distributions with zero mean value, it should be noted that ξ SS(0) and ξ SS(k) are not independent. This is because sSS(t − kT) and sSS(t) are coupled by the time delay. Since the length of the synchronization sequence is limited and the influence of the coupling on the integration can be ignored, ξ SS(0) and ξ SS(k) can be considered to be approximately independent. Therefore, ξ SS(k) − ξ SS(0) follows a Gaussian distribution with a zero mean value and a variance of N0Tcorr, and
Then equation (13) can be rewritten as
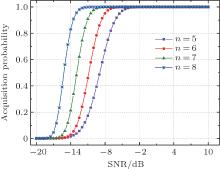
Figure 7 shows the acquisition probability under different SNR. In the simulation, m-sequences of different orders (n = 5, 6, 7, 8) are used and Gaussian white noises of different power levels are added to the sequences. Then the acquisition probability is calculated. As shown in the figure, under low SNR, the synchronization is influenced by the noise and the acquisition probability is small. With increasing SNR, the acquisition probability rises accordingly because of the weak noise influence. It can also be concluded that a longer synchronization sequence shows better performance in acquisition. The reason is that the long synchronization sequence has better correlation performance and anti-noise property.
 | Fig. 7. Acquisition probability under different SNR. |
Because of the noise in the communication channel, the signal is distorted during the propagation. To evaluate the distortion, the bit error rate (BER) is commonly used. As for BER, it varies with different choices of the modulation methods. Besides, passing through the deep space channel, x-ray scintillation occurs. The x-ray scintillation will influence the intensity of the light and consequently have an impact on the BER.
For the scintillation, there are several models available.[25] The most widely used models are the Lognormal distribution model, the K-distribution model, and the Gamma– Gamma distribution model. The Lognormal distribution model is a simple model used to analyze the light scintillation, which is defined as
where I is the irradiance of the light, Ī is the mean of I, and σ s denotes the scintillation index. The K-distribution is defined as

where Γ is the Gamma function, Kt is the modified Bessel function of the second kind, [26, 27] and α is a parameter concerning the effective number of discrete scatters, satisfying α > 0. Here α determines the order of the Bessel function. In Eq. (17), we assume that the light irradiance is proportional to the detector output current. The Kt can be defined as
where It(x) is the modified Bessel function of the first kind. Finally, the Gamma– Gamma distribution is

It can be seen in Eqs. (17) and (19) that these two models share some similarities. Actually, when β = 1, the Gamma– Gamma distribution becomes the K-distribution. The Lognormal distribution generally applies to the conditions of weak fluctauation. When the turbulence turns stronger and different scattering effects occur, the K-distribution finds its application. The Gamma– Gamma distribution is a widely used model in various cases, which connects its paramaters with the propagation channel conditions.
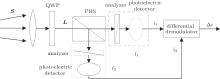
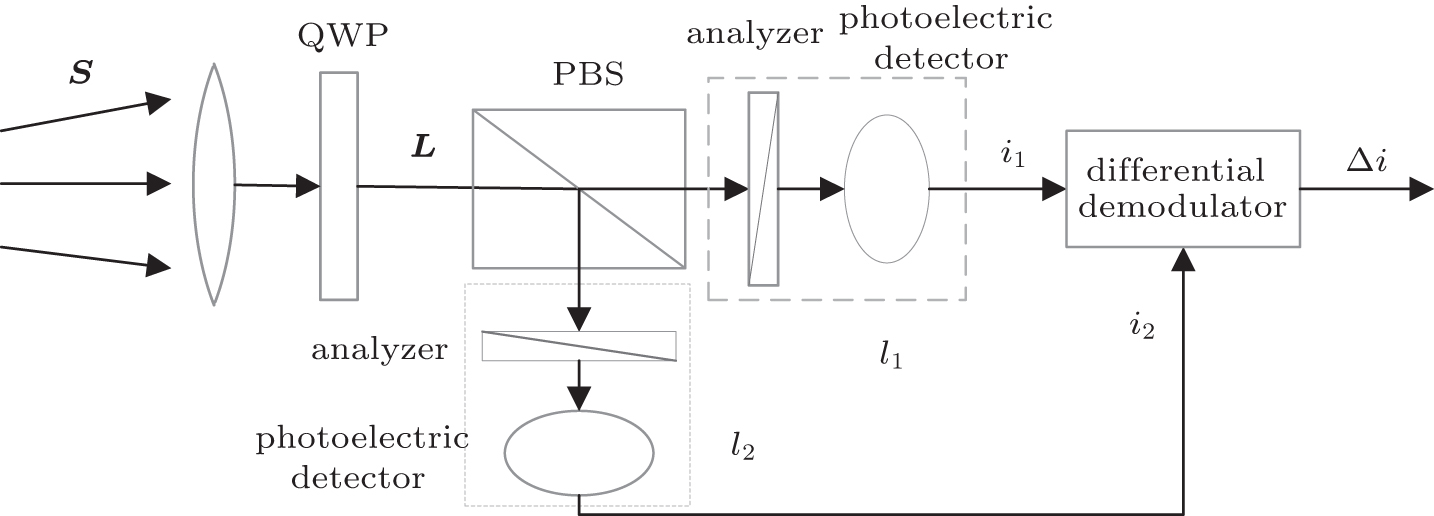 | Fig. 8. Differential detection of circularly polarized signal. |
To calculate the BER, we should know the detection of the circularly polarized signal besides the scintillation model. For the circularly polarized signal detection, the differential detection method is adopted, which is shown in Fig. 8. The circularly polarized signal at the receiver side has the form

where r(t) is the received signal in the binary format and τ ′ is the one-way time delay after the space propagation. Being through a quarter wave plate (QWP), S becomes

where
and JQWP is the Mueller matrix of QWP.[28] Apparently, L is a linearly polarized signal. Then, L passes through a polarization beam splitter (PBS). The PBS aims at separating two orthogonal light components into two independent channels, which are denoted as channels l1 and l2, respectively. For channel l1, we have


Similarly, for channel l2, we have


Thus, with the left-hand polarization state received, 

where is is the current caused by the input light, and in1 and in2 are the detector noises which follow a Gaussian distribution with a zero mean value and a variance of 

By assuming that in1 and in2 are independent, in1 − in2 follows a Gaussian distribution of 

Then, the probability density function of the differential current caused by the left-hand and the right-hand polarization states can be written as
For the left-hand polarization state, the BER is
where erfc is the complementary error function. Similarly, for the right-hand polarization state, there is
Taking the scintillation effect into account, we can define the average bit error rate as
where SNR is the signal-to-noise ratio defined as 
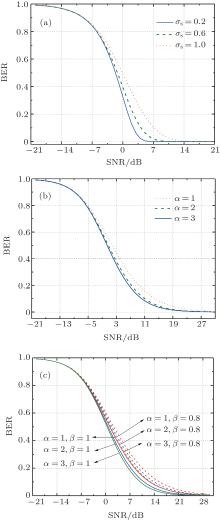
Figure 9 shows the BER calculated under different scintillation models. Apparently, the BER is influenced by both the parameters of the scintillation models and the SNR. For the Lognormal distribution in Fig. 9(a), its performance is influenced by the scintillation index σ s. A smaller σ s leads to a lower BER curve. For the K-distribution in Fig. 9(b), it is influenced by the order of the Bessel function. However, the difference caused by the order is small. For the Gamma– Gamma distribution, there are two key parameters α and β . Different combinations of α and β lead to different BER curves. The Gamma– Gamma model is actually an extension of the K-distribution. When β = 1, the Gamma– Gamma distribution becomes the K-distribution, which can be known from Figs. 9(b) and 9(c). It can be seen from all the figures that a high SNR leads to a low BER, indicating the effects of noise on the BER. It can also be observed that the BER curves share a similar tendency under the same SNR conditions and that there is only a tiny difference between the BER curves of different scintillation models. Because of the complex and changeable deep space circumstances, no model can perfectly describe the scintillation effects. As described in Ref. [25], these models have varying degrees of success. Thus, the scintillation model is generally chosen based on the condition of the propagation channel.
 | Fig. 9. BER under different scintillation models: (a) the Lognormal distribution, (b) the K-distribution, (c) the Gamma-Gamma distribution. |
As discussed in Subsection 2.1, the ranging process is conducted by matching the SN from the downlink with the local SN. Thus, the synchronization process will have an impact on the ranging jitter because the inaccurate synchronization will lead to the time synchronization error for the range measurement.
The synchronization sequence is defined in Eq. (8) and the signal passing through the propagation channel is expressed by Eq. (10). For the synchronization process, the aim is to find k with the maximum value of Rcorr(k), i.e.,

As ξ SS(k) is a random variable, thus κ can be seen as a random variable. Apparently, κ is influenced by the noise of the synchronization sequence. Then, the variance of κ T, 

Because we cannot have an analytical form for Eq. (35), we use the Monte Carlo simulation to analyze the variance of κ and give the relation between the ranging jitter and the SNR.
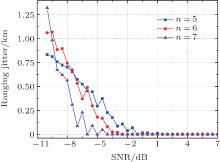
In the simulation, the Monte Carlo method is used to analyze the impact of the synchronization error on the ranging jitter under different SNR levels, and m-sequences of different orders are used. For each SNR, 1000 correlation trials expressed by Eq. (35) are conducted and the variance of κ T is calculated. Based on Eq. (36), the ranging jitter is calculated and presented in Fig. 10. From the figure, we can see that when the SNR is low, the synchronization error causes a large ranging jitter, indicating the impact of the noise on the range measurement. As the SNR increases, the ranging jitter goes down. We can also know that an m-sequence of high order has a better ranging jitter performance. The reason is that the high order m-sequence has a better synchronization performance, which has been demonstrated in the previous sections. It should be noted that under lower SNR, the ranging jitter of the high order m-sequence is larger than that of the lower order one. The reason is that at lower SNR, the noise contributes more to the correlation process of m-sequences with high order than those with the low orders, which influences the in-phase judgment. This is also the reason for the high correlation peak at low SNR in Fig. 6(a).
 | Fig. 10. Ranging jitter. |
For the proposed method, the ranging signal and the communication signal are integrated into a single signal symbol structure. Thus, the impact of the ranging signal on the communication signal mainly lies in the macroscopic aspects, such as the power consumption, the data rate, etc. In the following, we analyze the interference mainly from these aspects.
The power consumption depends on the signal symbol structure. Because of the existence of the synchronization sequence and the SN sequence, the power is not entirely assigned to communication. We define the power efficiency η as the ratio of the power assigned to communication to the total signal power. Based on the signal symbol structure, η can be expressed as

Apparently, large lSN and lSS will decrease the communication power efficiency when the symbol length is fixed. Small lSN will improve the communication power efficiency, but it will in turn decrease the ranging repetition rate and lower the ranging jitter performance.
When it comes to the data rate, we have given an analysis in Subsection 3.1. As indicated in Eq. (6), the SN for the range measurement occupies part of the symbol and the increasing length of SN will decrease the data rate. The length of SN also influences the maximum unambiguous ranging distance. Shorter SN leads to a smaller Rmax, which is indicated in Eq. (7). The interactive influence between different parameters indicates that the signal symbol structure design contributes to the system performance and that the balance of different parameters should be considered.
We have documented the design and analysis of a new simultaneous communication and ranging method for deep space exploration. The proposed method drew inspiration from x-ray communication and utilizes x-ray as the transmission medium. The simultaneous operation is achieved by transmitting the ranging information together with the data with an elaborately designed signal. Compared with the available methods, the proposed method can enhance the link efficiency under changeable space conditions and is helpful for the system miniaturization and integration. In the paper, we presented the principle of the proposed method, and conducted the detailed analysis of its performance, both mathematically and numerically. From the analysis and the corresponding numerical simulations, we knew that the signal acquisition probability is greatly influenced by the level of the noise and that high level noise results in a low acquisition probability. Besides, the bit error rate is influenced by both noise and the choice of the scintillation model, and the scintillation model should be chosen considering the practical conditions. What is more, the ranging jitter is related to the correlation property of the synchronization sequence in the signal symbol and a longer synchronization sequence leads to a better range measure performance. Other characteristics, such as the repetition rate, the data rate, the maximum unambiguous range, the noise effect on synchronization, etc., were also analyzed. From the detailed analysis, we could conclude that the simultaneous communication and ranging method is feasible and that it is suitable for deep space exploration. With the increasing demand for the range measurement and the large volume data transmission, simultaneous communication and ranging would find its application in future deep space exploration.
| 1 |
|
| 2 |
|
| 3 |
|
| 4 |
|
| 5 |
|
| 6 |
|
| 7 |
|
| 8 |
|
| 9 |
|
| 10 |
|
| 11 |
|
| 12 |
|
| 13 |
|
| 14 |
|
| 15 |
|
| 16 |
|
| 17 |
|
| 18 |
|
| 19 |
|
| 20 |
|
| 21 |
|
| 22 |
|
| 23 |
|
| 24 |
|
| 25 |
|
| 26 |
|
| 27 |
|
| 28 |
|