Shangguan Ming-Jia, Xia Hai-Yun†, Dou Xian-Kang, Wang Chong, Qiu Jia-Wei, Zhang Yun-Peng, Shu Zhi-Feng, Xue Xiang-Hui. Comprehensive wind correction for a Rayleigh Doppler lidar from atmospheric temperature and pressure influences and Mie contamination. Chinese Physics B, 24(9): 094212
Permissions
Comprehensive wind correction for a Rayleigh Doppler lidar from atmospheric temperature and pressure influences and Mie contamination
Shangguan Ming-Jiaa), Xia Hai-Yun†a),b),c), Dou Xian-Kanga),b), Wang Chonga), Qiu Jia-Weia), Zhang Yun-Penga), Shu Zhi-Fenga),b), Xue Xiang-Huia),b)
CAS Key Laboratory of Geospace Environment, University of Science and Technology of China, Hefei 230026, China
Mengcheng National Geophysical Observatory, School of Earth and Space Sciences, University of Science and Technology of China, Hefei 230026, China
Collaborative Innovation Center of Astronautical Science and Technology, Harbin Institute of Technology, Harbin 150001, China
*Project supported by the National Natural Science Foundation of China (Grant Nos. 41174131, 41274151, 41304123, 41121003 and 41025016).
Abstract
A correction considering the effects of atmospheric temperature, pressure, and Mie contamination must be performed for wind retrieval from a Rayleigh Doppler lidar (RDL), since the so-called Rayleigh response is directly related to the convolution of the optical transmission of the frequency discriminator and the Rayleigh–Brillouin spectrum of the molecular backscattering. Thus, real-time and on-site profiles of atmospheric pressure, temperature, and aerosols should be provided as inputs to the wind retrieval. Firstly, temperature profiles under 35 km and above the altitude are retrieved, respectively, from a high spectral resolution lidar (HSRL) and a Rayleigh integration lidar (RIL) incorporating to the RDL. Secondly, the pressure profile is taken from the European Center for Medium range Weather Forecast (ECMWF) analysis, while radiosonde data are not available. Thirdly, the Klett–Fernald algorithms are adopted to estimate the Mie and Rayleigh components in the atmospheric backscattering. After that, the backscattering ratio is finally determined in a nonlinear fitting of the transmission of the atmospheric backscattering through the Fabry–Perot interferometer (FPI) to a proposed model. In the validation experiments, wind profiles from the lidar show good agreement with the radiosonde in the overlapping altitude. Finally, a continuous wind observation shows the stability of the correction scheme.
Global wind field measurement is essential for understanding and predicting the future state of the earth– atmosphere system.[1] In the altitude range from the upper troposphere to the stratosphere, where the Mie backscattering signal is usually weak, the Rayleigh Doppler lidar (RDL) is a unique remote sensing instrument with high spatial and temporal resolutions. The so-called double-edge technique is used to determine the Doppler shift from the Rayleigh backscattering signal.[2, 3] Generally, the double-edge technique is implemented by using a twin-channel Fabry– Perot interferometer (FPI) with two opposite transmission slopes at the wings of the atmospheric Rayleigh spectrum symmetrically.[4– 13]
In this work, a triple-channel FPI is used as a frequency discriminator, where the third channel is used to determine the frequency of the outgoing laser relative to the FPI.[10, 11] Since the response function is related to the convolution of the transmission curve of the FPI and the atmospheric Rayleigh– Brillouin Spectrum (RBS), the accuracy of the wind retrieval depends not only on the characteristics of the instrument but also on the precision of the theoretical RBS model. Currently, the Tenti S6 model is a well-recognized RBS model for lidar application, [14] which was recently validated in air in laboratory conditions.[15] For this consideration, parameterization of the Tenti S6 model based on a linear combination of three Gaussian lines[16] or three Voigt-functions[17] are performed by different research groups.
The RBS has three parts: the central Rayleigh scattering and two Brillouin scatterings shifted symmetrically about the outgoing laser. The Rayleigh peak arises from scattering on entropy fluctuations, whereas the shifted peaks (Brillouin doublet) are due to scattering on pressure fluctuations. For the sake of convenience, the RBS from the mid-altitude atmosphere was approximated to have a Gaussian-shaped Rayleigh spectrum in our previous work.[18] In other words, the Brillouin scattering arising from pressure fluctuation was neglected. However, theoretical analysis shows that a correction considering the effects of atmospheric temperature and pressure must be performed for wind retrieval from the Rayleigh Doppler lidar, [19, 20] especially in the altitude from the lower stratosphere to the troposphere.
In the RDL optical receiver, the FPI is optimized for measuring Doppler shift based on the Rayleigh backscattering rather than the Mie backscattering.[11] However, recent volcanic eruptions and high-altitude clouds have resulted in a larger Mie backscattering, which can no longer be treated as a low and stable background.[21]
In our proposed correction scheme, the atmospheric temperature, pressure, and lidar backscattering ratio are obtained with appropriate precision to guarantee the accuracy of wind retrieval.
2. Principle
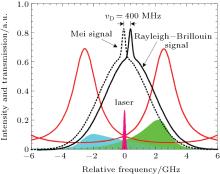
The principle of the double-edge technique used in Rayleigh Doppler lidars has been introduced in detail by several groups.[3, 4, 7, 8, 11] The principle is reviewed briefly here. In this work, the key instrument of a Rayleigh Doppler lidar is a triple-channel Fabry– Perot interferometer. Two channels of the FPI are located symmetrically at the wings of the atmospheric Rayleigh spectrum to determine the Doppler shift, as shown in Fig. 1. Due to the symmetric arrangement of two edge channels, the Doppler shift will increase the transmission through one edge channel but decrease in the other channel, as represented by the difference in the shade areas in Fig. 1. The so-called Rayleigh response function is defined as
where υ D is the Doppler shift, T is the atmospheric temperature P is the atmospheric pressure, and the photon number received on each edge channel is given by
where ai is a calibration constant, i = 1, 2 stands for the left channel and the right channel of the FPI, respectively. The transmission curve of FPI can be written as
where B is the background constant, Tpe is the peak value of the transmission curve, Re is the effective reflectivity, Δ υ FSR is the free spectral range, θ 0 is the half-maximum divergence of the collimated beams to the FPI, υ 0 is the frequency of the outgoing laser, and υ c is the central frequency of the transmission curve. I(υ − υ D, T, P) is the backscattering spectrum of the signal. A good model for I(υ − υ D, T, P) is
where ρ = (β M + β R)/β R is the backscattering ratio, IM(υ ) is the narrow spectrum due to the particles backscattering, which is approximated to the spectrum of the outgoing laser as
where υ L is the full width half maximum (FWHM) of the laser spectrum, and IR(υ − υ D, T, P) is the RBS, which will be introduced in detail.
Fig. 1. Principle of the Rayleigh Doppler wind lidar.
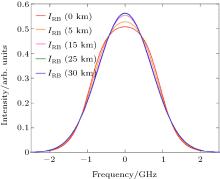
The RBSs calculated using the Tenti S6 model for altitude ranging from the ground to 30 km are presented in Fig. 2. However, the Tenti S6 model without analytical closed form is not convenient to use in a lidar simulation or wind retrieval due to its mathematical complexity. Recently, parameterization of the Tenti S6 model based on a linear combination of three Gaussian lines[16] or three Voigt functions[17] have been performed by different research groups.
Fig. 2. The RBS at different altitudes according to the Tenti S6 model based on the U.S. Standard Atmosphere 1976.
In this work, the Witschas’ s model is adopted and described as follows:
where x is the optical frequency shift and y is the collision frequency. The nondimensional parameters x and y are given by
and the parameters A(y), σ R(y), σ B(y), and xB(y) are determined by fitting the Tenti S6 model with Eq. (6) in a least square fit procedure under atmospheric conditions. These parameters can be written as
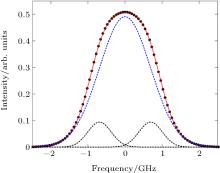
where ω = 2π υ is the angular frequency shift between scattered and incident light, η is the shear viscosity, n is the number density, k = ks − k0 = 4π /λ sin(θ /2) is the magnitude of the interacting wave vector (with k0 and ks being the wave vectors of the incident and scattered light), θ is the scattering angle, and V0 = (kBT/m)(1/2) is the thermal velocity (with kB being the Boltzmann constant and m the molecular mass). In the example given in Fig. 3, the RBS calculated with the Tenti S6 model for 1013 hPa and 288 K is well approximated by the model that we used.
Fig. 3. The RBS calculated with the Tenti S6 model at 1013 hPa and 288 K (black dots). The red line represents the superposition of a central Gaussian line (dashed blue line) and two shifted Gaussian lines (dashed grey line) according to the Witschas’ s model.
3. Correction method
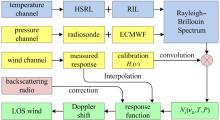
A comprehensive correction scheme is proposed as shown in Fig. 4. Temperature profiles under 35 km and above the altitude are measured from the high spectral resolution lidar (HSRL)[18] and the Rayleigh integration lidar (RIL), [22] respectively. The technique of the RIL has been shown to be capable of obtaining temperature profiles from the stratosphere up to 90 km. Temperature is calculated from the density profiles obtained from the Rayleigh backscatter signal. In addition, the top-to-bottom integration method needs a temperature start value at the top of the profile. However, in the low stratosphere the RIL is perturbed by aerosol contamination and ozone absorption. This is why the recently developed HSRL is adopted to detect temperature under an altitude of 35 km.
Fig. 4. Schematic diagram of how to correct the effects of atmospheric temperature, pressure, and Mie contamination on wind retrieval.
The pressure is taken from the European Center for Medium range Weather Forecast (ECMWF) analysis when radiosonde data are not available. Given the known temperatures and pressures, the RBS is calculated by using the Witschas’ s model according to Eq. (6). Then, using Eq. (2), the RBS is convolved with the transmission curve of the FPI characterized by a proper calibration[11] in order to obtain the photon number. Substituting the photon numbers at different edge channels of the FPI into Eq. (1) results in a theoretical response function that relates the Doppler shift υ D to the Rayleigh response. The actual value of the response is measured from the wind channel for altitude range from 15 to 60 km, and is corrected with the profile of the measured backscattering ratio. To abstract the backscattering ratio, the percentage of the Rayleigh component in the total atmospheric backscattering is estimated in advance using the Klett– Fernald algorithm.[23] After that, the backscattering ratio is determined finally in a nonlinear fitting of the transmission of the atmospheric backscattering through the FPI to a proposed model.
Finally the inversion of Doppler shift υ D with a measured response value is performed by a linear interpolation. Once the Doppler shift is retrieved, the line of sight (LOS) wind speed is calculated as
In order to simultaneously retrieve horizontal winds and temperatures, the RDL consists of three independent lidars. The one points to the zenith for temperature detection, while the other two point toward north and east at a zenith angle of 30° for orthogonal components detection of the horizontal wind.[11] The RIL and HSRL operate alternately with the zenith point.
4. Observation
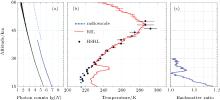
The operation of the Rayleigh Doppler lidar is carried out at Delhi (37.371° N, 97.374° E), in Qinghai province, China. Its location is 2850 m above sea level. An example of typical raw data in the experiment is shown in Fig. 5(a). In order to suppress the statistical standard error, an integration time of half an hour is executed and the available height resolution is rescaled from 200 m (below 40 km) to 1 km (above 20 km), as shown in Fig. 5(a).
Fig. 5. (a) Profiles of backscattering signal. The height resolution of the original signal (black dot) is changed to suppress the statistical standard error (as shown by blue dot). (c) Temperature profiles derived from the Radiosonde (dash line), RIL (solid line), and HSRL (dot). (b) Profile of backscattering ratio.
To validate the performance of the lidar for temperature detection, a comparison experiment was carried out at 6:54 am on 23 December 2013. Temperature profiles derived from HSRL, RI lidar, and radiosonde are plotted in Fig. 5(b). It can be seen that all the results agree with each other in an altitude from 26 to 36 km, with a max deviation of 2.7 K. In the lower altitude, the temperature from the RIL obviously deviates from the results from HSRL and radiosonde with a max value of 22.8 K, which may be due to the Mie contamination (as shown in Fig. 5(c)). This is the reason why temperature values above altitude of 35 km are adopted from the RIL, while under altitude of 35 km are used from the HSRL.
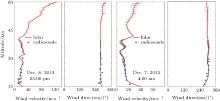
In order to validate the performance of the correction scheme, examples of wind detection in the altitude from 15 to 60 km are present with an error bar in Fig. 6. For accumulation of 6000 shots, the height resolution is switched from 0.2 km to 1 km at an altitude of 40 km. Simultaneous radiosonde results are plotted for comparison. It is obvious that wind observation from these two instruments agree with each other in an altitude range from 15 to 30 km.
Fig. 6. Profiles of wind speed and direction measurements by the lidar (solid line) compared with data from radiosonde (dot).
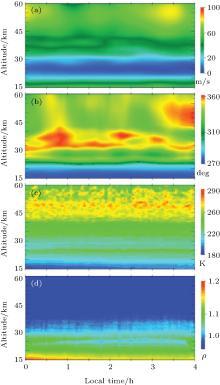
A typical example of continuous wind speed, wind direction, temperature, and backscatter ratio from 15 to 60 km with temporal resolution of two minutes during the night of 7 December 2013 is shown in Fig. 7. During this period, the temperatures are measured by the RIL.
Fig. 7. Continuous observation results of (a) wind speed, (b) wind direction, (c) temperature and (d) backscattering ratio.
5. Conclusion
A comprehensive correction scheme was demonstrated for wind retrieval from the RDL, in which real-time and on-site profiles of atmospheric pressure, temperature, and aerosols were used as the inputs. The RBS was calculated by using an analytical model developed by Witschas’ s model. Comparative experiments and continuous wind field observations verified the stability of the correction scheme. Although recent parameterization of the Tenti S6 model has been done by different groups, the accuracy is still not acceptable in the low troposphere.[24] Thus, new analytical models with appropriate accuracy are under investigation.
... [1] In the altitude range from the upper troposphere to the stratosphere, where the Mie backscattering signal is usually weak, the Rayleigh Doppler lidar (RDL) is a unique remote sensing instrument with high spatial and temporal resolutions ...
1
1998
0.0
0.0
... [2,3] Generally, the double-edge technique is implemented by using a twin-channel Fabry#cod#x2013 ...
2
1999
0.0
0.0
... [2,3] Generally, the double-edge technique is implemented by using a twin-channel Fabry#cod#x2013 ...
... [3,4,7,8,11] The principle is reviewed briefly here ...
2
1999
0.0
0.0
... [4#cod#x2013 ...
... [3,4,7,8,11] The principle is reviewed briefly here ...
1
1999
0.0
0.0
1
2000
0.0
0.0
1
2009
0.0
0.0
... [3,4,7,8,11] The principle is reviewed briefly here ...
1
2009
0.0
0.0
... [3,4,7,8,11] The principle is reviewed briefly here ...
1
2010
0.0
0.0
1
2007
0.0
0.0
... [10,11] Since the response function is related to the convolution of the transmission curve of the FPI and the atmospheric Rayleigh#cod#x2013 ...
5
2012
0.0
0.0
... [10,11] Since the response function is related to the convolution of the transmission curve of the FPI and the atmospheric Rayleigh#cod#x2013 ...
... [11] However, recent volcanic eruptions and high-altitude clouds have resulted in a larger Mie backscattering, which can no longer be treated as a low and stable background ...
... [3,4,7,8,11] The principle is reviewed briefly here ...
... (2), the RBS is convolved with the transmission curve of the FPI characterized by a proper calibration[11] in order to obtain the photon number ...
... [11] The RIL and HSRL operate alternately with the zenith point ...
1
2010
0.0
0.0
1
2012
0.0
0.0
... 13] ...
1
1974
0.0
0.0
... Currently, the Tenti S6 model is a well-recognized RBS model for lidar application,[14] which was recently validated in air in laboratory conditions ...
1
2014
0.0
0.0
... [15] For this consideration, parameterization of the Tenti S6 model based on a linear combination of three Gaussian lines[16] or three Voigt-functions[17] are performed by different research groups ...
2
2011
0.0
0.0
... [15] For this consideration, parameterization of the Tenti S6 model based on a linear combination of three Gaussian lines[16] or three Voigt-functions[17] are performed by different research groups ...
... Recently, parameterization of the Tenti S6 model based on a linear combination of three Gaussian lines[16] or three Voigt functions[17] have been performed by different research groups ...
2
2012
0.0
0.0
... [15] For this consideration, parameterization of the Tenti S6 model based on a linear combination of three Gaussian lines[16] or three Voigt-functions[17] are performed by different research groups ...
... Recently, parameterization of the Tenti S6 model based on a linear combination of three Gaussian lines[16] or three Voigt functions[17] have been performed by different research groups ...
2
2014
0.0
0.0
... [18] In other words, the Brillouin scattering arising from pressure fluctuation was neglected ...
... km and above the altitude are measured from the high spectral resolution lidar (HSRL)[18] and the Rayleigh integration lidar (RIL),[22] respectively ...
1
2008
0.0
0.0
... However, theoretical analysis shows that a correction considering the effects of atmospheric temperature and pressure must be performed for wind retrieval from the Rayleigh Doppler lidar,[19,20] especially in the altitude from the lower stratosphere to the troposphere ...
1
2015
0.0
0.0
... However, theoretical analysis shows that a correction considering the effects of atmospheric temperature and pressure must be performed for wind retrieval from the Rayleigh Doppler lidar,[19,20] especially in the altitude from the lower stratosphere to the troposphere ...
1
2012
0.0
0.0
... [21] ...
1
2004
0.0
0.0
... km and above the altitude are measured from the high spectral resolution lidar (HSRL)[18] and the Rayleigh integration lidar (RIL),[22] respectively ...
1
2007
0.0
0.0
... [23] After that, the backscattering ratio is determined finally in a nonlinear fitting of the transmission of the atmospheric backscattering through the FPI to a proposed model ...
1
2014
0.0
0.0
... [24] Thus, new analytical models with appropriate accuracy are under investigation ...
Comprehensive wind correction for a Rayleigh Doppler lidar from atmospheric temperature and pressure influences and Mie contamination
[Shangguan Ming-Jiaa), Xia Hai-Yun†a),b),c), Dou Xian-Kanga),b), Wang Chonga), Qiu Jia-Weia), Zhang Yun-Penga), Shu Zhi-Fenga),b), Xue Xiang-Huia),b)]


 , Dou Xian-Kang