
Beam propagation method for wide-field nonlinear wave mixing microscope*
[Lv Yong-Ganga) , Ji Zi-Henga) , Yu Wen-Taoa) , Shi Ke-Bin†a), b)  ]
]
]
|
|


†Corresponding author. E-mail: kebinshi@pku.edu.cn
*Project supported by the National Natural Science Foundation of China (Grant Nos. 11174019, 61322509 and 11121091) and the National Basic Research Program of China (Grant No. 2013CB921904).
We develop a nonlinear beam propagation method for signal generation in inhomogeneous medium for wide-field nonlinear wave mixing microscope. Experimental results performed in wide-field coherent anti-Stokes Raman imaging have shown good agreement with the developed theory.
In the past years, diverse nonlinear optical microscopy techniques have been developed for imaging the complex samples to study the artificial and the biological micro-nanostructure. Among all the techniques, wide-field microscopy, such as second harmonic generation (SHG) wide-field microscopy, and coherent anti-Stokes Raman scattering (CARS) wide-field microscopy, has attracted intense interest due to simultaneous large field imaging, fast acquisition rates and relaxed requirements on laser stability.[1, 2] In such coherent wide-field techniques, it is critical that the phase matching should be satisfied over the whole field of view, [3] especially in the scenario where dispersion becomes not negligible. Furthermore, in most cases the specimen are usually inhomogeneous along the laser path. As a result, the imaging may be distorted due to the coherent artifacts caused by phase mismatching and inhomogeneous scattering. Therefore, accurately describing the nonlinear signal generation and propagation in inhomogeneous medium is desired for the wide-field microscopy imaging.
The most common tool to analyze an electromagnetic wave propagating in certain spatial structures is beam propagation method (BPM). It was first introduced by Feit and Fleck to calculate the mode properties of optical fibers in 1978.[4] Various beam propagation methods including fast Fourier transform BPM (FFT-BPM), finite element BPM (FE-BPM), and finite difference BPM (FD-BPM) have been developed to investigate complex photonic structures, such as optical junctions and photonic crystal fibers (PCF).[5– 7] Using these methods, some of the single beam nonlinear effects, such as Kerr nonlinearity, self-steepening and stimulated Raman scattering, were studied when the ultra-short laser pulses propagate in fiber.[8] The behavior of an electromagnetic wave propagation in slant atmospheric turbulence was also investigated by utilizing coherent Gaussian– Schell model beam propagation theory.[9, 10] However, the nonlinear beam propagation under a wave mixing signal generation scheme has not been studied previously. It would be valuable for a variety of nonlinear wave mixing imaging modalities. In this paper, we develop a pseudo-spectral type BPM to describe the coherent nonlinear wave mixing signal generation and propagation. In our method, both nonlinear phase matching and diffraction are considered. The theoretical model has been confirmed by our subsequent experiments.
To carry our theory, here we take CARS process as our example. CARS is essentially a four wave mixing process and has been intensively discussed previously.[11– 13] Let us consider a pump beam and a Stokes beam propagating along the z axis in an arbitrary sample. It is therefore inexplicit to obtain the analytic solutions. As an analogy to split-step Fourier method used in temporal domain to solve nonlinear pulse propagation, [14] here we apply analogous scheme for the spatial domain nonlinear signal generation and propagation by replacing dispersion with diffraction. For the convenience of experimental verification, we assume that the incident laser beams illuminate onto a polystyrene (PS) microsphere suspending in water and generate the CARS signal as shown in Fig. 1. For arbitrary samples, the split-step Fourier method supports a reasonable approximate solution: the spatial region is uniformly separated into n thin slices by n − 1 planes at z = Zk (k = 1, 2, ..., n − 1) (Fig. 1), [14] where the nonlinear signal generation and diffraction can be considered occurring independently. In more detail, the progress from Zk to Zk + 1 can be split into three steps (Fig. 1). In the first half of each slice, from Zk to Zk + 1/2, we only consider the diffraction. In the next step, at the plan z = Zk + 1/2, the nonlinear signal generation acts alone and it generates all the nonlinear signal of the slice. In the third step, in the second half from Zk + 1/2 to Zk + 1, only diffraction is considered again.
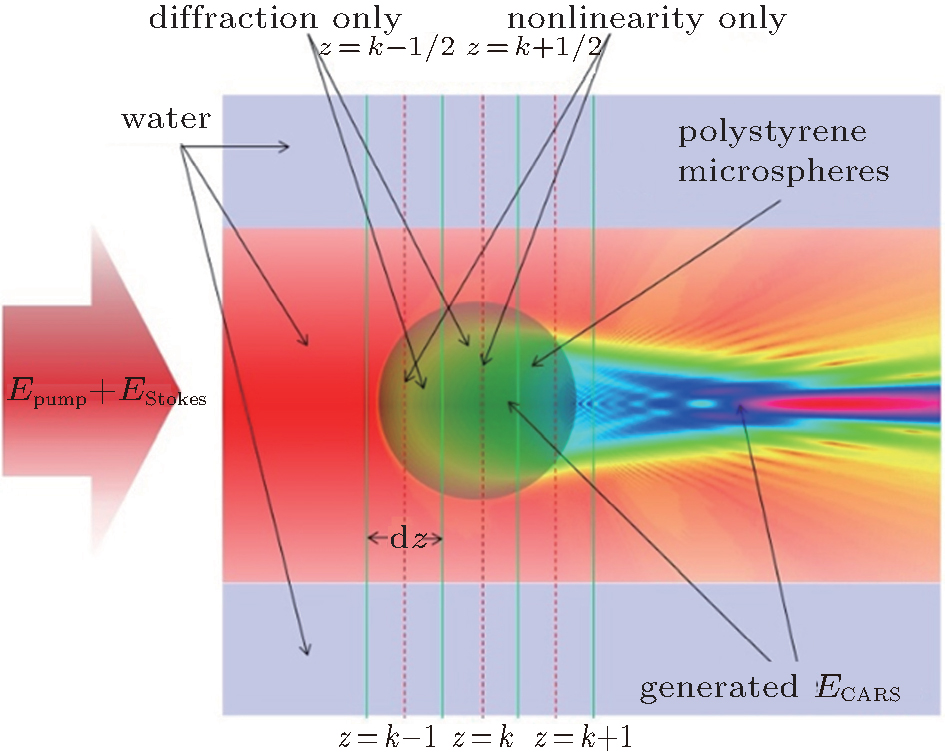 | Fig. 1. Schematic diagram of our method. The pump and the Stokes beams (red) irradiate a PS microsphere suspending in water generating the CARS signal (green to pink). Along the direction of propagation, the whole space is uniformly divided into n parts of length dz. In each slice, the CARS signal generation and propagation are considered separately. Specifically, from Zk to Zk + 1/2 and from Zk + 1/2 to Zk + 1, only diffraction is considered. The nonlinear wave mixing signal only generates at the middle (red dotted line) of the slice. |
Firstly, we consider the diffraction propagation from Zk to Zk + 1/2. The propagation of electromagnetic wave is governed by Helmholtz equation

where E is the electric field, r = (x, y, z), λ is the wavelength in vacuum, and n is the index of the medium. In most experiments, the angle between the incident pump beam and the generated nonlinear signal is limited.[15] In this case, we can adapt paraxial approximation and assume that all the beams propagate along the z axis. Considering the inhomogeneous index, the electric field can be written as

where ρ = (x, y) and A is the amplitude of the electric field. We substitute Eq. (2) to Eq. (1) and ignore ∂ 2A/∂ z2 (the effects of ∂ 2A/∂ z2 are much smaller than other items under paraxial approximation)[16] and define


Equation (1) can be replaced as

Then we represent the amplitude function at z = Zk + 1/2 with Taylor expansion around Zk

Substituting Eq. (4) to Eq. (5), we obtain
Define the operators as
then

Ignoring the higher-order infinitesimal than dz/2, we obtain
where

The subscripts p, s, and a denote pump, Stokes, and anti-Stokes, respectively.
Secondly, we consider the generation of the CARS signal at plan z = Zk + 1/2. The generated CARS field in this slice can be written as[12]

χ (3) is the third-order nonlinear susceptibility. We substitute Eqs. (2) and (10) to Eq. (11) and obtain
Equation (12) indicates that the generated CARS signal depends on two terms
The former is related to the diffraction and the latter responses to the phase matching. The total CARS field will be the addition of the propagated field and the generated field

Because the generated CARS single intensity is much smaller than the pump’ s and the Stokes’ , undissipated excitation is used here and therefore the intensity variation of pump and Stokes beams is not considered in this step.
Thirdly, we obtain the propagated signal by considering the diffraction from Zk + 1/2 to Zk + 1 again

The parameters used in our simulation are: the index of the PS microsphere are ns, ps = 1.5974, np, ps = 1.5982, na, ps = 1.6009; the index of the environment is nwater = 1.3697 (the dispersion of water in infrared spectral region is very small); for simplicity, the third-order nonlinear susceptibility of PS microsphere is set as a constant 

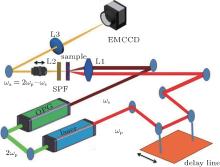
In order to verify the calculated results, a wide-field CARS imaging apparatus was constructed (as shown in Fig. 2). A picosecond laser (Ekspla, PL2210 series) (λ = 1064 nm, repetition rate: 1000 Hz, pulse duration: 25 ps) was employed as a CARS pump. The frequency-doubled output from the laser pumped a tunable optical parametric generator (OPG) (Ekspla, PG500 Series) to produce a Stokes beam. A tunable delay line was used in the pump beam path to ensure the temporal overlapping. Both pump and Stokes beams were weakly focused onto the sample to form a wide field excitation by the lens whose focal length is 200 mm. The angle between the pump and the Stokes beams is about 4.3 degree. A short pass filter (Chroma, HQ950-60) was used to let the CARS signal pass only. The CARS image of the sample was magnified by an imaging system consisting of a long-working-distance objective lens (Edmund) (numerical aperture: 0.42, focal length: 10 mm) and a single lens (focal length: 750 mm), and recorded by an electron multiplying charge-coupled device (EMCCD) camera (Andor, iXon X3) (exposure time: 100 ms, 20 times, EM gain: 100, exposure temperature: − 75 ° C). The long-working-distance objective lens was mounted on a stage which can precisely control the distance between the lens and the sample. In our experiments, the CARS signals at different axial positions were obtained through adjusting this stage. The sample was prepared by sandwiching polystyrene microspheres (Bangs Laboratories, diameter: 10 μ m) (dispersed in water) between a pair of No.1 cover glasses with the edges sealed with high-vacuum grease (DOW CORNING).
 | Fig. 2. Schematic diagram of wide-field CARS device. L1: singlet lens, focal length 200 mm; L2: long working distance objective lens, focal length 10 mm; L3: singlet lens, focal length 750 mm; SPF: short pass filter. |
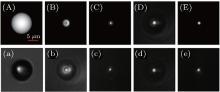
The results of simulation and experiment are shown in Figs. 3(A)– 3(E) and 3(a)– 3(e) respectively. Figure 3(a) is the bright field microscope image of a PS microsphere, from which we can confirm that the diameter of the ball is about 10 μ m. Figure 3(A) shows the calculated results by summing the refractive index along the z axial. Since the refractive index of PS microsphere is larger than that of water, the microsphere in the picture is brighter than ambient. Figure 3(b) is the CARS image at 5 μ m distant from the microsphere. There is a bright speck surrounded by a diffraction ring whose diameter is around 6 μ m. Figure 3(c) is the image at the distance of 10 μ m off the microsphere, from which we can tell that the diffraction ring almost disappears and the bright speck diameter is much smaller than 10 μ m. One may regard this distorted picture as the wide-field CARS image because the diameter is the smallest. When the distant is larger than 10 μ m, the diameter of the CARS speck increases gradually (Figs. 3(d) and 3(e)). Figures 3(B)– 3(E) show the simulation results by our theory, which agree well with the experimental results. These results indicate that this method accurately describes the nonlinear wave mixing signal generation and propagation in space domain.
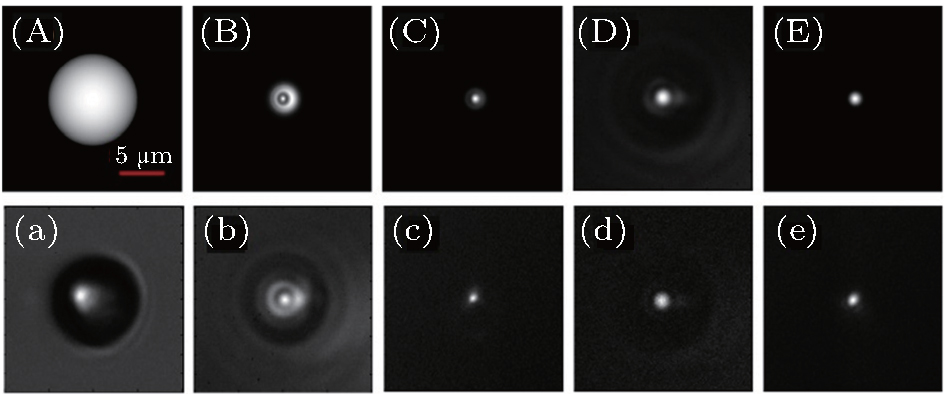 | Fig. 3. Microscopy images of a PS microsphere at different axial positions: (a) the bright field microscope image; (A) the calculated image (by summing the index along the z axial); (b)– (e) the wide-field CARS images at different positions from the microsphere, and the distant are 5 μ m, 10 μ m, 15 μ m, 20 μ m, respectively; (B)– (E) the corresponding simulation results. |
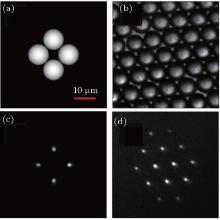
Further experiments also confirm our theory. A more complex sample such as PS microsphere solution droplet dried on the cover slip was prepared. The concentration of the solution is very low, so the microspheres form a monolayer and align closely (Fig. 4(b)). The CARS image recorded experimentally at 20 μ m distant from the microsphere array of this sample is shown in Fig. 4(d). One may be misled that the space between the microspheres is very large and the diameters of them are much smaller than 10 μ m. Figures 4(a) and 4(c) are the simulated bright field image and CARS image at the distance of 20 μ m respectively, which are clearly confirmed by the experiments. For simplicity, we only calculated four microspheres suspending in water to perform our simulation. It indicates that in general the imaging distortion produced by inhomogeneous refractive index distribution in nonlinear wave mixing should be concerned.
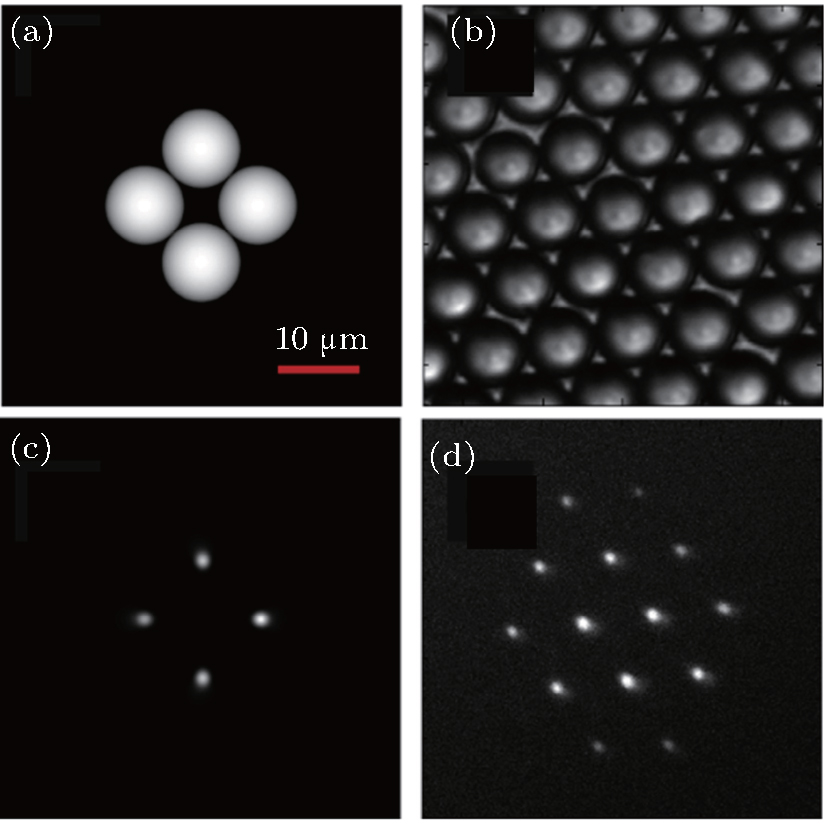 | Fig. 4. (a) and (c) Simulation results for bright field image and CARS image at 20 μ m from the microsphere array respectively; (b) and (d) corresponding experimental confirmations. |
In this paper, we have developed BPM to study the coherent nonlinear wave mixing signal generation and propagation, where both phase matching and diffraction are considered for inhomogeneous sample. Using this method, the generated CARS field distribution of a PS microsphere suspending in water under wide-field irradiation is simulated. The calculation is verified by our subsequent experiments. This result indicates that our method can be applied to simulate the coherent nonlinear signal generation and propagation in inhomogeneous medium. Our experimental results also point out that in the wide-field coherent microscopy, the imaging may be distorted by phase mismatch and diffraction. Although our theory cannot restore the structure of the sample from the distorted image, it can be used to calibrate and verify the structure of the sample under study.
| 1 |
|
| 2 |
|
| 3 |
|
| 4 |
|
| 5 |
|
| 6 |
|
| 7 |
|
| 8 |
|
| 9 |
|
| 10 |
|
| 11 |
|
| 12 |
|
| 13 |
|
| 14 |
|
| 15 |
|
| 16 |
|