Determination of the atomic density of rubidium-87
[Zhao Meng, Zhang Kai, Chen Li-Qing† ]
]
]
|
|


†Corresponding author. E-mail: lqchen@phy.ecnu.edu.cn
*Project supported by the Natural Science Foundation of China (Grant Nos. 11274118 and 11474095), the Innovation Program of Shanghai Municipal Education Commission of China (Grant No. 13ZZ036), and the Fundamental Research Funds for the Central Universities of China.
Atomic density is a basic and important parameter in quantum optics, nonlinear optics, and precision measurement. In the past few decades, several methods have been used to measure atomic density, such as thermionic effect, optical absorption, and resonance fluorescence. The main error of these experiments stemmed from depopulation of the energy level, self-absorption, and the broad bandwidth of the laser. Here we demonstrate the atomic density of87Rb vapor in paraffin coated cell between 297 K and 334 K mainly using fluorescence measurement. Optical pumping, anti-relaxation coating, and absorption compensation approaches are used to decrease measurement error. These measurement methods are suitable for vapor temperature at dozens of degrees. The fitting function for the experimental data of87Rb atomic density is given.
In the last two decades, due to the rapid development of quantum information and precision measurement, [1] many phenomena of quantum optics and nonlinear optics[2, 3] in the alkali atomic ensemble[4– 7] have been brought into focus. The atomic density of the atomic ensemble is important for some phenomena in quantum optics and for the precision of the parameters in a precision measurement; for example, super-radiance, [8] magnetic measurement, [9, 10] and atomic clock.[11, 12] There are mainly two kinds of atomic ensembles. One is the cold atomic ensemble, which is often used in quantum information, [13] but its density number is difficult to improve. The other is the atomic vapor, which is more often used in precision measurement.[1] Many theoretical and experimental approaches have been tried to obtain accurate data of atomic density. Killian[14] measured the vapor pressure of natural rubidium and potassium by thermionic effect between 312 K and 377 K in 1926. Gallagher and Lewist[15] measured the vapor pressure of rubidium-85 by optical absorption at temperatures from 330 K to 370 K in 1973. Fairbank et al.[16] measured the density of sodium vapor at low temperature using resonance fluorescence measurement in 1974. In 1988, van der Spek et al.[17] measured the vapor pressure of natural rubidium between 250 K and 298 K by combined fluorescence and absorption measurements. In these experiments, the main error stemmed from depopulation of the energy level, self-absorption, and broad bandwidth of the laser. In 2013, Tehranchi et al.[18] measured the atomic number density of Rb vapor between 470 K and 550 K using spectral Faraday Rotation measurement, which is more suitable to measure the density at high temperature.
Natural rubidium is a mixture of two isotopes. The 85Rb constitutes 72%, and the remaining 28% is 87Rb. The pure 87Rb atomic vapor is one of the most popular ensembles in quantum information and precision measurement, [1] but until now there are not any experimental reports on its density or vapor pressure. In this paper, we will demonstrate the atomic density of pure 87Rb vapor in the temperature range from 297 K to 334 K, which is often used in experiments.[19] We combine fluorescence measurement, optical pumping, paraffin coating, absorb compensation, and single-photon detection system to reduce the inaccuracy resulting from the self-absorption and depopulation effects. In addition, the laser of 300 kHz narrow bandwidth is used in experiment to avoid the error from the broad-bandwidth laser.
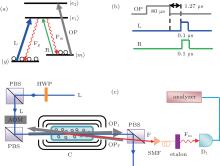
The energy levels of 87Rb atom and time sequence are given in Figs. 1(a) and 1(b) together with laser frequencies. The two higher energy states | e1〉 and | e2〉 are the excited states | 52P1/2, F = 2〉 and | 52P3/2, F = 3〉 . The two lower energy states | g〉 and | m〉 are the hyperfine split ground states | 52S1/2, F = 1, 2〉 with a frequency difference of 6.87 GHz. In our experiment, the atomic density of the pure 87Rb atom is measured mainly using fluorescence method with a narrow-bandwidth laser L. Under the nature state, the atoms populate at | g〉 and | m〉 levels equally. As shown in Fig. 1(b), before the laser pulse L, an optical pumping (OP) pulse which is resonant with the transition from | m〉 to | e2〉 , interacts with the atoms to prepare most atoms on | g〉 state to reduce the absorption of the subsequent fluorescence. After OP pulse, a laser pulse L with width of 100 ns enters the atoms to generate the fluorescence F. The F consists of two kinds of fluorescences Fg and Fm, corresponding to the transitions | e1〉 → | g〉 and | e1〉 → | m〉 , respectively. The laser L is resonant on the transition of | g〉 → | e1〉 .
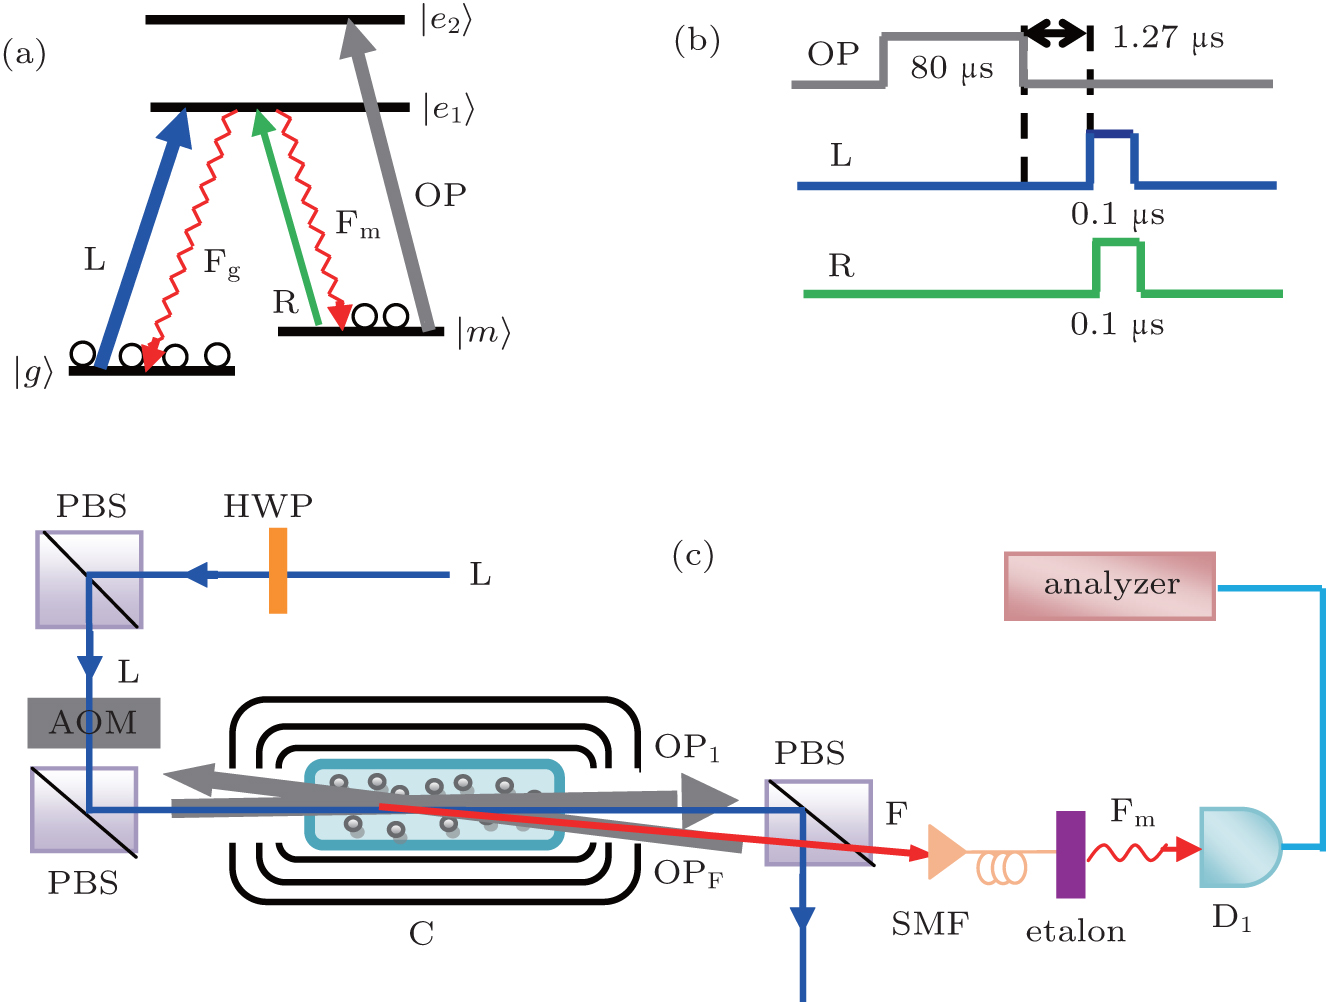 | Fig. 1. (a) Energy levels of 87Rb atom. (b) Time sequence. (c) Experimental layout. C: the pure 87Rb atomic vapor; PBS: polarized beam splitter; HWP: half wave plate; D1: single photon detector; SMF: single mode fiber; AOM: acousto-optical modulator; F: fluorescence; OP1 and OPF: optical pumping lasers. |
The experimental setup is sketched in Fig. 1(c), the paraffin-coated cylindrical Pyrex cell C (50 mm in length, 20 mm in diameter) is filled with 87Rb vapor. The cell is placed inside a four-layer magnetic shield to reduce stray magnetic fields. The cell temperature is limited to below 343 K because of the melting point of paraffin coating. The temperature of the C cell is controlled by using a bifilar resistive heater outside the shield and temperature controller. The precision of temperature controller is 0.1 K, which is enough for our experiment because the atomic density is measured every 1.0 K. The OP and L lasers both come from two independent external cavity diode lasers. The bandwidth of the laser L is 300 kHz, which is much smaller than the Doppler width 0.5– 1.0 GHz. The intensity of OP laser is 240 mW. The intensity of the laser L is about 20 μ W and the diameter is 1.5 mm in the cell C. The intensity of the fluorescence, which is at single photon level, is very low compared with those of OP and L pulses, so some optical filters including polarization filter, spatial filter, and frequency filter, are required. Firstly, the fluorescence photons with random polarization and pulse L with vertical polarization pass through a polarized beam splitter (PBS) together to filter most L photons for polarization filtering. Then, the F and leaking L photons are collected into a single-mode fiber at 2 degree angle for spatially filtering, and are at last sent into an etalon (bandwidth of 12 MHz and fineness of 800) to filter the leaking L photons 29 dB further. The transmission rate of the fluorescence photons is 80%. The frequency of Fg is the same as that of the L photons, so finally only Fm photons can transmit through the etalon. The Fm photons are detected and analyzed by a single-photon detector D1 (PerkinElmer, SPCM-AQRH-14-FC) and single channel analyzer. In experiments, in order to obtain high population rates of the | g〉 state along the light paths of the laser L and F photons at 2 degree angle to reduce the absorption of Fm, the OP pulse is split into two parts, OP1 and OPF, overlapping with L and F. The powers of OP1 and OPF pulses are both equal to 120± 0.2 mW. The population rates of the | m〉 state along two light paths are about 1%– 3% at different temperatures. All of the experimental conditions are fixed when the temperature of the cell is changed.
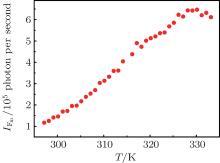
Figure 2 shows the main results of our experiment. The x axis shows the temperature of the cell and the y axis shows the detected intensity of the fluorescence Fm. The intensity of the fluorescence increases monotonically with the temperature from 297 K to 325 K, and then decreases when the temperature continues to increase. This is mainly due to the absorption by | m〉 atoms. In experiment, we can pump most, but not all, atoms on the | g〉 energy level by optical pumping, and the rest atoms still populated at the | m〉 state will absorb the generated fluorescence Fm. The absorption rate has a linear relation with the number of atoms, which increases with temperature, so the absorption rate increases with the cell temperature, especially at higher temperature. From Fig. 2, it is obvious that the absorption by | m〉 atoms has a large effect on the measurement of the atomic density when T is larger than 325 K. In order to obtain accurate data of atomic density as the function of the temperature, the absorption rate should be measured to correct the intensity data of Fm.
 | Fig. 2. Measured intensity of fluorescence Fm as the function of the temperature of the cell C. |
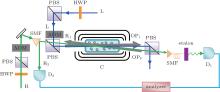
We use another laser beam R with horizontal polarization to simulate fluorescence Fm. The experimental setup is shown in Fig. 3, almost the same as that in Fig. 1(c), except the beam R. The beam R comes from another external-cavity diode laser, whose frequency is the same as that of Fm, and is split into two beams (R1, 2) before entering the cell C. The intensities of R1 and R2 are identical and can be changed by rotating the half waveplate HWP. The R1 beam, spatially overlapping with F, is used to simulate the absorption of Fm. The intensity of R1 beam after the etalon is controlled to be equal to that of Fm at different temperatures. The R2 beam is detected directly by single photon detector D2 (PerkinElmer, SPCM-AQRH-14-FC) as the intensity reference of R1. Dividing the intensity of R1 by that of R2, we can obtain the transmission rate of the R1 photon (η Tran– R1) with horizontal polarization.
 | Fig. 3. Experimental setup for absorption compensation. The diameter of R1 is the same as the detected fluorescence F. When we measure the intensity of Fm, the beam R is blocked. When the intensities of R1 and R2 are measured, the beam L is blocked. |
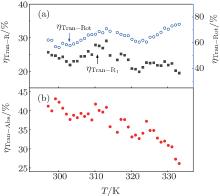
The measured transmission rate of the R1 photon (η Tran– R1) as the function of the cell temperature is shown in Fig. 4(a) (square curve). In general, the transmission rate is larger at lower temperature than that at higher temperature because of the absorption, as analyzed above. Another notable character is the typical oscillation with the temperature, which is due to the optical rotation. In experiment, the R1 beam is linearly polarized and far off-resonant on the transition from | g〉 to | e1〉 . Meanwhile, the atomic vapor is spin polarized (most atoms populate at the | g〉 level). According to the theory of the optical rotation, when linearly polarized laser transmits through the spin-polarized atomic vapor, its plane of polarization will rotate by an angle θ due to the difference in the refraction indices n+ (v) and n− (v), which are experienced by σ + and σ − lights, respectively. After traveling through the atomic vapor with the length l, the rotated angle θ of the polarization can be written as[20]


where λ is the wavelength of the laser, and N is the atomic number in the vapor. In our experiment, the length l and wavelength λ are fixed, so finally

The rotated angle of the R1 polarization is proportional to the atomic number. This is the reason why the R1 intensity after the PBS shows oscillation behavior. Thus, the transmission rate of the R1 beam (η Tran– R1) after the PBS should be written as

where η Tran– Abs is the transmission rate related to the absorption by the | m〉 atoms, η Tran– Rot is the transmission rate related to the rotation effect of the linear polarization. In case of the fluorescence Fm, its polarization is random, so the rotation effect on Fm can be neglected. That is to say, η Tran– Rot ∼ 1. The transmission rate of Fm (η Tran– Fm) should be equal to the value of η Tran– Abs = η Tran– R1/η Tran– Rot. The intensity of the Fm photon in Fig. 2 can be corrected by dividing the factor η Tran– Abs.
 | Fig. 4. (a) Black square: the transmission efficiency of the R1 photon; blue circle: the transmission rate of the R1 photon caused by the polarization rotation effect. (b) Transmission rate of the R1 photon caused by the absorption effect. |
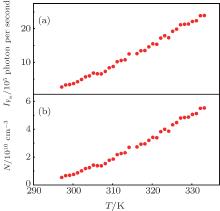
The optical rotation is measured by blocking the laser L in Fig. 3, and the result is given in Fig. 4(a) (circle curve). The frequency of R1 laser is blue detuning 1.5 GHz from the transition | m〉 → | e1〉 to remove the absorption effect. The oscillation in the square curve is similar to that in circle curve. The η Tran– Abs value is calculated and given in Fig. 4(b). The final intensity of Fm photon is corrected and shown in Fig. 5, where its intensity increases with the temperature monotonically.
 | Fig. 5. (a) The final intensity of fluorescence Fm as a function of temperature after absorption compensation. (b) The atomic density of 87Rb as the function of temperature. |
The saturation intensity of the 87Rb D1 line is[21] 4.4876(31) mW/cm2. In our experiment, the intensity of the laser L is smaller than the saturation intensity, so the absorption of the laser L follows Beer– Lambert’ s law

where I0 and I are the intensity before and after the vapor, respectively; l is the distance that the laser travels through the vapor; and, k0 is the absorption coefficient and can be written as[22]
where λ 0 is the wavelength, g1 and g2 are the statistical weights of the lower and upper states, Δ vD is the Doppler width of the absorption line, N is the density number of the vapor, and τ is the lifetime of the upper state. Then the fluorescence intensity If can be written as

where ϕ is the fluorescence quantum efficiency. Thus, the atomic density can be written as

Finally, the experimental atomic density of the 87Rb vapor is shown in Fig. 5(b).
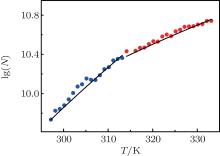
In general, the functions of the atomic density N and vapor pressure p are usually reported in terms of[15]


where the unit of N is cm− 3, p is in torr, and T is in kelvin. The melting point of 87Rb is 312.31 K, we fit the experimental data in Fig. 6 with Eq. (9) in two temperature ranges, corresponding to solid phase (297– 312.31 K) and liquid phase (312.31– 334 K). The fitting results are
for 297– 312.31 K,

for 312.31– 334 K.
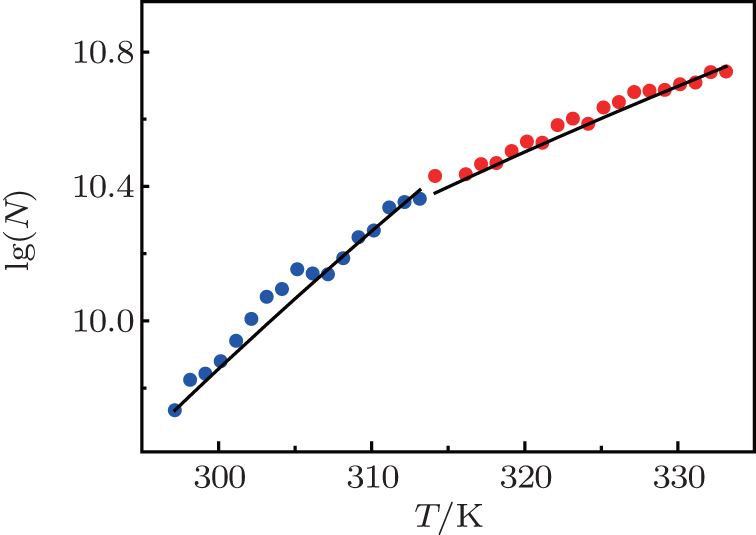 | Fig. 6. Plot of log(N) versus temperature. Square: experimental data. Solid lines: fitting results. |
We experimentally measured the atomic density of the 87Rb vapor in the range of 297– 334 K mainly using fluorescence measurement. The data accuracy was ensured by combination of several approaches including the lasers with narrow bandwidth, the cell with anti-reflection coating (paraffin coating), optical pumping, single-photon detection system, and absorption compensation. The fluorescence method is a sensitive way to measure vapor density. In previous experiments, [14– 17] the main error came from depopulation of the energy level, self-absorption, and broad bandwidth of the laser. In our experiment, the bandwidth of the laser L (300 kHz) is much smaller than the width of Doppler broadening of the 87Rb vapor, so the inaccuracy from the broad-bandwidth effect was eliminated. The strong OP laser prepared most atoms populated on the | g〉 level before the fluorescence measurement, so the self-absorption effect, resulting from the absorption of Fm by the | m〉 atoms, was greatly weakened. The coherent time of the atoms in the paraffin-coated cell (100 milliseconds) is much longer than that in a normal cell, and the depopulation effect was reduced. The single-photon detection system, especially with three kinds of filters, was used to decrease the noise from the leaking L and OP lasers in fluorescence measurement. The self-absorption from rest | m〉 atoms was calibrated by the absorption compensation. Finally, there are some residual 85Rb atoms in the 87Rb vapor, which contributed about 3%– 5% error to the data of atomic density.
| 1 |
|
| 2 |
|
| 3 |
|
| 4 |
|
| 5 |
|
| 6 |
|
| 7 |
|
| 8 |
|
| 9 |
|
| 10 |
|
| 11 |
|
| 12 |
|
| 13 |
|
| 14 |
|
| 15 |
|
| 16 |
|
| 17 |
|
| 18 |
|
| 19 |
|
| 20 |
|
| 21 |
|
| 22 |
|