Lu Xiao-Gang, Miao Xing-Xu, Bai Jin-Hai, Yuan Yuan, Wu Ling-An, Fu Pan-Ming, Wang Ru-Quan†, Zuo Zhan-Chun‡. Crossover between electromagnetically induced transparency and Autler–Townes splitting with dispersion. Chinese Physics B, 24(9): 094204
Permissions
Crossover between electromagnetically induced transparency and Autler–Townes splitting with dispersion
Lu Xiao-Ganga), Miao Xing-Xua), Bai Jin-Haia), Yuan Yuana),b), Wu Ling-Ana), Fu Pan-Minga), Wang Ru-Quan†a), Zuo Zhan-Chun‡a)
Laboratory of Optical Physics, Beijing National Laboratory for Condensed Matter Physics, Institute of Physics, Chinese Academy of Sciences, Beijing 100190, China
Hebei Normal University, Shijiazhuang 050018, China
*Project supported by the National Basic Research Program of China (Grant Nos. 2013CB922002 and 2010CB922904) and the National Natural Science Foundation of China (Grant Nos. 11274376, 61308011, and 11474347).
Abstract
Based on Akaike’s information criterion (AIC) for a coherently driven ensemble of cold rubidium atoms, we study the crossover between electromagnetically induced transparency (EIT) and Autler–Townes (AT) splitting from the dispersion as well as the absorption viewpoint. We find that the dispersion signal is more sensitive than the absorption signal, showing more pronounced features in the Akaike per-point weights spectrum, which provides a cleaner way of discerning EIT from AT splitting.
During the last two decades, much attention has been paid to the study of electromagnetically induced transparency (EIT)[1– 3] due to its interesting nonlinear optical and quantum coherent properties. The EIT phenomena in three-level or four-level systems look “ dark” to the probe light except at the center of the absorption line where there is a transparent window. This is conventionally considered to be the result of quantum Fano interference[4] between two different transition paths. Recently, we provided an alternative interpretation based on resonant stimulated Raman gain and loss spectroscopy.[5] Specifically, the transparency window in the EIT resonance induced by the suppression of linear absorption by the Raman gain was demonstrated. Generally, EIT is typified by a transparency window in the absorption center of the transmitted light. Due to the Kramers– Kronig relations, the EIT also causes a steep dispersion signal so that it can be applied to slow light[6, 7] or to stored light.[8, 9]
Similar to EIT, Autler– Townes (AT) splitting[10] also exhibits absorption line splitting into a doublet Lorentzian line shape, when one of the two levels involves a strong coupling transition to a third level, but it is not identical to quantum Fano interference. In the other words, EIT can be explained as AT splitting accompanied by Fano interference.
Recently, the relation between EIT and AT splitting has been reconsidered by many authors.[11– 13] By studying the relationship between them in a cascade three-level Doppler-broadened system, our group found that the macroscopic polarization interference plays an important role in discriminating the spectra of the EIT and AT splitting.[13] Another surprising thing is that the absorption spectra are separated into the AT splitting and EIT regimes because there exists a threshold for the coupling field strength. In AT splitting regimes, the absorption spectrum consists of the superposition of two well-separated profiles, which are both Lorentzian curves with similar widths. By contrast, in the EIT region, the absorption spectrum can be considered as the difference between two Lorentzian profiles with coincident centre frequency, but different widths (one is broad and the other is narrow). Using this theory, Anisimov et al.[14] proposed a method based on Akaike’ s information criterion (AIC) to describe the transition from AT splitting to EIT as the control field power decreases. An experimental demonstration based on this method was performed by Giner et al.[15]
To investigate the underlying physics of the existence of the threshold, we studied the the separation of EIT and AT splitting from the time-domain viewpoint by examining the Rabi oscillation of the populations between coupled states, and found that, in the EIT resonance, the transparency window is derived from the gain of a four-wave mixing (FWM) process.[16] In this paper we describe another experiment similar to that of Ref. [14] to calculate the AIC value for models of EIT and AT splitting with increasing coupling power. However, we not only investigate the weight of the AIC value for the absorption signal, but also for the dispersion signal to examine in detail the crossover between EIT and AT splitting. We find that the sensitivity and intensity of the dispersion data are more pronounced than the absorption results.
2. Theory
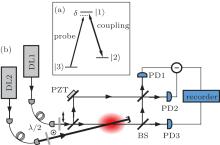
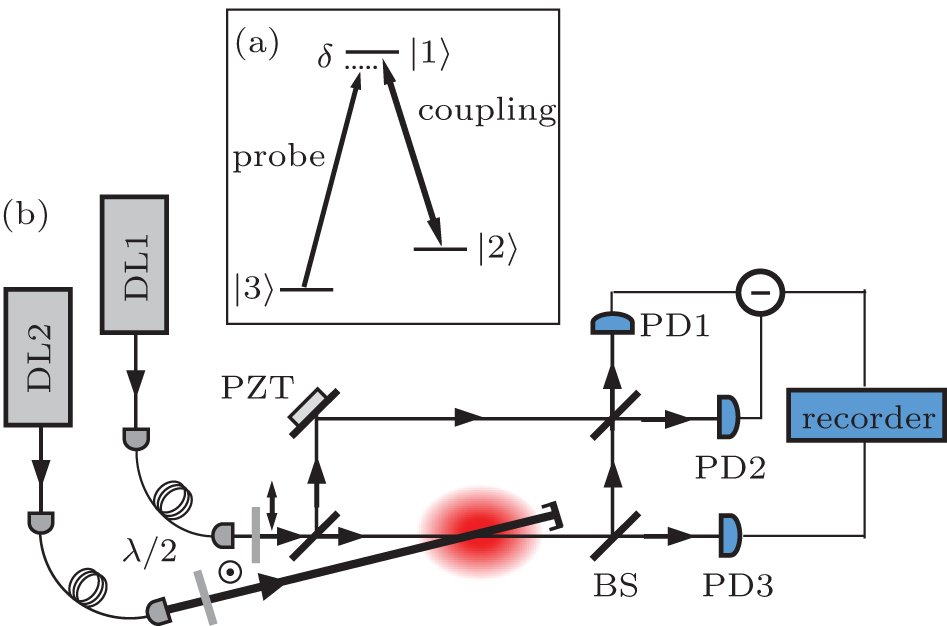
We first consider a Λ -type three-level system (Fig. 1(a)), where the states between | 0⟩ and | 1⟩ are coupled by dipolar transitions with resonant frequencies Ω 10 and dipole moment matrix elements μ 1, and the states between | 1⟩ and | 2⟩ correspond to Ω 20 and μ 2. A strong coupling field of frequency ω 2 resonantly couples to the transition | 1⟩ – | 2⟩ , while a weak probe field of frequency ω 1 is applied to the transition | 0⟩ – | 1⟩ . The detunings are represented by Δ 1 = Ω 10 − ω 1 and Δ 2 = Ω 20 − ω 2. Furthermore, we define the following parameter: δ = Δ 1 − Δ 2, then the polarization responsible for the EIT resonance is given by[3, 11]
Here Ω i = μ iEi/ħ is the coupling coefficients, E1 and E2 are the complex fields representing the incident probe and coupling field, respectively, Γ ij is the transverse relaxation rate between states | i⟩ and | j⟩ , and N is the atomic density. For discussion purposes, we define Ω = Ω 2.
Fig. 1. (a) Diagram of energy level. (b) Diagram of experimental setup. DL1, DL2: diode lasers; λ /2: half-wave plate; PZT: mirror on a piezoceramic; BS: 50/50 beam splitter; PD1, PD2, and PD3: photodiode.
Let us consider the case when Δ 2 = 0. Since the nonlinear polarization P has two poles,
P can be regarded as a superposition of two resonances, that is,
Here,
With the atomic susceptibility χ = P/ε 0E1, we can obtain the absorption signal (Im(χ )) and dispersion signal (Re(χ )) of the transmitted light.
When the coupling field is strong, i.e., | Ω | ≫ (Γ 10 − Γ 20)/2, the absorption signal AATS and dispersion signal DATS are, respectively,
Here,
and C1, C2, D1, D2, D3 are parameters related to the amplitudes of the signal.[14] The two equations correspond to the case of AT splitting, and contain the superposition of two well-separated Lorentzian profiles with similar widths for the absorption and the sum of two dispersive profiles for the dispersion.
Now let us consider the limit of a weak coupling field, i.e., | Ω | ≪ Γ 10/2. In this case, we obtain the following absorption signal AEIT and dispersion signal DEIT:
Here,
and C+ , C− , D+ , and D− are parameters related to the amplitudes of the signal. These equations correspond to the case of EIT resonance, and the absorption signal is derived from the difference between two Lorentzian profiles with coincident centre frequency but different widths, while the dispersion signal is related to the difference between two dispersive profiles.
Various parameters introduced in Eqs. (3)– (6) can be calculated from Eq. (1) for a Λ -type system. In our experimental system, by adjusting the parameters above and using the four functions AEIT, DEIT and AATS, DATS to fit the experimental data of absorption and dispersion, respectively, we can analyze which model is more likely for the experimental data according to the theory of Ref. [14].
3. Experimental details
To verify our analysis, we carried out an experiment in a magneto-optical trap (MOT) of 87Rb (Fig. 1(b)), produced in a glass vacuum chamber pumped down to a pressure of 10− 9 torr. The wavelength of the cooling and repumping laser is 780 nm, corresponding to the 87Rb D2 line. The gradient of the magnetic field for the MOT is about 10 Gauss/cm. In the MOT, the trapped 87Rb atomic ensemble is 2 mm in diameter, and the number of atoms is about 2 × 10⁸. The probe and coupling fields are provided by two independent 795-nm diode lasers (DL1 and DL2) with linewidth of approximately 200 kHz. The beams from the probe and coupling lasers are orthogonally polarized and overlapped on the trapped 87Rb cloud with an angle ∼ 8° between them. The beam diameter of the probe laser, of intensity 1 μ W, is approximately 1 mm. On the other hand, the beam diameter of the coupling laser is about 3 mm. The probe and coupling beams couple the D1 transition of 87Rb from the hyperfine states 52S1/2F = 1 (| 0⟩ ) and 52S1/2F = 2 (| 2⟩ ) to the state 52P1/2F = 1 (| 1⟩ ), respectively.
For completeness, we measured both the absorption and dispersion of the probe beam by an Mach– Zehnder interferometer.[17] A homodyne arrangement which includes a 50/50 output beamsplitter (BS) and photodiode detectors PD1 and PD2 was used to detect the small phase shift due to the trapped atomic cloud. Another detector, D3, was used to measure the absorption coefficient. Each experimental run lasted for 100 ms. During each measurement cycle when the resonant coupling laser was turned on for 3 ms, the magnetic gradient field and trapping beams were all switched off. Then the magnetic field and trapping beams were switched on to rebuild the MOT during the remaining 97 ms. The probe laser was turned on 50 μ s later than the coupling laser for optical pumping of the atoms back to the ground state 52S1/2F = 1 (| 0⟩ ) and then scanning across the F = 1 → F′ = 1 transition within 2 ms.
4. Results and discussion
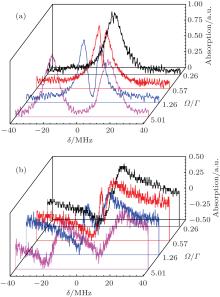
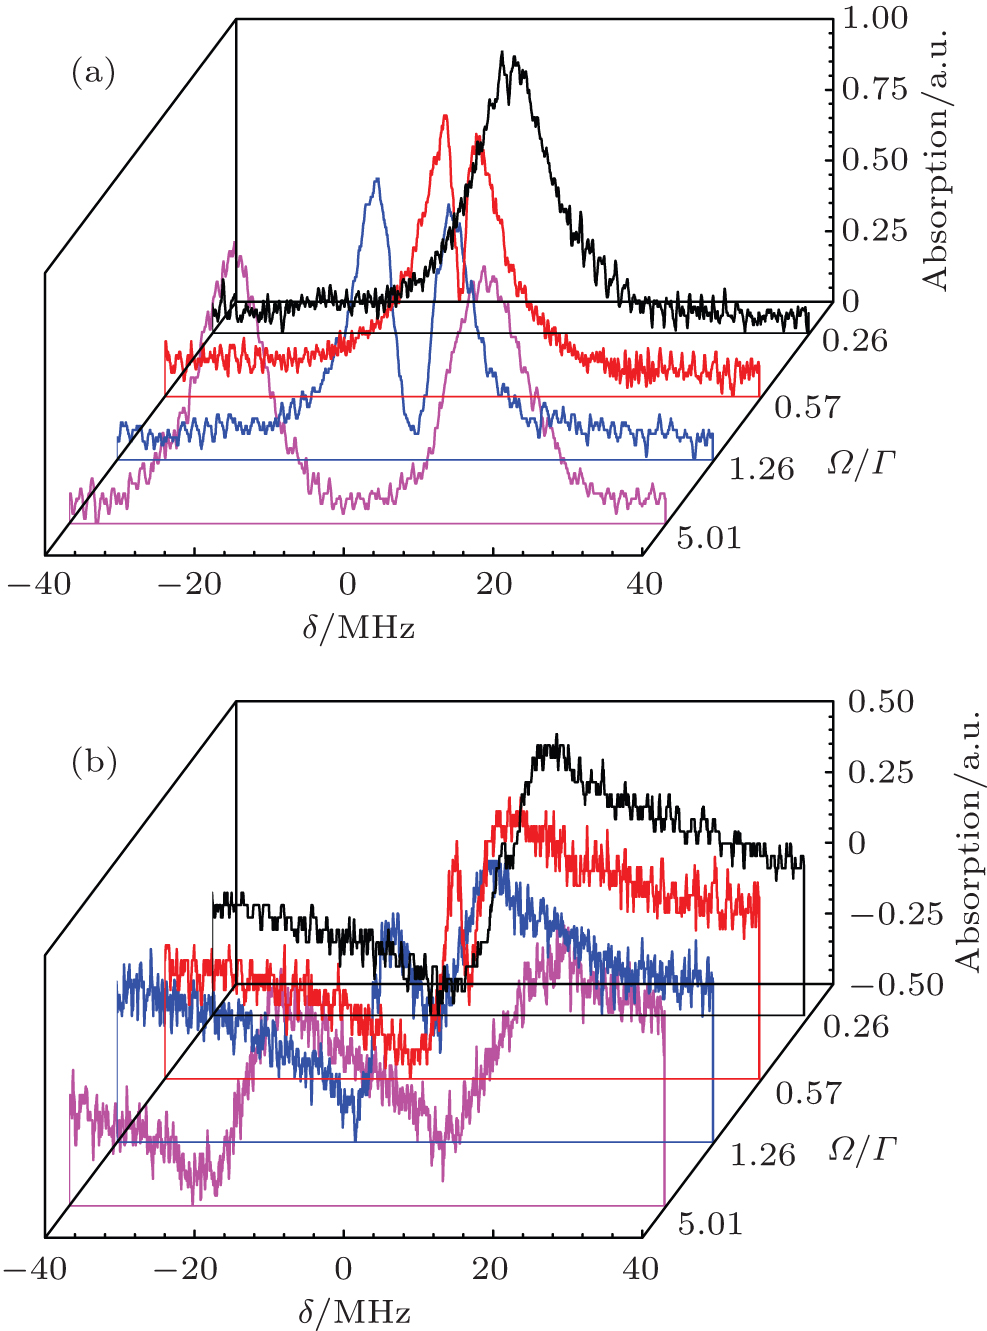
Figure 2 shows the experimentally measured absorption and dispersion of the probe laser. The intensity of the probe signal is a function of its detuning δ from resonance for different values of the coupling beam power (10 μ W to 20 mW), i.e., for different values of the coupling Rabi frequency Ω , which changes from very weak (black curve at the back) to five times the natural linewidth Γ (purple curve at the front). The natural linewidth of the D1 line is about 5.75 MHz. As can be seen from Fig. 2(a), the narrow transparency dip appearing at low Rabi frequencies widens when the Rabi frequency increases, finally evolving into two well-separated resonances corresponding to the two excited dressed states. Figure 2(b) is the dispersion curve corresponding to the absorption in Fig. 2(a).
Fig. 2. Absorption (a) and dispersion (b) profiles of a Λ -type Rb atom system versus detuning δ for coupling beam Rabi frequencies Ω /Γ of 0.26, 0.57, 1.36, and 5.01, respectively, where Γ is the natural linewidth.
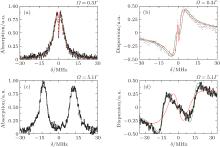
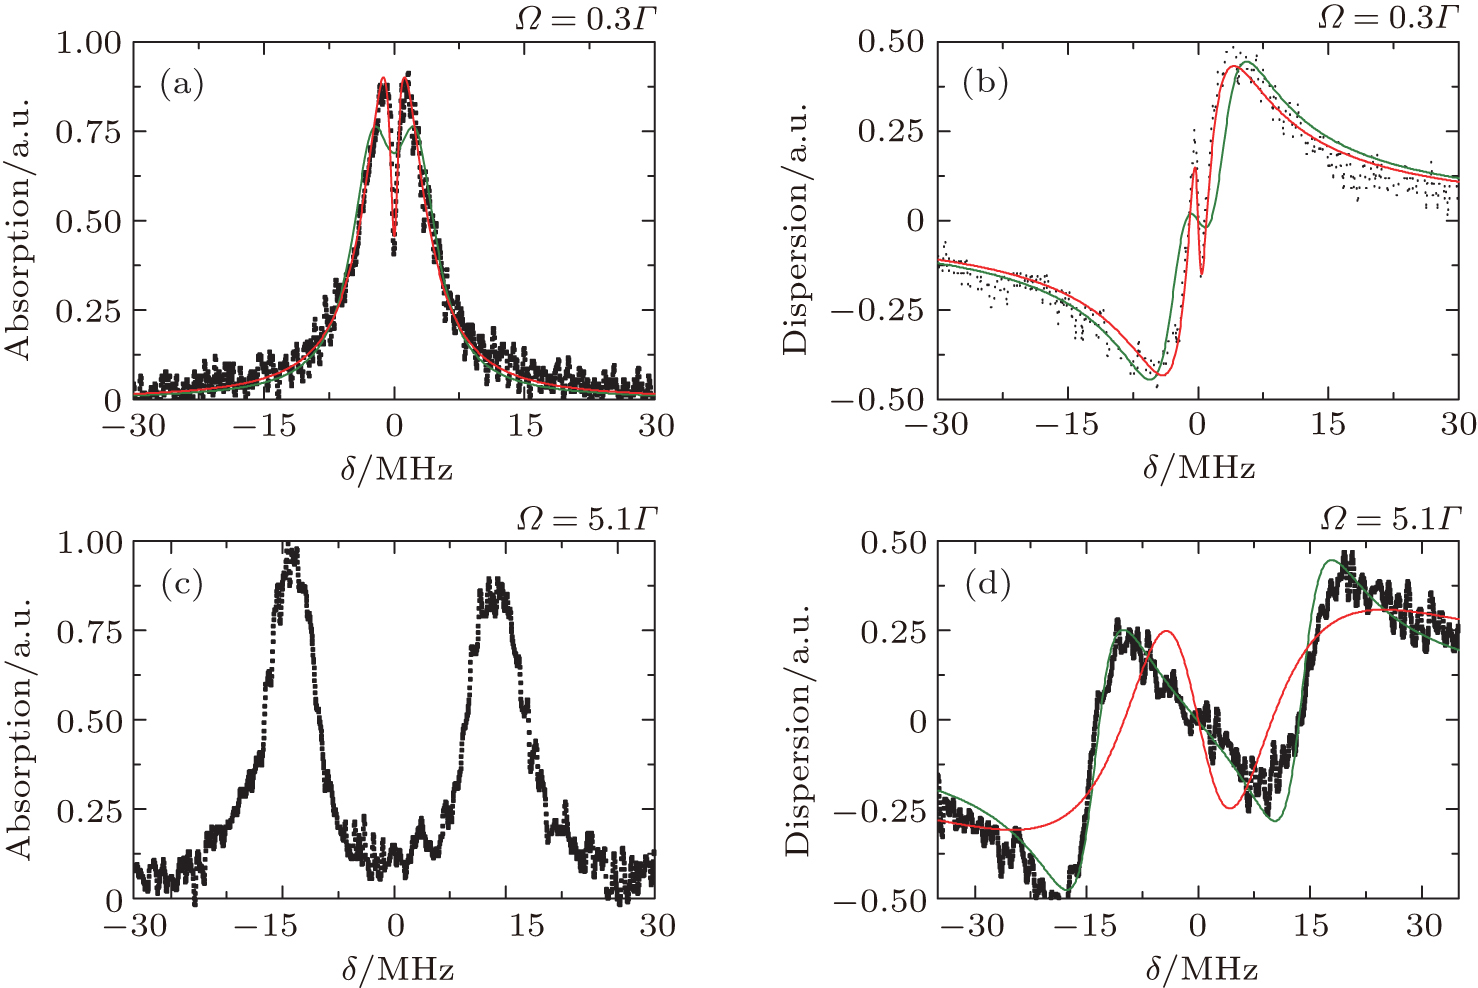
As is shown in Fig. 3, the measured probe absorption and dispersion manifest distinctive profiles at different values of Ω (black dots) together with the fits to AEIT(C+ , C− , Γ + , Γ − ), DEIT(D+ , D− , Γ + , Γ − ) (red solid lines) and AATS(C1, C2, Γ , δ 0), DATS(D1, D2, D3, Γ , δ 0) (green solid lines). A low value of the coupling Rabi frequency, Ω = 0.3 Γ , is shown in Figs. 3(a) and 3(b). By comparison, a larger value, Ω = 5.1Γ , is shown in Figs. 3(c) and 3(d). Parameters C+ , C− , D+ , D− , and C1, C2, D1, D2, D3 representing the amplitudes of the absorption and dispersion curves, respectively, are in arbitrary units, while the parameters Γ + , Γ − , Γ , and δ 0 representing the widths and detuning are in MHz. Figures 3(a) and 3(b) show that the fitted results with AEIT(14.27, 0.25, 3.51, 0.60) and DEIT(3.68, 0.36, 3.51, 0.60) agree with the experimental data much better than those with AATS(5.05, 5.05, 2.89, 2.51) and DATS(1.82, − 6.07, 6.07, 2.89, 2.51). In comparison, figures 3(c) and 3(d) show that the fitted results with AATS(14.19, 14.55, 3.94, 13.85) and DATS(2.98, − 42.04, 42.04, 3.94, 13.85) agree much better with the experimental data than those with AEIT(6.10 × 10³, 5.84 × 10³, 10.82, 10.59) and DEIT(5.60 × 10², 5.47 × 10², 10.82, 10.59). As expected, the EIT model gives a better fitting for the low-power coupling field region (Figs. 3(a) and 3(b)) while the ATS model is better for strong coupling fields (Figs. 3(c) and 3(d)). In addition, the differences between the EIT and ATS models are more pronounced in the dispersion than in the absorption signal.
Fig. 3. Fitting of the absorption ((a), (c)) and dispersion ((b), (d)) models for two values of the coupling Rabi frequency Ω (0.3 Γ and 5.1 Γ ). Experimental data (black dots) are presented together with the best fitted results of functions AEIT and DEIT (red solid lines), and AATS and DEIT (green solid lines). As AEIT is not well suited for fitting experimental data, we obtain results which are unreasonable in reality (red solid line in panel (c)).
As proposed in Ref. [14], we employ the NonLinear-ModelFit function in a Mathematica program to calculate the Akaike’ s information criterion, which specifies the amount of information lost when a model is used to fit experimental data: Ij = 2k − ln(Lj), where k is the number of fitted parameters and Lj is the maximum of the likelihood function obtained from the model under consideration, indicated here by j (j = EIT or ATS). Then we can calculate the Akaike weight (the relative likelihood of a given model compared with all the other models), and find that the mean per-point weights ω EIT and ω ATS are given by
With these equations we calculate the mean per-point weights for the absorption and dispersion signals, and plot them as a function of Ω /Γ in Fig. 4.
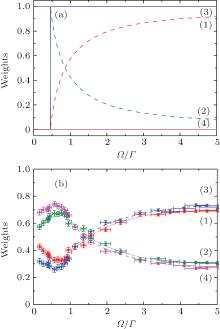
Fig. 4. (a) Theoretical per-point Akaike weights as a function of Rabi frequency Ω /Γ . Absorption ATS model: red dashed curve (1), and EIT model: green dashed curve (2). Dispersion ATS model: blue solid line (3), and EIT model: purple solid line (4). (b) Experimental per-point Akaike weights as a function of Rabi frequency Ω /Γ . (1) Red squares: absorption ATS model; (2) green triangles: absorption EIT model; (3) blue diamonds: dispersion ATS model; (4) purple dots: dispersion EIT model. Error bars include the uncertainty on the parameters and on the measured power.
We can see from the theoretical curves (Fig. 4(a)) that when the value of Ω /Γ is less than 0.45, there is no apparent difference between the results for absorption and dispersion, which is consistent with our discussion above. However, when the value of Ω /Γ is greater than 0.45, the results for the dispersion and absorption curves are significantly different. As Ω /Γ increases, the per-point Akaike weights for the dispersion increase quickly to 1, while those for the absorption increase very slowly, with a maximum value of about 0.9, somewhat short of 1.
There are slight differences between the two group parameters (C1, C2, and D1, D2, D3). The C1 and C2 in Eq. (3) are defined as
Both C1 and C2 contain δ , but the two parameters are treated as constants when we fit experimental data with Eq. (3). However, by comparison, D1, D2, and D3 are defined as
These three parameters do not contain δ . Therefore, on adopting Eq. (3) for the absorption to fit the data, the fitting parameters C1 and C2 include the detuning variable δ which should not be ignored, so the fitting results will not be precise. On the other hand, when we adopt Eq. (4) for the dispersion, the fitting parameters D1, D2, and D3 are pure constants, so the weights more truly reflect the actual physical characteristics. Therefore, when using the method of Ref. [14] to distinguish between EIT and AT splitting, dispersion is better than absorption.
The per-point weights determined from the experimental data as a function of Ω /Γ are presented in Fig. 4(b). The green triangle and red square dots are per-point weights of the EIT and ATS models for absorption, while the purple circular and blue diamond dots are the weights of the EIT and ATS models for dispersion, respectively. We find that the per-point weights all have a similar trend and there is a crossover region from the EIT to the ATS model near Ω /Γ = 1.5, but in the dispersion case the per-point weights are more pronounced and vary more sensitively.
5. Conclusion
In conclusion, we have investigated the crossover between EIT and AT splitting not only in the absorption but also in the dispersion signal. Experiments have been performed with cold rubidium atoms, where both the absorption and dispersion signal are measured. By calculating the AIC values of the absorption or/and dispersion spectra, EIT can be discriminated from AT splitting. More importantly, the features in the dispersion signal are cleaner than in the absorption case, which provides a clearer way to discern EIT from AT splitting.
... IntroductionDuring the last two decades, much attention has been paid to the study of electromagnetically induced transparency (EIT)[1#cod#x2013 ...
1
1997
0.0
0.0
2
2005
0.0
0.0
... 3] due to its interesting nonlinear optical and quantum coherent properties ...
... 2, then the polarization responsible for the EIT resonance is given by[3,11] ...
1
1989
0.0
0.0
... This is conventionally considered to be the result of quantum Fano interference[4] between two different transition paths ...
1
2013
0.0
0.0
... [5] Specifically, the transparency window in the EIT resonance induced by the suppression of linear absorption by the Raman gain was demonstrated ...
1
2000
0.0
0.0
... Kronig relations, the EIT also causes a steep dispersion signal so that it can be applied to slow light[6,7] or to stored light ...
1
2002
0.0
0.0
... Kronig relations, the EIT also causes a steep dispersion signal so that it can be applied to slow light[6,7] or to stored light ...
1
2001
0.0
0.0
... [8,9] ...
1
2001
0.0
0.0
... [8,9] ...
1
1955
0.0
0.0
... Townes (AT) splitting[10] also exhibits absorption line splitting into a doublet Lorentzian line shape, when one of the two levels involves a strong coupling transition to a third level, but it is not identical to quantum Fano interference ...
2
2008
0.0
0.0
... [11#cod#x2013 ...
... 2, then the polarization responsible for the EIT resonance is given by[3,11] ...
1
2010
0.0
0.0
2
0.0
0.0
... 13] By studying the relationship between them in a cascade three-level Doppler-broadened system, our group found that the macroscopic polarization interference plays an important role in discriminating the spectra of the EIT and AT splitting ...
... [13] Another surprising thing is that the absorption spectra are separated into the AT splitting and EIT regimes because there exists a threshold for the coupling field strength ...
6
2011
0.0
0.0
... [14] proposed a method based on Akaike#cod#x2019 ...
... [14] to calculate the AIC value for models of EIT and AT splitting with increasing coupling power ...
... [14] The two equations correspond to the case of AT splitting, and contain the superposition of two well-separated Lorentzian profiles with similar widths for the absorption and the sum of two dispersive profiles for the dispersion ...
... [14] ...
... [14], we employ the NonLinear-ModelFit function in a Mathematica program to calculate the Akaike#cod#x2019 ...
... [14] to distinguish between EIT and AT splitting, dispersion is better than absorption ...
1
2013
0.0
0.0
... [15] ...
1
2015
0.0
0.0
... [16] In this paper we describe another experiment similar to that of Ref ...
1
1978
0.0
0.0
... [17] A homodyne arrangement which includes a 50/50 output beamsplitter (BS) and photodiode detectors PD1 and PD2 was used to detect the small phase shift due to the trapped atomic cloud ...
Crossover between electromagnetically induced transparency and Autler–Townes splitting with dispersion
[Lu Xiao-Ganga), Miao Xing-Xua), Bai Jin-Haia), Yuan Yuana),b), Wu Ling-Ana), Fu Pan-Minga), Wang Ru-Quan†a), Zuo Zhan-Chun‡a)]


 , Zuo Zhan-Chun‡