


Coupled thermal-optic effects and electrical modulation mechanism of birefringence crystal with Gaussian laser incidence
[Zhou Ji† , He Zhi-Hong, Ma Yu, Dong Shi-Kui]
, He Zhi-Hong, Ma Yu, Dong Shi-Kui]
|
|


†Corresponding author. E-mail: zhouji174@163.com
‡Corresponding author. E-mail: dongsk@hit.edu.cn
*Project supported by the National Natural Science Foundation of China (Grant No. 51176039).
We study the Gaussian laser transmission in lithium niobate crystal (LiNbO3) by using the finite element method to solve the electromagnetic field’s frequency domain equation and energy equation. The heat generated is identified by calculating the transmission loss of the electromagnetic wave in the birefringence crystal, and the calculated value of the heat generated is substituted into the energy equation. The electromagnetic wave’s energy losses induced by its multiple refractions and reflections along with the resulting physical property changes of the lithium niobate crystal are considered. Influences of ambient temperature and heat transfer coefficient on refraction and walk-off angles of O-ray and E-ray in the cases of different incident powers and crystal thicknesses are analyzed. The E-ray electrical modulation instances, in which the polarized light waveform is adjusted to the rated condition via an applied electrical field in the cases of different ambient temperatures and heat transfer coefficients, are provided to conclude that there is a correlation between ambient temperature and applied electrical field intensity and a correlation between surface heat transfer coefficient and applied electrical field intensity. The applicable electrical modulation ranges without crystal breakdown are proposed. The study shows that the electrical field-adjustable heat transfer coefficient range becomes narrow as the incident power decreases and wide as the crystal thickness increases. In addition, it is pointed out that controlling the ambient temperature is easier than controlling the heat transfer coefficient. The results of the present study can be used as a quantitative theoretical basis for removing the adverse effects induced by thermal deposition due to linear laser absorption in the crystal, such as depolarization or wave front distortion, and indicate the feasibility of adjusting the refractive index in the window area by changing the heat transfer boundary conditions in a wide-spectrum laser.
Birefringence refers to the splitting of a light ray into two rays in different directions and it takes place in an anisotropic crystal. Birefringence is widely applied in optical devices, [1– 4] such as the liquid crystal display (LCD), optical modulator, color filter, wave plate, grating, crystal polarizer, and phase delay device. In actual applications, birefringence may be produced due to the characteristics of the crystal or some external factors such as the electric-optic effect and the elastic-optical effect. A common electro-optic crystal definitely has a certain light adsorption limit regardless of how wide its transparent wave band is. Light adsorption increases the temperature of the crystal along the laser path and results in an uneven temperature distribution in the crystal. The crystal’ s dielectric coefficient and other parameters change with the temperature of the crystal. Thus, an unwanted photorefractive effect occurs in the electro-optic crystal and its electro-optic performance degrades. The above process is an obvious two-way optical-thermal coupling process.
The thermo-optic effect in an optical material has recently attracted much attention because this phenomenon is essential for all optical materials and can be utilized to fabricate active optical wave-guide components such as TO optical switches and tunable wavelength-division multiplexers. Graupeter and Pflaum[5] studied the influences of the thermal lens effect and birefringence in the laser crystal on the ray quality in a high-power solid laser and pointed out that in a laser amplifier using an Nd:YAG crystal, birefringence is very important. Terui and Ando[6] pointed out that the polarization correlation controls the thermo-optic coefficient. The thermo-optic coefficient is also called the temperature coefficient for refractive index. For example, birefringence relies on temperature. This is a very important question for optical materials, especially for active optical components, such as an optical switch. This correlation is mainly from the material’ s dn/dT. In the paper, the causes of the thermo-optic coefficient and the polarization correlation were explained in detail. However, how to adjust the light’ s polarization characteristics was not discussed. Van Stevendaal et al.[7] pointed out that a change of the ambient temperature may cause a thermo-optic effect, a stress may be produced due to the thermal expansion coefficient difference in the crystal, a possible additional birefringence may occur in the crystal due to the effect and stress occurrence, and thus, the optic properties of the electro-optic crystal are affected.
Zhou et al.[8] studied the birefringence phenomenon of light in a transmission area. However, the crystal’ s light absorption and the thermal effect caused by the light absorption were not considered in their studies. Afterward, Zhou et al.[9] revamped the temperature field model under the action of a circular heat source with Gaussian energy distribution[10] so that the improved model could allow for the influence of the energy loss of the primary transmitted light with oblique incidence on the temperature field as well as the resulting coupled optical-thermal effects. However, because the improved model is still a simple physical model of characterizing energy losses during laser transmission, it is somewhat limited in calculating the energy losses induced by the polarized light adsorption, transmission, and reflection.
For the radiative heat transfer in a semi-transparent medium, many scholars also carried out a series of studies. For example, Sadat et al.[11] solved the radiation coupling heat conduction problem in a semi-transparent medium enclosed in complex two-dimensional (2D) and three-dimensional(3D) geometries by using a diffuse approximation meshless method (DAM). Sakurai et al.[12] solved a combined mode transient conduction-radiation problem in a planar conducting-radiating participating medium by implementation of the radiation element method (REM) with the lattice Boltzmann method. Sadooghi[13] studied transient radiative and conductive heat transfer in a semi-transparent layer of ceramic under different thermal and radiative boundary conditions.
The above studies dealt with light transmission in translucent media in terms of heat radiation rather than electromagnetic wave, and focused mainly on the thermal effect induced by light adsorption rather than several characteristic parameters revealing the light’ s wave nature, such as phase, polarization, and amplitude. In addition, most of the discussions were based on isotropic media rather than anisotropic media.
For birefringences under different environmental conditions, especially in different temperature fields, a series of studies have been carried out. Hernandez-Rodriguez et al.[14] studied birefringences in orthogonal crystals (potassium titanyl phosphate, potassium titanyl phosphate (KTP), potassium titanyl arsenate, and potassium titanyl arsenate (KTA)) and measured the temperature dependencies of birefringence and optical activity when the wave length was 632.8 nm. Ma et al.[15] studied the temperature-dependent birefringence coefficient of the polarization maintaining photonic crystal fiber and found that its birefringence coefficient is much lower than that of the conventional panda fiber. In addition. they pointed out that the substance can be used to reduce the polarization errors, thus providing a higher measurement precision. Wu et al.[16] studied the influences of the temperature field on birefringence and beat length in a high birefringence photonic crystal fiber and pointed out that PCF is more sensitive to temperature. Jason et al.[17] studied the influences of the phase change temperature on birefringence in liquid- and metal-filled side-hole fibers, thus providing the basis for the on/off temperature sensing function. Zhao et al.[18] studied the birefringence effect in a polarization maintaining photonic crystal fiber and pointed out that its ultra-low temperature dependence feature is helpful for the application in the temperature-insenstive fiber interferometer, fiber sensor, and fiber gyroscope. Adamiv[19] studied the temperature-induced change of birefringence in the nonlinear LiKB4O7 monocrystal grown by using the Czochralski method (100– 350 K). Kim and Kang[20] also studied the temperature-dependent birefringence in a polarization maintaining photonic crystal fiber and pointed out that the cause is a combination of temperature-dependent structure and index change. Theoretically, Wang et al.[21] analyzed and simulated the temperature characteristic of the linear birefringence and its influence on the output of the bulk glass current sensor. Baugher and Goldstein[22] studied SiC’ s birefringence effect and its temperature dependence, and pointed out that the study result can be used to explore the possibility of using SiC in mid-infrared nonlinear optical parametric oscillators. Jundt[23] deduced a Sellmeier equation for the extraordinary index of congruent LiNbO3.
The available studies only investigated the influence of the temperature change on birefringence, while no discussion was given on the cause and amplitude of the temperature change or quantitative correlations of optic elements involved in birefringence. Besides, most of them gave insufficient discussion on the heat generation mechanism and the heat compensation method. They gave lots of discussions on the influences of the external temperature change on birefringence and insufficient discussion on the crystal birefringence in the case of environment change and laser adsorption.
Typically, light transmission in a medium is considered as a means of heat transfer (radiation) or signal transmission in the available studies. In the former case, the influence of the thermal effect is mainly analyzed; in the latter case, the influence of the external environment change, especially the temperature change, on the signal transmission process is mainly analyzed.
To sum up, there are currently few theoretical studies on two-way optic-thermal coupling in anisotropic media and few studies on the applied electrical field modulation of adsorbing crystal birefringence. So, studies in these aspects are helpful for reducing the optical element’ s obvious internal beam quality interference from thermal effect-induced aberration, thus ensuring accurate imaging. In addition, they have certain significance for thermo-optic control aiming at widening the wave band in the window area in the wide-spectrum laser.
In order to achieve the above purpose, a series of studies has been conducted to investigate the birefringence of Gaussian laser within the adsorption band in the lithium niobate crystal and its electro-thermal modulation mechanism. In the present paper, a coupling equation set composed of Maxwell frequency domain analysis equation and energy equation is solved by using the finite element method, the transmission of Gaussian laser in a translucent birefringence crystal is numerically simulated, and the influences of the incident light intensity, crystal thickness, ambient temperature, and crystal-environment heat transfer coefficient on the refraction and walk-off angles of O-ray and E-ray are analyzed on the premise that the thermal effects induced by multiple refractions and reflections of the laser in the crystal and their influences on the light transmission are taken into consideration. The multi-field coupling effect (optical, thermal, and electrical) is considered when the mechanism of the applied electric field modulating the light transmission in the light-absorbing crystal is described. The correlation between the applied electrical field intensity and the heat transfer coefficient as well as the correlation between the applied electrical field intensity and the ambient temperature (E-ray) is discussed after adjusting the polarized light waveform back to the rated condition by using an applied electrical field in the case of different incident light intensities and crystal thicknesses. In addition, a preliminary discussion is carried out on a feasible heat exchange transfer coefficient and ambient temperature range for modulation.
The transmission path of light in a crystal or some other media is identified mainly by solving a Maxwell equation set. The difference between the solution of the equation set and that of a radiation transfer equation lies in that the phase, amplitude, polarization, etc. of the light must be considered. If the electrical field intensity is used as a dependent variable to characterize the waveform change, then the Maxwell equation set looks like
where k0 is the wave vector, c0 is the speed of light in the vacuum, and

The equation is suitable for the single-wavelength incidence scenario, and is mainly used for stead-state analysis and pattern analysis. In this paper, the LiNbO3 crystal is used as the study subject. The LiNbO3 crystal is extremely sensitive to the temperature change. The most obvious sensitive parameter is its refractive index. Reference [24] showed that when the wavelength is in the ultraviolet band or the visible light band, the refractive index dispersion equations for O and E rays can be expressed respectively as follows:


Gaussian energy distribution curves of O-ray and E-ray can be obtained by solving the Maxwell equations through the beam envelope method, and can be used to determine the x coordinates of O-ray and E-ray energy peaks. Their walk-off angles can be obtained through inverse derivation. For specific procedures, see Ref. [9].
According to Ref. [25], the LiNbO3 crystal’ s refraction index vs. temperature derivative relation meets the following formulas when the incident wavelength is within the optical absorption edge range:


The temperature distribution in the crystal can be determined by solving the heat conduction equation

with the boundary condition

where Q is the internal heat source caused by the laser’ s thermal effect, q0 is the heat diffusion to the surroundings, Text is the ambient temperature, k is the LiNbO3 crystal’ s heat transfer coefficient, Cp is its specific heat capacity, and α is its thermal diffusivity defined as k/(ρ Cp). The LiNbO3 crystal’ s specific heat capacity and thermal diffusivity vary with the temperature. For their relations with temperature, see Refs. [26] and [27]. The thermal diffusivity vs. temperature curve can be obtained through numerical fitting.
It is inevitable for the laser to lose energy during transmission. In this study, the elasto-optical effect induced by the heat-induced crystal deformation is neglected and the thermo-optic effect induced by the electromagnetic energy loss is mainly considered. As a heat source in the heat transfer part of the model, it is given by

where the resistive loss is

and the magnetic loss is given by

The electric and magnetic energies are defined respectively as

The time derivatives of these expressions are the electric and magnetic powers


These quantities are related to the resistive and radiative energy or energy losses. According to Poynting’ s theorem, [28] we have
The current density J in the above expression is the one satisfying the Maxwell– Ampere law.
On the assumption that the material is linear and isotropic, the following equations are valid:
By interchanging the orders of differentiation and integration, which is justified by the fact that the volume is constant and the fields are continuous in time, the following equation can be obtained:
The integrand on the left side is the total electromagnetic energy density

According to Ref. [29], the index ellipsoid equation for the LiNbO3 crystal can be expressed as
when the applied electric field is parallel to the optical axis (x3). There are no cross terms in Eq. (21), showing that the major axis of the new index ellipsoid is perfectly coincident with the major axis of the old one, and is still the rotating major axis. So, the new principal refractive index can be directly calculated from Eq. (21), and given as follows:


In the present paper, only the change of the principal refractive index in the case that the electric field is parallel to the optical axis (x3) is considered, and those in other cases are not considered.
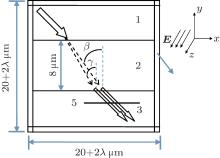
The incident beam is a Gaussian laser. Its transmission direction is perpendicular to the optical axis (z axis); its polarization direction is perpendicular to the incident direction and at an angle of 45° with respect to the z axis. The physical model and the boundary condition are shown in Fig. 1 (x– y cross section): 1 and 2 denote air zones; 3 refers to the LiNbO3 crystal whose refractive index is controlled by the temperature and the applied electric field; 4 represents a perfect electrical conductor boundary condition, i.e., the electric field is perpendicular to the boundary interface; 5 represents a virtual receiving screen, which is 10 μ m wide with a vertical distance of 2 μ m from the bottom surface of the crystal, can be moved to the left or right, and is used to record the intensity distribution of the polarized light in different polarization direction at the location. The β and γ , which determine the directions of the line connecting the locations of the incident light and the emitted light and the crystal interface’ s normal line, are respectively the refraction angles of O-ray and E-ray, and their difference is defined as the discrete angle. The simulation is based on the following assumptions: the crystal’ s electro-optical coefficient does not vary with the temperature and its absorption coefficient and thermal expansion coefficient are isotropic. According to Ref. [29], the electro-optical coefficient is a constant 8.6× 10− 6 μ m/V for O-ray, and it is also a constant 30.8× 10− 6 μ m/V for E-ray. The absorption coefficient of the crystal depends on the incident wavelength. According to Ref. [30], the absorption coefficient is 0.002 μ m− 1, 0.008 cm− 1, and 0.0019 cm− 1 when the incident wavelength is 0.38 μ m, 0.65 μ m, and 1.05 μ m, respectively. The absorption coefficients of O-ray and E-ray have no considerable difference. So, they are assumed to be the same in the present paper. The refractive index of the air is assumed to be 1, i.e., the absorption of light by the air is neglected. The electric field is applied along the z axis. Unless otherwise stated, the electric field’ s intensity is 0 V and the ambient temperature is 293 K. The convective heat transfer coefficient is 10 W/m2· K and the crystal thickness is 8 μ m. In order to observe the wave characteristics in a wavelength range, the grid partition needs to be carried out by wavelength. In this paper, one tenth of the wavelength is regarded as the characteristic length of each grid in the entire area, and all the grids are nonstructural ones. The entire calculation process is shown in Fig. 2, and the origin of the coordinates is set at the center of the simulated area.
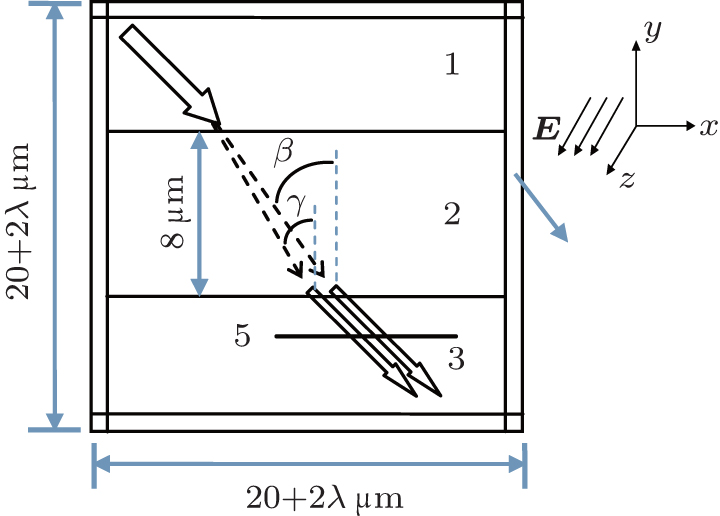 | Fig. 1. Schematic of model. |
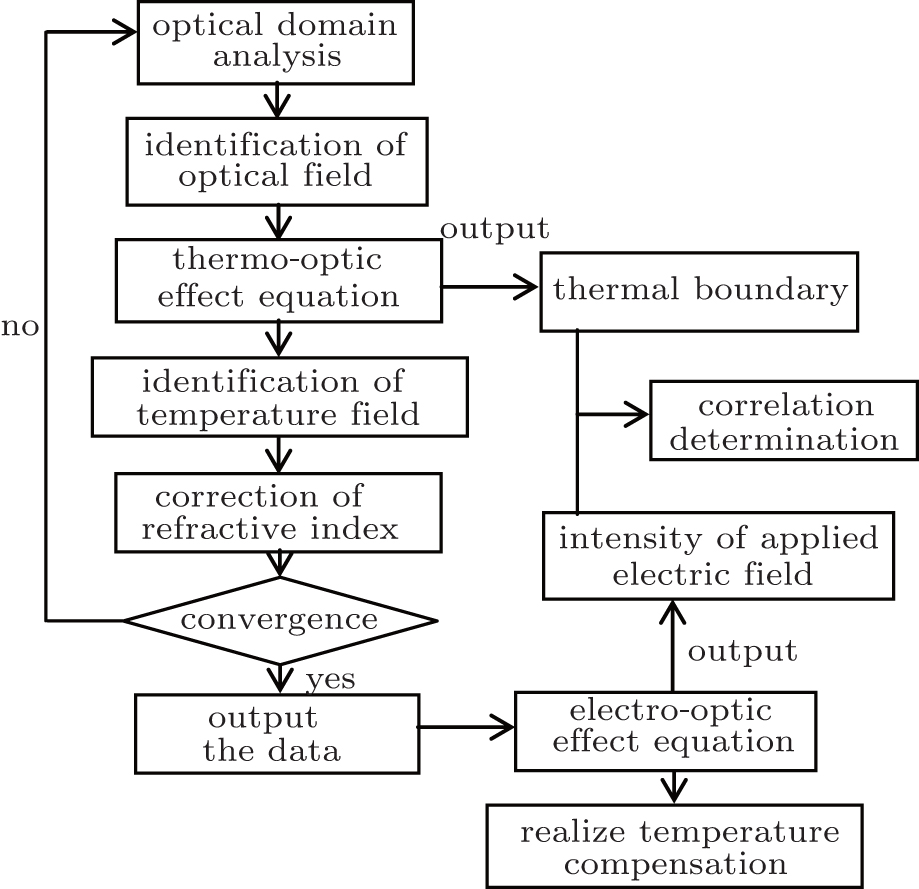 | Fig. 2. Simulation flowchart. |
The solution logic for the coupled thermal and optical effects is as follows: the electromagnetic frequency domain equation is first solved to obtain the optical field distribution on the assumption that the ambient temperature and the heat transfer coefficient are constant; then the heat source term in the energy equation is calculated to obtain the temperature field distribution; the crystal’ s specific heat capacity, the thermal diffusion coefficient, the refractive index, etc. are corrected according to the identified temperature field; new values of the physical parameters are used to solve the light transmission process again; an iteration of the above process is carried out; when the change in temperature or refractive index at the same point in the crystal is less than 0.001 K or 0.00001° , the convergence is considered to be reached, and then the calculation results are outputted.
Figure 3 shows the transmission process of a Gaussian laser in the LiNbO3 crystal in the case of 0.38 μ m incident wavelength and 40000 V/m incident intensity. The electric field’ s distribution of modulus values, the electric field intensity component distributions in three polarization directions Ex, Ey, and Ez, the temperature field distribution, the total heat source, and the total power dissipation density distribution are shown.
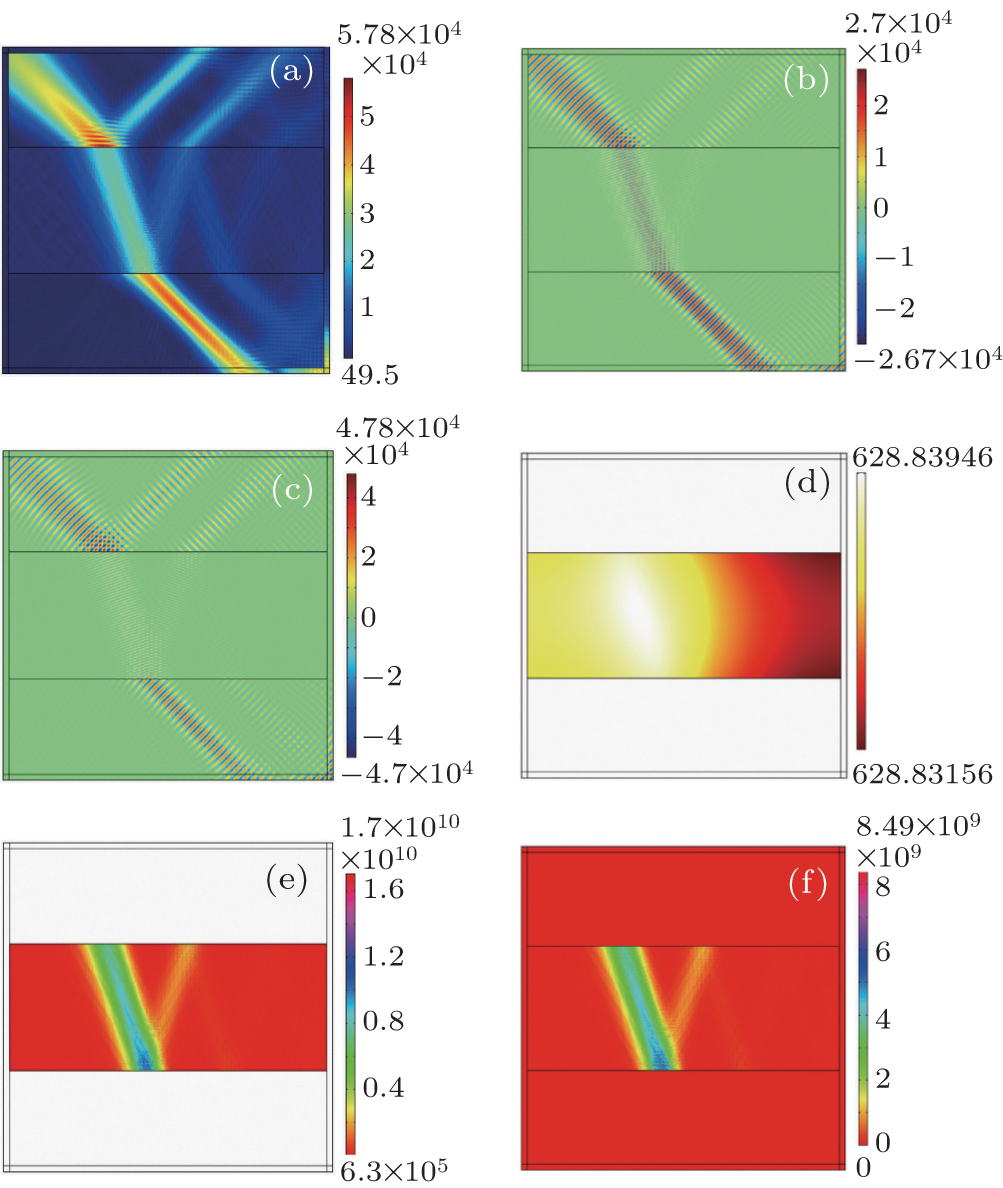 | Fig. 3. Distributions of birefringence’ s electromagnetic field and energy: (a) electric field’ s modulus values, (b) electric field intensity distributions Ex, Ey, (c) electric field intensity distribution Ez, (d) temperature distribution, (e) total heat source, and (f) total power dissipation density. |
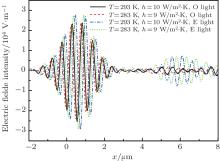
If it is assumed that the O-ray and E-ray waveforms (Ex and Ez) in the case of T = 293 K and h = 10 W/m2· K constitute the rated operating condition and those in the case of T = 283 K and h = 9 W/m2· K constitute the actual operating condition, then their O-ray and E-ray electric field distributions on the receiving screen are shown in Fig. 4. The left peaks and troughs reflect the primary transmitted light’ s energy distribution while the right peaks and troughs reflect the secondary transmitted light’ s energy distribution. The available studies[6] show that it is feasible to make the O-ray and E-ray electromagnetic waveforms in the case of T = 283 K and h = 9 W/m2· K the same as those in the case of the rated operating condition by using an electric field to modulate the electro-optical crystal’ s index ellipsoid. It is found according to the calculation results that when the applied electrical field’ s intensity is 85.5 V/μ m, its Ez intensity is the same as that in the case of the rated operating condition, and when the applied electrical field’ s intensity is 57.7 V/μ m, its Ex and Ey intensities are the same as those in the case of the rated operating condition.
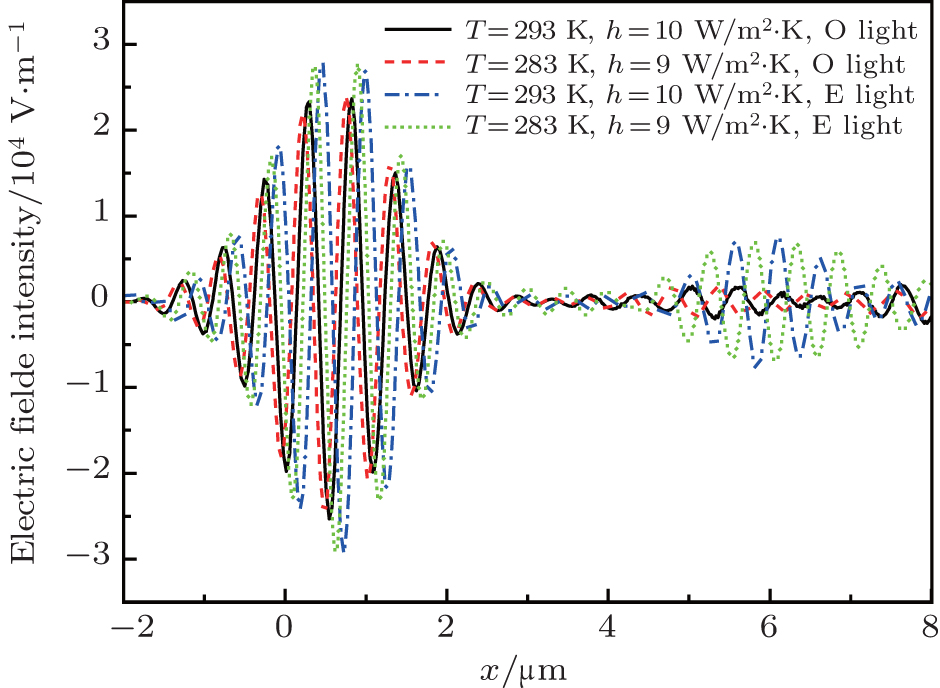 | Fig. 4. The Ex, Ey, and Ez intensity distributions on the receiving screen in the two scenarios (E-ray and O-ray). |
Figure 5 shows the changes of the O-ray and E-ray refraction angles with ambient temperature when the heat transfer coefficient is 10 W/m2· K and the incident light intensity is 30000 V/m, 35000 V/m, and 40000 V/m. As shown in the figure, both O-ray and E-ray refraction angles decrease as the incident power increases when the ambient temperature is constant. However, the change of the E-ray refraction angle is faster. This is mainly because the E-ray’ s refractive index temperature coefficient is larger than that of the O-ray (see Eqs. (5) and (6)). In addition, the refraction angles of O-ray and E-ray decrease as the ambient temperature increases when the incident power is constant, and the decrease of the E-ray’ s refraction angle is faster. This is mainly because the increase of the O-ray’ s refractive index induced by the ambient temperature’ s increase is slower than that of the E-ray’ s refractive index. The calculations show that when the ambient temperature changes from 273 K to 313 K, the refraction angle changes of the O-ray with the incident power are respectively 0.10001° , 0.10453° , and 0.0863° , while those of the E-ray are respectively 0.14959° , 0.15534° , and 0.12737° . It can be seen that the refraction angle changes in the cases of 30000 V/m and 35000 V/m are close and the refraction angle change in the case of 40000 V/m is relatively small. This is mainly because a considerable amount of heat is produced within the crystal in the case of 40000 V/m. The crystal’ s specific heat gradually increases as the temperature increases. When the specific heat reaches up to a certain value, the influence of the specific heat on the temperature change might be greater than that of the power change. Thus, the crystal’ s internal temperature change is the smallest in this case.
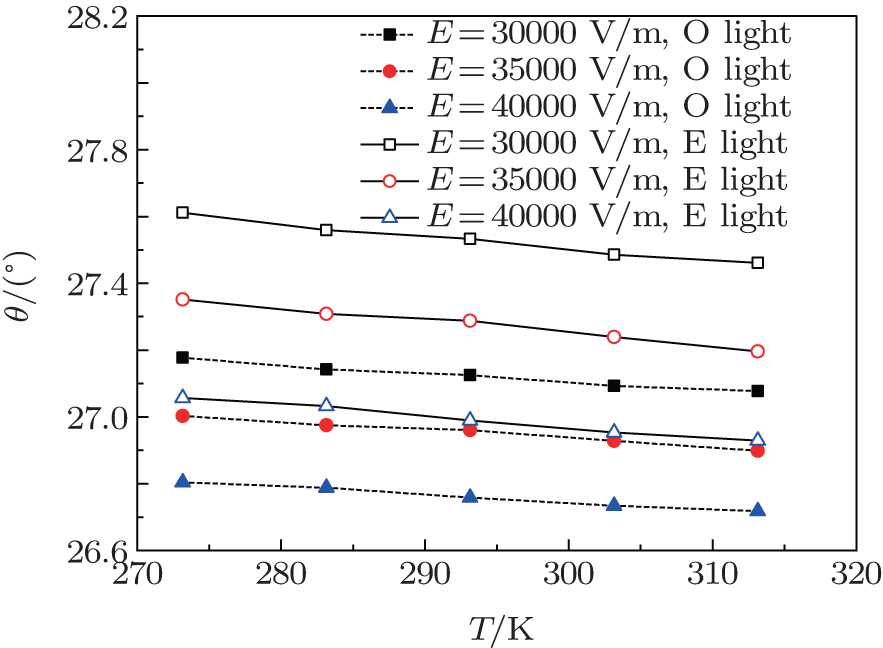 | Fig. 5. Refraction angle vs. ambient temperature at different incident light intensities. |
Figure 6 shows the changes of the O-ray and E-ray discrete angles with ambient temperature when the heat transfer coefficient is 10 W/m2· K and the incident light intensity is 30000 V/m, 35000 V/m, and 40000 V/m respectively. It can be seen that when the temperature is constant, the discrete angle decreases as the incident power increases, and when the incident power is constant, the discrete angle decreases as the ambient temperature increases. This is mainly because the crystal’ s temperature increases as the ambient temperature or incident power increases, thus causing their refractive indices to increase. The refractive index temperature coefficient of the E-ray is higher than that of the O-ray, but when the refractive index of the E-ray is closer to that of the O-ray as the temperature increases, the crystal’ s anisotropism is weaker and thus the discrete angle decreases.
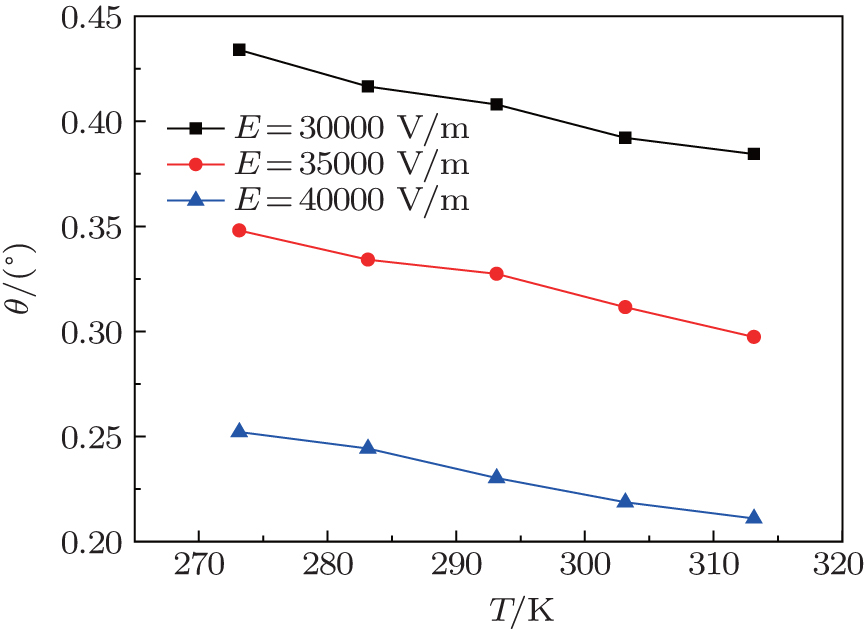 | Fig. 6. Discrete angle vs. ambient temperature at different incident light intensities. |
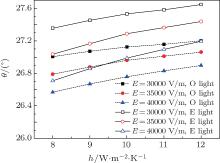
Figure 7 shows the changes of O-ray and E-ray refraction angles with heat transfer coefficient at different incident powers when the ambient temperature is 293.15 K. As shown in the figure, both O-ray and E-ray refraction angles decrease as the incident power increases on the premise that the heat transfer coefficient is constant. However, the decrease of the E-ray refraction angle is faster. In addition, when the incident power is constant, both of the refraction angles of O-ray and E-ray increase as the heat transfer coefficient increases. The increase of the E-ray refraction angle is faster. This is mainly because the increased heat transfer coefficient intensifies the heat dissipation and reduces the temperature of the crystal. So both the O-ray and E-ray’ s refractive indices decrease, and the decrease of the O-ray is slower. In addition, when the heat transfer coefficient changes from h = 8 W/m2· K to h = 12 W/m2· K, the refraction angles of the O-ray are respectively 0.19516° , 0.27158° , and 0.32987° as the incident power increases, while the refraction angles of the E-ray are respectively 0.29165° , 0.40322° , and 0.48635° . This indicates that the refraction angle increases as the incident power increases, since the temperature change in the crystal increases as the incident power increases.
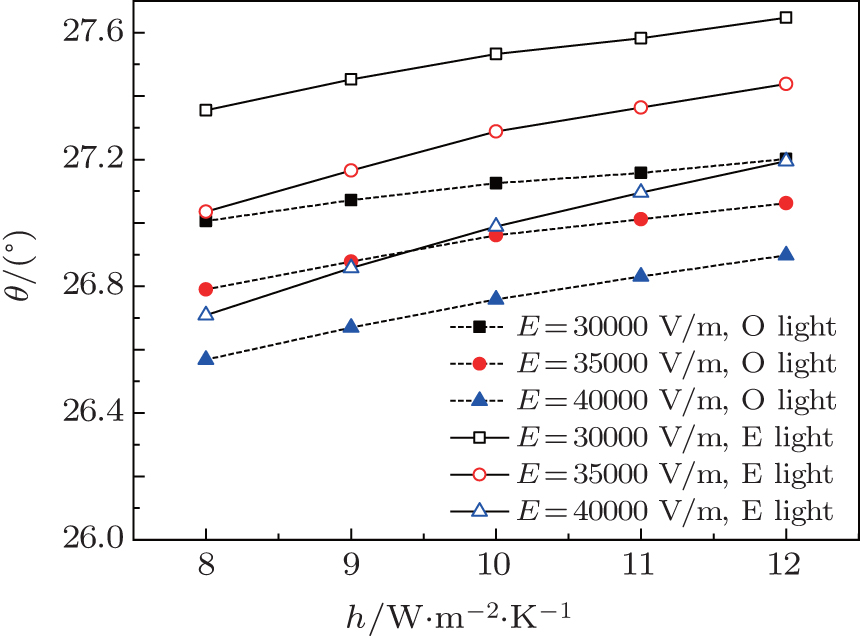 | Fig. 7. Refraction angle vs. heat transfer coefficient at different incident light intensities. |
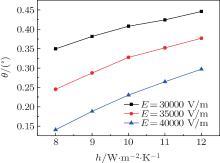
Figure 8 shows the changes of the O-ray and E-ray discrete angles with the heat transfer coefficient when the ambient temperature is 293.15 K and the incident light intensity is 30000 V/m, 35000 V/m, and 40000 V/m respectively. It can be seen that on the premise that the heat transfer coefficient is constant, the discrete angle decreases as the incident power increases, and on the premise that the incident power is constant, the discrete angle decreases as the heat transfer coefficient increases. In addition, the discrete angle’ s increase rate gradually decreases as the heat transfer coefficient increases and gradually increases as the incident power increases. This is mainly because a higher heat transfer coefficient leads to a lower crystal temperature and refractive index yet higher O-ray and E-ray refraction angles, allowing the E-ray refraction index to gradually deviate from the O-ray refraction index, and the discrete angles to become gradually wider, and as the incident power increases, the temperature change in the crystal induced by the same heat transfer coefficient change increases and thus the discrete angle’ s increase rate increases. When the incident light intensity is constant, the heat dissipation change induced by the optical path change is very small, i.e., the heat source change is very small, and in this case, the crystal’ s temperature is determined mainly by the heat transfer coefficient. When the heat transfer coefficient is very small, the same heat transfer coefficient change causes a larger change in the crystal temperature according to the heat transfer theory. So, the discrete angle change is considerable when the heat transfer coefficient is small.
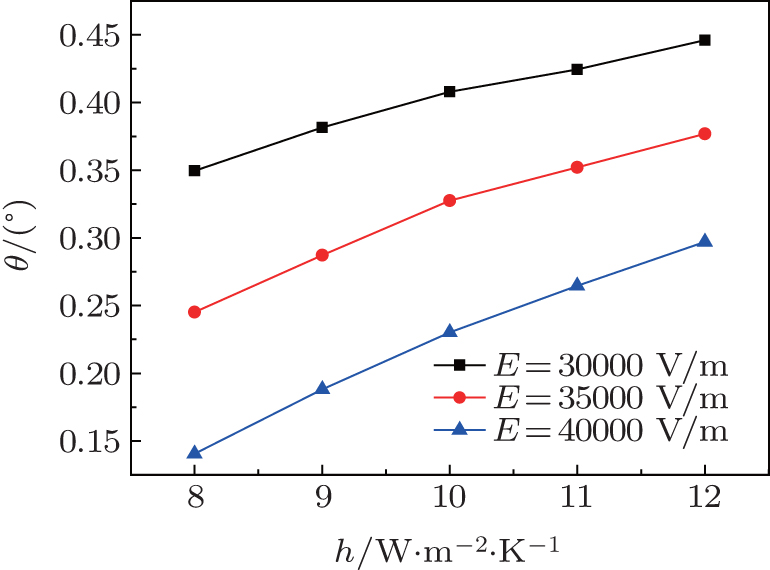 | Fig. 8. Discrete angle vs. heat transfer coefficient at different incident light intensities. |
Figure 9 shows the changes of the O-ray and E-ray refraction angles with ambient temperature at different crystal thicknesses when the heat transfer coefficient is 10 W/m2· K. As shown in the figure, both O-ray and E-ray refraction angles decrease as the crystal thickness increases on the premise that the ambient temperature is constant. However, the change of the E-ray refraction angle is faster. This is mainly because a higher crystal thickness leads to a longer optical path in the crystal and a higher internal heat source energy, and meanwhile, the higher crystal thickness weakens the crystal’ s heat dissipation, thus the crystal’ s temperature is higher. In addition, when the ambient temperature changes from 273 K to 313 K, with the crystal thicknesses of 6 μ m, 7 μ m, 8 μ m, 9 μ m, and 10 μ m, the refraction angle changes of the O-ray, are respectively 0.09367° , 0.09812° , 0.0863° , 0.09296° , and 0.09326° while those of the E-ray are respectively 0.13932° , 0.14532° , 0.12737° , 0.13671° , and 0.13662° . It can be seen that their refraction angles in the case of 7 μ m thickness are the widest and their refraction angles in the case of 8 μ m thickness are the narrowest. This is mainly because the crystal has a big temperature change (39.77 K) in the case of 7 μ m thickness and a small temperature change (35.29 K) in the case of 8 μ m thickness.
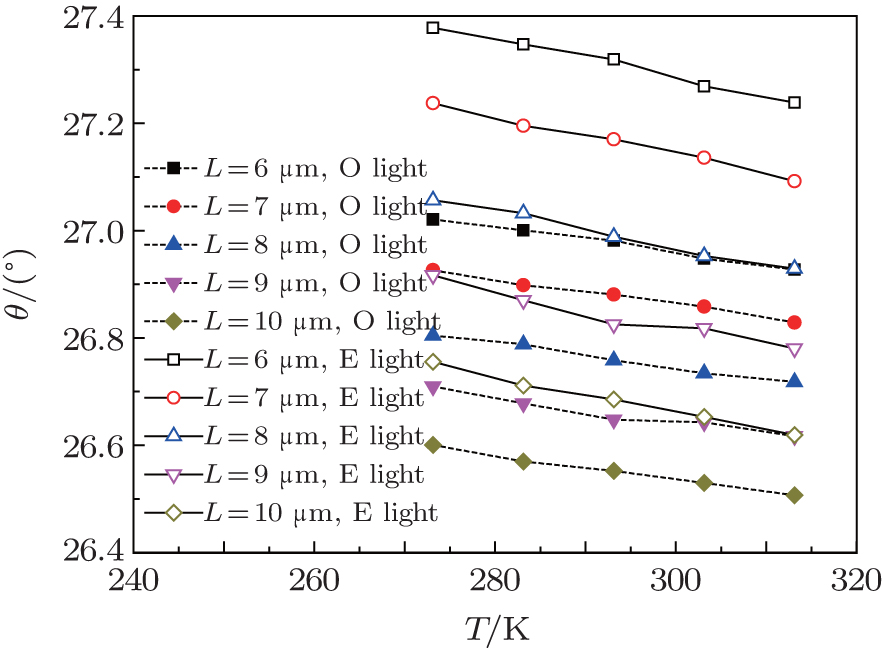 | Fig. 9. Refraction angle vs. ambient temperature at different crystal thicknesses. |
Figure 10 shows the discrete angle vs. ambient temperature with different crystal thicknesses. It can be seen that when the ambient temperature is constant, the discrete angle decreases as the crystal thickness increases. This is mainly because the larger crystal thickness leads to a longer total laser path, which causes the heat source term to have a higher value and the crystal’ s internal temperature to sustain a bigger increase, thus making the refraction indices of the O-ray and E-ray higher and their refraction angles narrower. The decrease of the E-ray’ s refraction angle is faster than that of the O-ray’ s refraction angle, so the path of the E-ray is closer to the path of the O-ray. In addition, when the ambient temperature changes from 273 K to 313 K, the discrete angle change in the case of 7 μ m thickness is maximal and the discrete angle change in the case of 8 μ m thickness is minimal.
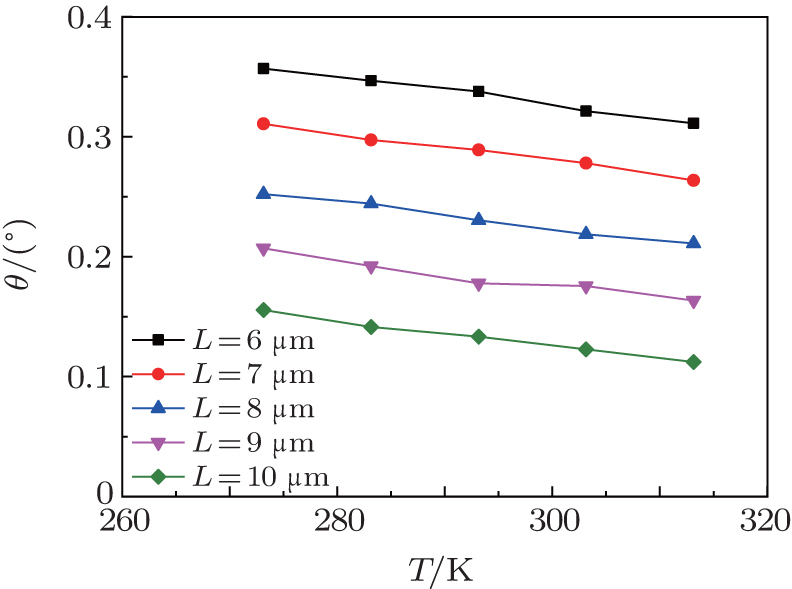 | Fig. 10. Discrete angle vs. ambient temperature at different crystal thicknesses. |
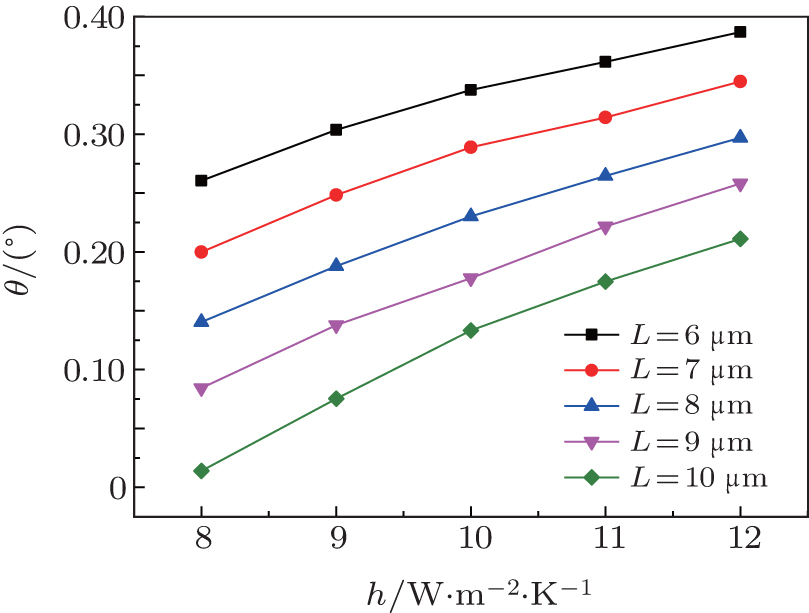
Figure 11 shows the changes of the O-ray and E-ray refraction angles with heat transfer coefficient at different crystal thicknesses (6 μ m, 7 μ m, 8 μ m, 9 μ m, and 10 μ m) when the ambient temperature is 293.15 K. As shown in the figure, both O-ray and E-ray refraction angles decrease as the crystal thickness increases on the premise that the heat transfer coefficient is constant. However, the decrease of the E-ray refraction angle is faster. In addition, when the heat transfer coefficient changes from h = 8 W/m2· K to h = 12 W/m2· K, the refraction angles of the O-ray are 0.25967° , 0.30173° , 0.32987° , 0.37092° , and 0.42667° when the crystal thicknesses are 6 μ m, 7 μ m, 8 μ m, 9 μ m, and 10 μ m while the refraction angles of the E-ray are 0.38591° , 0.44667° , 0.48635° , 0.54487° , and 0.62392° . This indicates that the refraction angle increases as the crystal thickness increases when the heat transfer coefficient changes from h = 8 W/m2· K to h = 12 W/m2· K and the ambient temperature is constant. This is mainly because a larger crystal thickness leads to a higher total energy adsorption of the crystal along the optical path, which increases the crystal’ s internal heat source level. According to the energy equation, the temperature change induced by the same Δ h increases as the heat source level increases.
 | Fig. 11. Refraction angle vs. heat transfer coefficient at different crystal thicknesses. |
Figure 12 shows the O-ray and E-ray discrete angles vs. heat transfer coefficient at different crystal thicknesses. It can be found that on the premise that the heat transfer coefficient is constant, the discrete angle decreases as the crystal thickness increases while on the premise that the crystal thickness is constant, the discrete angle increases as the heat transfer coefficient increases. The discrete angle change gradually becomes faster as the crystal thickness increases. On the premise that the crystal thickness is constant, the discrete angle change gradually becomes slower as the heat transfer coefficient increases. This is mainly because the larger crystal thickness causes the crystal’ s internal heat source level to increase and the crystal’ s internal temperature change induced by the same heat transfer coefficient change to increase. According to the heat transfer theory, when the heat transfer coefficient is low, a change in the heat transfer coefficient of the same degree causes a considerable temperature change, and the temperature change gradually decreases as the heat transfer coefficient increases.
 | Fig. 12. Discrete angle vs. heat transfer coefficient at different crystal thicknesses. |
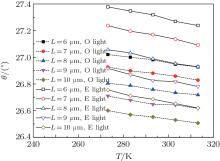
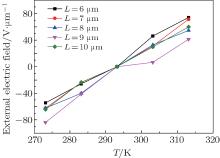
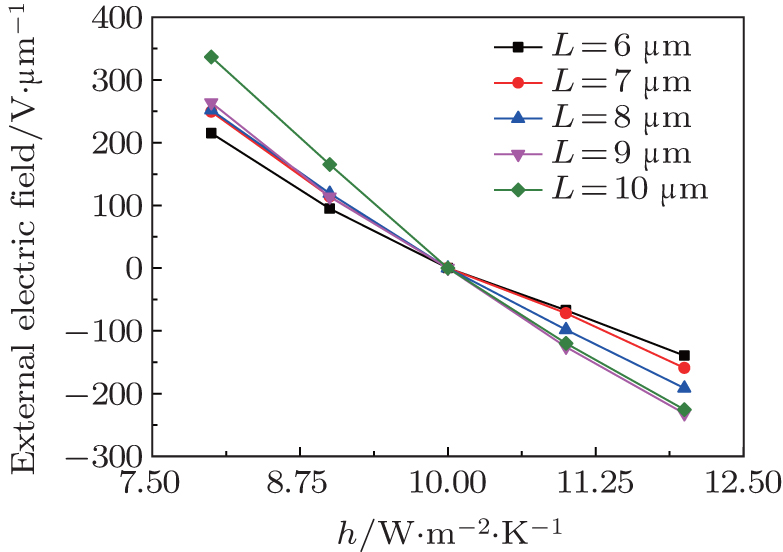
Figure 13 shows the correlations between the applied electric field intensity and the ambient temperature to keep the output E-ray’ s refraction angle and intensity unchanged when the incident power is 40000 V/m, the ambient temperature is 293.15 K, and the heat transfer coefficient is 10 W/m2· K. According to the figure, 293.15 K is the critical point. When the ambient temperature increases, the positive electric field intensity required for offsetting the temperature influence gradually increases; in the case of L = 6 μ m, the required electric field intensity is maximal; in the case of L = 9 μ m, the required electric field intensity is minimal. When the ambient temperature decreases, the negative electric field intensity required for offsetting the temperature influence gradually increases; in the case of L = 6 μ m, the required electric field intensity is minimal; in the case of L = 9 μ m, the required electric field intensity is maximal. This is mainly because the refractive index decreases as the crystal thickness increases when the operating condition is unchanged. The average refractive index in the case of L = 6 μ m is minimal. That is, ne in Eq. (23) is minimal. If we assume that T = 293.15 K and h = 10 W/m2· K constitute the rated operating condition, the refractive index to be targeted is ne1. The ne1 decreases when the ambient temperature decreases, while ne1 increases when the ambient temperature increases. Finally, the required applied electric field intensity is determined by ne and ne1. The crystal’ s maximum internal temperatures are respectively 560.28 K, 551.97 K, 538.40 K, 530.91 K, and 522.60 K when L = 6 μ m and the ambient temperatures are 273 K, 283 K, 293 K, 303 K, and 313 K. So, in this case, the crystal’ s internal temperature increasing with the increase of the ambient temperature is slightly larger than its internal temperature decreasing with the decrease of the ambient temperature, and thus, in the case of L = 6 μ m, the required positive electric field intensity is higher than the required negative electric field intensity. The crystal’ s maximum internal temperatures are respectively 687.17 K, 676.45 K, 674.40 K, 661.81 K and 648.85 K when L = 9 μ m and the ambient temperatures are 273 K, 283 K, 293 K, 303 K, and 313 K. In this case, the crystal’ s internal temperature increasing with the increase of the ambient temperature is far lower than its internal temperature decreasing with the decrease of the ambient temperature, which makes the required positive electric field intensity lower than the required negative electric field intensity in the case of L = 9 μ m.
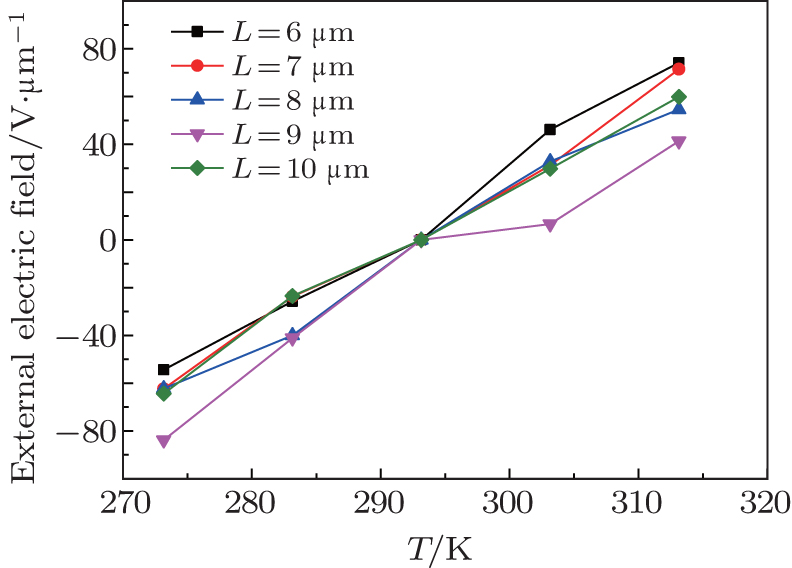 | Fig. 13. Applied electric field intensity vs. ambient temperature at different crystal thicknesses. |
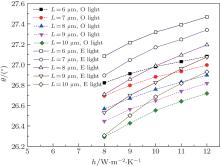
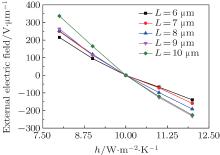
Figure 14 shows the correlations between the applied electric field intensity and the heat transfer coefficient to keep the output E-ray’ s refraction angle and intensity unchanged when the incident power is 40000 V/m, the ambient temperature is 293.15 K, and the heat transfer coefficient is 10 W/m2· K. According to the figure, the critical point is h = 10 W/m2· K. The positive electric field intensity required for offsetting the temperature increase influence gradually increases as the heat transfer coefficient decreases; and the negative electric field intensity required for offsetting the temperature decrease influence gradually increases as the heat transfer coefficient increases. For the same Δ h to be modulated, the required negative electric field intensity is lower than the required positive electric field intensity. This is mainly because the temperature increase induced by a heat transfer coefficient decrease is larger than the temperature decrease induced by the same heat transfer coefficient increase. In addition, when the heat transfer coefficient changes from h = 8 W/m2· K to h = 12 W/m2· K, there is the following order by required applied electric field intensity: L = 10 μ m > L = 9 μ m > L = 8 μ m > L = 7 μ m > L = 6 μ m. This is mainly because higher crystal temperature with larger crystal thickness leads to higher refractive index on the premise that the heat transfer coefficient is constant. The calculation results show that the crystal’ s temperature changes as the thickness increases and the heat transfer coefficient changes from h = 8 W/m2· K to h = 12 W/m2· K are as follows: 104.62 K, 122.59 K, 135.20 K, 153.24 K, and 178.04 K. Thus, the temperature change increases as the thickness increases. The refractive index change induced by the temperature change also increases gradually. Thus, the compensating electric field’ s intensity meets the above pattern.
 | Fig. 14. Applied electric field intensity vs. heat transfer coefficient at different crystal thicknesses. |
In an actual application, there is an electric field intensity threshold for any substance beyond which it will break down. This is the maximum voltage that the substance can sustain. Once the applied electric field intensity exceeds the threshold, the medium will fail to work normally. Currently, there is not any available literature document dealing with the breakdown voltages of thin lithium niobate layers. Their breakdown electric field strengths are approximately a few tens of volts per μ m. In this paper, the thin lithium niobate layer’ s breakdown electric field strength is assumed to be 100 V/μ m. The figure shows that when the heat transfer coefficient change is considerable, such as in the range from h = 10 W/m2· K to h = 8 W/m2· K, a voltage that is higher than the medium’ s breakdown voltage is required for offsetting. This is impossible in fact. Figures 13 and 14 show that the electric field compensation for the influence of the ambient temperature change on the refractive index can be carried out within a considerable ambient temperature range (about 40– 50 K) but the electric field compensation for the influence of the heat transfer coefficient change on the refractive index can be carried out within a narrow range (about 1– 2 W/m2· K). In addition, figure 14 shows that when the thickness decreases, the slope of curve for the applied electric field intensity vs. heat transfer coefficient decreases. If we assume that the index of refraction in the case of h = 10 W/m2· K constitutes the rated condition and the breakdown voltage is 100 V/μ m, the calculation shows that in the case that the thicknesses are 6 μ m, 7 μ m, 8 μ m, 9 μ m, and 10 μ m, the heat transfer coefficient adjustment ranges, which are available through the compensation by an applied electric field for the variation of the E-ray index of refraction incurred by the variation of the heat transfer coefficient, are 8.87– 11.26 W/m2· K, 8.99– 11.07 W/m2· K, 9.02– 10.82 W/m2· K, 8.88– 10.44 W/m2· K, and 8.96– 10.39 W/m2· K, respectively. It can be seen that the electric field-adjustable range of the convection heat transfer coefficient slightly decreases as the thickness increases.
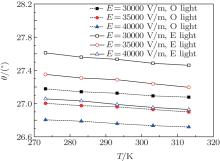
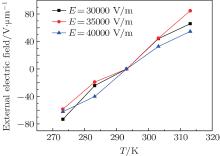
Figure 15 shows the correlations between the applied electric field intensity and the ambient temperature to keep the output E-ray’ s refraction angle and intensity unchanged when the crystal thickness is 8 μ m, the ambient temperature is 293.15 K, and the heat transfer coefficient is 10 W/m2· K, all of which constitute the rated operating condition. This figure shows that the required intensity of the applied positive electric field increases as the ambient temperature increases (> 293.15 K), and the required intensity of the applied negative electric field increases as the ambient temperature decreases (< 293.15 K). It can be seen that the applied electric field intensity vs. temperature is presented in the form of a nonlinear distribution. When the ambient temperature is higher than 283 K and constant, the required positive electric field intensity is maximal and the required negative electric field intensity is minimal in the case ofE = 35000 V/m; on the contrary, in the case of E = 40000 V/m, the required positive electric field intensity is minimal and the required negative electric field intensity is maximal. When the ambient temperature is 273 K, the required negative electric field intensity values follow the following pattern: E = 35000 V/m ≥ E = 40000 V/m ≥ E = 30000 V/m. The above pattern is mainly determined by the crystal’ s final internal temperatures in the case of different ambient temperatures. The final constant crystal temperature is a result of multiple factors such as laser path, crystal– air interface transmission-reflection ratio, and specific heat capacity.
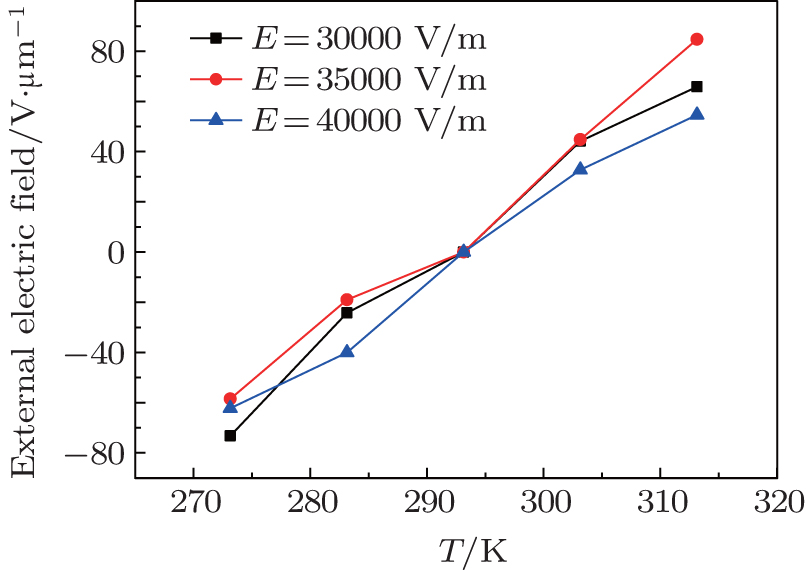 | Fig. 15. Electric field intensity vs. ambient temperature at different incident light intensities. |
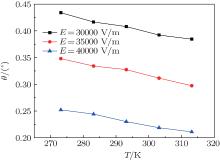
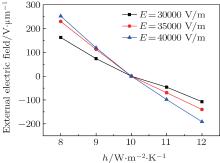
Figure 16 shows the correlations between the applied electric field intensity and heating the transfer coefficient to keep the output E-ray’ s refraction angle and intensity unchanged when the crystal thickness is 8 μ m, the ambient temperature is 293.15 K, and the heat transfer coefficient is 10 W/m2· K, all of which constitute the rated operating condition. According to the figure, the critical point is h = 10 W/m2· K. The positive electric field intensity required for offsetting the temperature increase influence gradually increases when the heat transfer coefficient decreases; and the negative electric field intensity required for offsetting the temperature decrease influence gradually increases when the heat transfer coefficient increases; for offsetting the refraction angle changes induced by the same heat transfer coefficient changes, the required positive electric field intensity is slightly higher than the required negative electric field intensity. In addition, the applied electric field intensity required for the same heat transfer coefficient change increases when the incident power increases. This is mainly because the same heat transfer coefficient change leads to a bigger temperature change when the incident power increases. So, a stronger electric field is required to offset the influence of temperature on the refractive index.
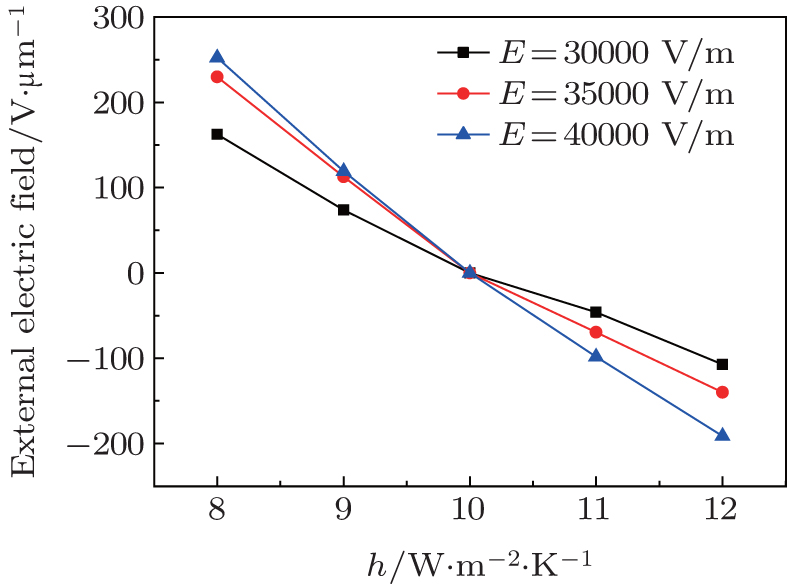 | Fig. 16. Applied electric field intensity vs. heat transfer coefficient at different light intensities. |
Figures 15 and 16 show that if the breakdown electric field intensity is a certain value, the electric field’ s heat transfer coefficient regulation range in the case of 40000 V/m incident light intensity is widest and the decrease in incident power leads to the narrowing of the heat transfer coefficient regulation range. The calculation shows that if the incident electric field intensities are 30000 V/m, 35000 V/m, and 40000 V/m, the heat transfer coefficient adjustment ranges, which are available through the compensation by an applied electric field for the variation of the E-ray index of refraction incurred by the variation of the heat transfer coefficient, are 8.60– 11.68 W/m2· K, 8.84– 11.15 W/m2· K, and 9.02– 10.82 W/m2· K, respectively. It can be seen that the electric field-adjustable range of the convection heat transfer coefficient decreases as the power of the incident light increases. This is mainly because the slope of curve for the applied electric field intensity vs. heat transfer coefficient gradually increases as the incident light intensity increases. The offsetting regulation patterns of the applied electric field to temperature change influence are relatively complex. This is mainly because the relation between the applied electric field intensity and the temperature is in the form of a nonlinear distribution.
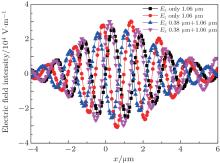
The crystal does not adsorb any incident light in the window area but the light refractive index in the area is still subjected to the temperature influence. So, for some wide-spectrum lasers (the light wavelength contains both adsorption band and transmission band), it is possible to consider the modulation of the window area’ s light refractive index by changing the ambient temperature or heat transfer coefficient. Figure 17 shows two scenarios: 1) vertical incidence of one single beam (1.06 μ m); 2) vertical incidence of two beams (1.06 μ m and 0.38 μ m) into the lithium niobate crystal; on the receiving screen, the 1.06 μ m beam is distributed in the polarization direction. The visible waveforms shift toward the left, mainly because the 0.38 μ m beam is easy to be adsorbed by the crystal, thus resulting in higher crystal temperature and making the 1.06 μ m beam’ s refractive index lower. It has been proved in this paper that when the external environment changes, both refractive index and heat source loss of light within the adsorption band change. The resulting crystal temperature change affects the refractive index of the light in the window area. This indicates that for a laser with a wide spectrum containing the adsorption band, it is theoretically feasible to modulate the refractive index of light within the window band by changing the ambient boundary conditions.
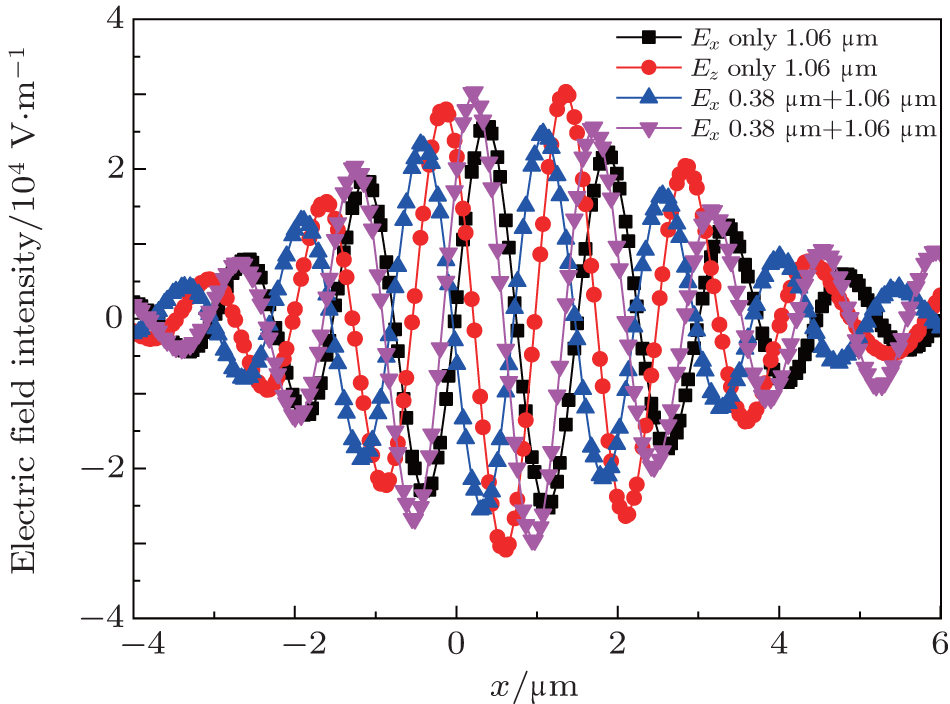 | Fig. 17. Electric field intensity distributions for O-ray and E-ray on receiving screen in the cases of single and dual incident wavelengths. |
The finite element method is used to solve the electromagnetic field’ s frequency domain equation and energy equation, and the transmission process of Gaussian laser in a light adsorbing uniaxial crystal is simulated. Both the heat source term induced by the transmission loss of the laser in the uniaxial crystal and changes in the optical properties and index ellipsoid induced by the crystal temperature change are considered. When the heat source term is included, the electromagnetic wave’ s energy losses induced by its multiple refractions and reflections are considered. The influences of ambient temperature and heat transfer coefficient on refraction and walk-off angles of O-ray and E-ray in the cases of different incident powers and crystal thicknesses are mainly analyzed. E-ray electrical modulation instances are presented to identify the correlation between the ambient temperature and the applied electrical field intensity and the correlation between the surface heat transfer coefficient and the applied electrical field intensity. The applicable electrical modulation ranges without crystal breakdown are proposed. The study shows that controlling the change of the ambient temperature is easier than controlling the heat transfer coefficient. In addition, when the electromagnetic field transmission loss is considered to calculate the heat source term and electrical modulation based on the rated operating condition of T = 293 K and h = 10 W/m2· K, it is found that the slope of curve for electric field intensity vs. heat transfer coefficient increases as the crystal thickness and the incident power increase and the patterns of electric field intensity vs. ambient temperature are not obvious. The results provide a relevant theoretical basis for removing adverse thermal effects such as depolarization and wavefront distortion caused by thermal deposition during linear laser absorption.
| 1 |
|
| 2 |
|
| 3 |
|
| 4 |
|
| 5 |
|
| 6 |
|
| 7 |
|
| 8 |
|
| 9 |
|
| 10 |
|
| 11 |
|
| 12 |
|
| 13 |
|
| 14 |
|
| 15 |
|
| 16 |
|
| 17 |
|
| 18 |
|
| 19 |
|
| 20 |
|
| 21 |
|
| 22 |
|
| 23 |
|
| 24 |
|
| 25 |
|
| 26 |
|
| 27 |
|
| 28 |
|
| 29 |
|
| 30 |
|