Oscillatory Shannon entropy in the process of equilibration of nonequilibrium crystalline systems
[Giri A.†a)  , Das Nilangshu K.
b) , Barat P.a) ]
, Das Nilangshu K.|
|


†Corresponding author. E-mail: amal.vu@gmail.com
We present a study of the equilibration process of some nonequilibrium crystalline systems by means of molecular dynamics simulation technique. The nonequilibrium conditions are achieved in the systems by randomly defining velocity components of the constituent atoms. The calculated Shannon entropy from the probability distribution of the kinetic energy among the atoms at different instants during the process of equilibration shows oscillation as the system relaxes towards equilibrium. Fourier transformations of these oscillating Shannon entropies reveal the existence of Debye frequency of the concerned system.
Most of the systems observed in nature or in the laboratory are in a nonequilibrium state. Physical properties of systems are measured by bringing them in their nonequilibrium state by applying external perturbations. In last two decades there has been lot of impetus to understand the process of equilibration of nonequilibrium system, far from equilibrium, by studying the dynamical evolution of the individual constituents of the system.[1] In order to understand the collective behavior of a nonequilibrium system, it is important to study the behavior of the constituent atoms of the nonequilibrium system together during the passage of equilibration. This can be achieved by studying the variation of the probability distribution function (PDF) of the energy of the associated atoms in the system during equilibration. The global dynamics of equilibrium systems are studied by statistical mechanics forging the fundamental link between the interactions of the constituents and the macroscopic behavior of the interacting many-body systems. Boltzmann established a general framework to evaluate the associate probability of an ensemble of an equilibrium system to achieve a particular energy state. The equilibrium distribution of a system is derived by maximizing the entropy. Thus, whenever a nonequilibrium system reaches an equilibrium state, it has to follow the path of steepest entropy ascent compatible with the constraints of the system concerned. This observation is inconsistent with Onsager’ s theory of reciprocity[2] and fluctuation– dissipation theory.[3]
A nonequilibrium system continuously undergoes transitions from one state to the other to maximize the entropy measure. Thus it is imperative to study the evolution process of equilibration of a nonequilibrium system one has to calculate the time-dependent PDF, p(E, t) and the corresponding measure of entropy. In this paper we present the time variation of the Shannon entropy[4] of nonequilibrium systems defined by the relation S(t) = − ∫ p(E, t)log p(E, t)dE, where p(E, t) is obtained by molecular dynamics (MD) simulation technique.
A variety of materials with different crystal structures with widely employed empirical interaction potentials are used to carry out the MD simulations.[5] Depending on the potential function, the trajectories of the atoms are calculated at each time step of simulation by solving Newton’ s laws of motion. Copper (Cu), aluminium (Al), and solid argon (Ar) with face centered cubic (FCC) structure, and iron (Fe) with body centered cubic (BCC) structure are the elements considered in this study. The simulations are performed using MD+ + [6] code. The empirical potentials used are Embedded Atom Method, [7, 8] Aluminum Glue, [9] Lennard Jones, [10] and Finnis-Sinclair[11] for Cu, Al, solid Ar, and Fe respectively. Cubic cells of size 20× 20× 20 unit cell (uc) containing 32000 Cu, Al, and solid Ar atoms, and 25 × 25 × 25 uc containing 31250 Fe atoms are considered as the simulation systems. The number of atoms in our simulations are much larger than that recommended in reference[12] to avoid the size effect. In all the cases, initially, the systems are relaxed at 100 K (30 K for solid Ar) temperature for 2.5 ps (10 ps for solid Ar) using periodic boundary condition in all three directions under constant number of atoms, volume, and total energy (NVE) ensemble. The number of time steps used for relaxations was 5000 with a time step of 0.5 fs (2 fs for solid Ar). To set up the nonequilibrium state, the velocity components of the atoms are redefined such that the average KE of the atoms becomes 500 K (70 K for solid Ar). The systems are then released for equilibration. Consequently, the systems gradually proceed towards equilibrium.
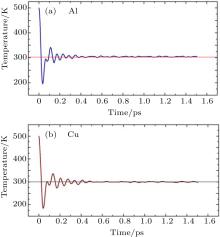
During the equilibration process the position and velocity components of each atom are recorded at every time step of 0.5 fs (2 fs for solid Ar). The total equilibration time was 1.5 ps (20 ps for solid Ar). The variation of the average system temperature for aluminium and copper are shown in Fig. 1. The figure exhibits larger fluctuation of average temperature when the system is far away from the equilibrium temperature. The standard deviation of this fluctuation is tabulated in Table 1 for all the materials.
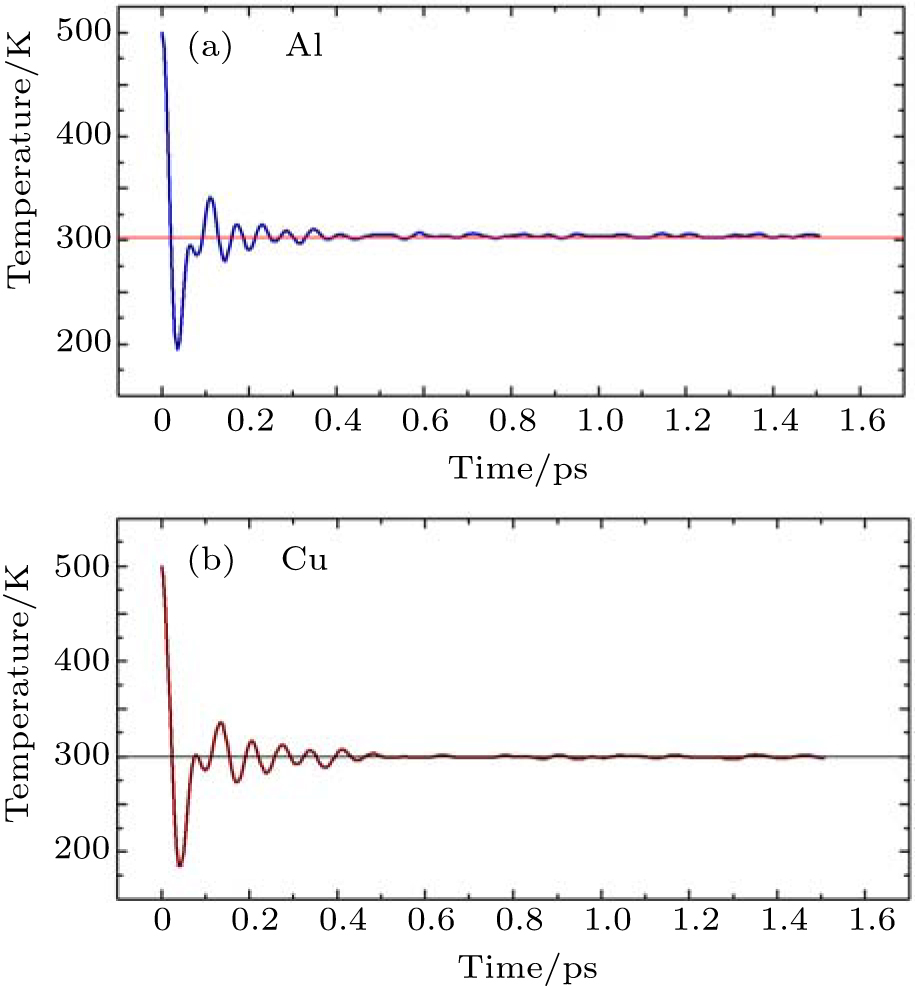 | Fig. 1. Variations of temperature (equivalent to kinetic energy) with time of the systems of (a) Al and (b) Cu leading to the equilibration. |
| Table 1. Table showing the standard deviation of the average temperature variation of solid argon, copper, iron, and aluminium during the equilibration from their respective initial to final temperature. |
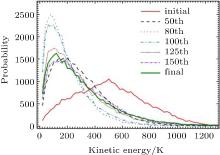
An easy way to compute Shannon entropy is the construction of probability distribution (Fig. 2) and subsequently with the help of binning of probability distribution the conventional formula computes the Shannon entropy. Since the quantity, Shannon entropy, provides the information of the system, the selection of the bin is an important aspect of this work. If the bin size is not close to the standard deviation average system temperature, then we will lose information for larger bin size and for a smaller bin size we have to spend a larger computation time. Thus, in order to compromise with no loss of information value and the smaller computation time the bin size has been chosen to be around the standard deviation of the average system temperature.
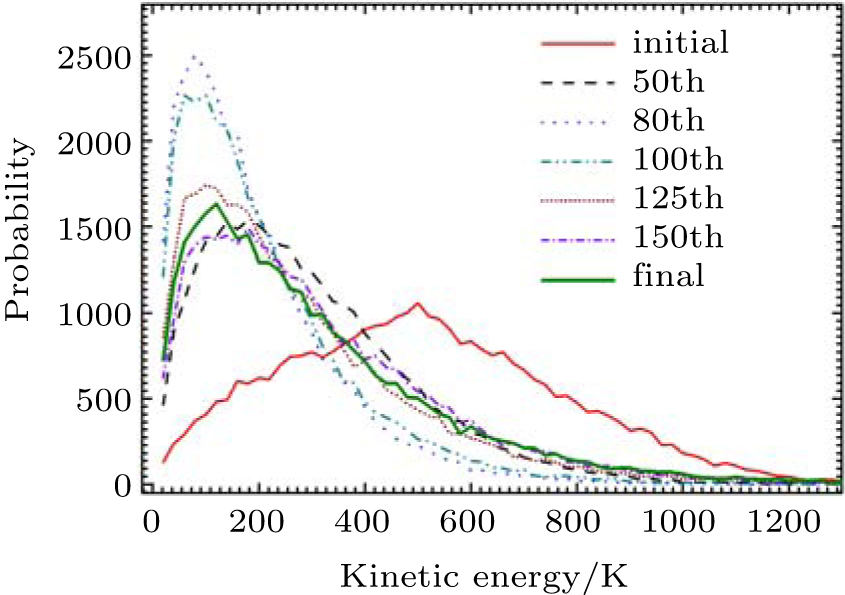 | Fig. 2. The probability distribution function of the kinetic energy (expressed in terms of temperature) of Cu atoms at initial, final, and at five different time steps. |
At each time step the KE spectrum of the atoms are divided into 200 bins (130 bins for solid Ar) with each bin corresponding to KE of 20 K (5 K for solid Ar) in oder to get the histogram of the KE spectrum. The probability distribution of KE of Cu atoms expressed in terms of temperature during the process of equilibration are shown in Fig. 2.
After making the normalization 
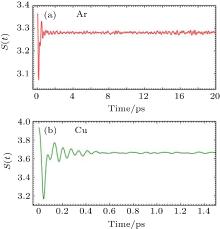
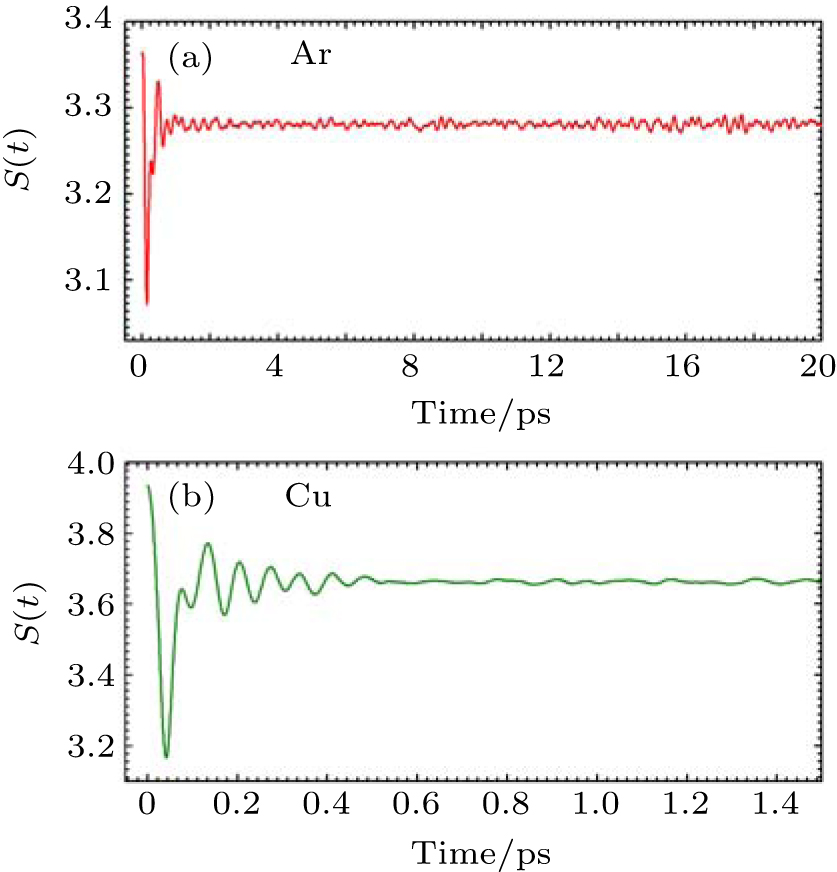 | Fig. 3. Variation of the Shannon entropy with time of (a) Ar and (b) Cu during the course of equilibration. |
Ensemble of atoms in a crystal when brought to nonequilibrium state by enhancing the KE of the atoms from their equilibrium values, equilibrate by diffusing their excess KE. This diffusion process is governed by the various forces acting on the atoms. The force arising from the nearest neighbor interaction potential plays the role of an external force on the atom. There will be an energy exchange between the atom and surrounding atoms, which may cause the atom to lose a part of its KE. A loss of KE also occurs because of its conversion to PE in the ensemble of atoms. There will be a force acting on the atom arising from the interactions from all other atoms in the cell. Because of their thermal vibrations, the net force will be random. The effect of these forces results in a change in the KE of the atoms and consequently in the PDF. The PDF changes with time and ultimately equilibrates to the stable time invariant distribution. The variation of the PDF of KE can be a measure of the dynamical process of equilibration. In this regard, Shannon entropy S(t) is evoked and it has been calculated at each time step.
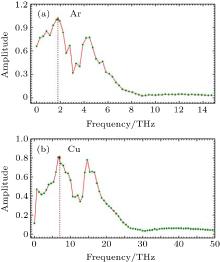
The Shannon entropy oscillates (Fig. 3) around the equilibrium value during the process of equilibration. Thus, high and low values of the Shannon entropy do not necessarily signify any stable state of the system but the invariance of the Shannon entropy with time suggests the attainment of equilibrium. Thus, in equilibrium of any dynamical system Shannon entropy is a constant of motion. Fast Fourier Transformation (FFT) of the time evolution of the Shannon entropy shows a frequency spectrum having two major peaks, as shown in Fig. 4. The first peak is closed to the Debye frequency of the element concerned, as shown in Table 2.
| Table 2. Frequencies of the first peak observed from the Fast Fourier Transform of Shannon entropy of the elements and their respective Debye frequencies. |
In the study of the statistical interpretation of the relaxation process of nonequilibrium systems, Boltzmann entropy plays the most important role and it attains the maximum value at equilibrium. However, Boltzmann entropy cannot be estimated based on the concept of probabilities as defined in the field of statistics and is also difficult to measure in numerical studies. Thermodynamic probability or the statistical weight of a micro-state that reflects the Boltzmann entropy is not a probability as defined in the conventional statistics.[15] Hence, in our numerical studies of the relaxation process we are compelled to evoke the Shannon entropy to understand the dynamics. Shannon entropy is a measure of uncertainty[4] and is a positive function of pis. Its extreme values are for the cases when all pis are equal with S = logN and S= 0 when the system is uniquely defined with sharped peak at one of the pis equal to 1.
 | Fig. 4. FFT of Shannon entropy of (a) Ar and (b) Cu. |
When the system is far away from the equilibrium normalized values of probability in the respective bins are much different from the equilibrium values (Fig. 2). When the system is allowed to relax the values of probabilities start oscillating in such a way that these coupled oscillators reach the final destination correspond to the equilibrium distribution. The behavior of the PDF at different time steps (Fig. 2) shows that, initially the distribution starts peaking at the low temperature side in an attempt to approach the equilibrium distribution. At the 80th time step (for Cu) it peaked maximum and the corresponding Shannon entropy goes to minimum. However, because the coupled oscillating probabilities in the bins do not reach the equilibrium distribution, it again starts flattening making the Shannon entropy to increase. This cumulative oscillation among the bins persists but its amplitude decays with time as long as it reaches the equilibrium distribution making the Shannon entropy as a constant of motion. These are the dynamics of these equilibrium processes.
In this micro-canonical ensemble, whenever the KE is exchanged between the atoms it generates a different micro-state for a given macro-state. This energy exchange is also responsible for the oscillations of the probabilities in the bins. These oscillators when coupled together generate higher modes of oscillations along with their fundamental frequency. Because of these coupled oscillators we get the frequency spectrum of the time dependence of the Shannon entropy. We presume that the observed first peak in the frequency spectrum is the Debye frequency and is one of the primary frequencies responsible for the transfer of probabilities between the bins.
One of the characteristics of the nonequilibrium systems is that the PDF associated with the systems are necessarily time-dependent. Because of this time dependence, it is difficult to find any general analytical formalism to deal with its dynamics. The time evolution of pis is governed by the master equation. However, it is extremely difficult to solve it numerically because of associated large degrees of freedom. In our attempt, we could justify the evolution dynamics of nonequilibrium systems by studying the time evolution of their respective Shannon entropy and we could conclude that the time variation is primarily dictated by two frequencies and one of them is the Debye frequency.
The motivating significance of this work is the oscillating nature of Shannon entropy. The common idea about an isolated system is that it is not in equilibrium when any quantity, and in particular the quantity ∫ p(E, t) log p(E, t) dE, changes systematically with time.[16] Irrespective of the initial values of the probabilities of the bins, the quantity ∫ p(E, t) log p(E, t) dE tends to decrease as long as the probability distribution acquires a form to achieve a minimum ∫ p(E, t) log p(E, t) dE value. The final distribution is the most probable one and leads to the equilibrium of the system. Application of a little disturbance perturbs the probability distribution having an occurrence probability much smaller than the most probable one, and the value of the quantity ∫ p(E, t) log p(E, t) dE again increases. The small occurrence probability ensures the nonequilibrium state of the system after the introduction of disturbance. In our work we have, for the first time, noticed a contradictory property of nonequilibrium system which establishes that Shannon entropy does not always monotonically decrease during the equilibration process.
| 1 |
|
| 2 |
|
| 3 |
|
| 4 |
|
| 5 |
|
| 6 |
|
| 7 |
|
| 8 |
|
| 9 |
|
| 10 |
|
| 11 |
|
| 12 |
|
| 13 |
|
| 14 |
|
| 15 |
|
| 16 |
|