Effect of focused ultrasound stimulation at different ultrasonic power levels on the local field potential power spectrum
[Yuan Yi†a)  , Lu Cheng-Biao
a) , Li Xiao-Li‡a), b) ]
, Lu Cheng-Biao]
|
|


†Corresponding author. E-mail: yuanyi513@ysu.edu.cn
‡Corresponding author. E-mail: xiaoli@bnu.edu.cn
*Project supported by the National Natural Science Foundation of China (Grant No. 61273063), China Postdoctoral Science Foundation (Grant No. 2013M540215), and the Natural Science Foundation of Hebei Province, China (Grant No. F2014203161).
Local field potential (LFP) signals of the rat hippocampus were recorded under noninvasive focused ultrasound stimulation (FUS) with different ultrasonic powers. The LFP mean absolute power was calculated with the Welch algorithm at the delta, theta, alpha, beta, and gamma frequency bands. The experimental results demonstrate that the LFP mean absolute power at different frequency bands increases as the ultrasound power increases.
Neuromodulation or brain stimulation techniques that are now available in clinics[1– 3] include deep brain stimulation (DBS), [3, 4] epidural cortical stimulation (ECS), [5] vagus nerve stimulation (VNS), [6] cranial electrotherapy stimulation (CES), [7] trigeminal nerve stimulation (TNS), [8] transcranial direct current stimulation (tDCS), [9] and repetitive transcranial magnetic stimulation (rTMS).[10, 11] Although multiple brain stimulation techniques have been developed, they all face inherent limitations in their applications. For example, deep brain stimulation (DBS) requires complex neurosurgery and is invasive; epidural cortical stimulation (ECS), vagus nerve stimulation (VNS), and transcranial direct current stimulation (tDCS) all have poor spatial resolution; repetitive transcranial magnetic stimulation (rTMS), although noninvasive due to the inductive nature of magnetic stimulation, has a focal spot size of several centimeters and cannot be used for deeper brain stimulation. Therefore, novel brain stimulation methods that can overcome these limitations are under intensive investigation. Among these new methods, a low-intensity focused ultrasound stimulation (FUS) has been proven to have noninvasiveness, high spatial resolution, and deep penetration.[12– 14]
Previous studies using FUS in animal and human experiments have shown that low-intensity ultrasound has the ability to modify the excitability of neuronal tissue.[15– 17] This effect has been further investigated by using focused ultrasound to modulate the function of regional brain tissue in mice and rabbits, as well as monkeys’ visuomotor behavior, and the activity of the primary somatosensory cortex of humans.[18] However, the relationship between the local field potential (LFP) power spectrum and ultrasonic power during FUS is still not fully understood. An important key parameter in neuromodulation, the LFP power spectrum can provide the LFP energy intensity of brain rhythms at different frequency bands. Therefore, a better understanding of the relationship between the LFP power spectrum and ultrasonic power is important as a basis for studying the effects of FUS on neuromodulation and providing a reference for setting ultrasonic power during FUS.
In the present paper, the relationship between ultrasonic power and the LFP power spectrum at the delta, theta, alpha, beta, and gamma frequency bands were extensively studied. As a control (CTRL), the LFP signals of the rat hippocampus were first recorded without FUS. After the LFP signals were recorded without FUS, the signals at the same position were recorded under FUS at various ultrasonic powers. The LFP power spectrums at delta, theta, alpha, beta or gamma frequency bands were calculated by the Welch algorithm.
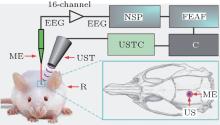
To evaluate the effect of ultrasonic power on the LFP power spectrum, we built an FUS system with LFP recording capability. The schematic diagram of the experimental system is shown in Fig. 1. An ultrasonic transmitter and receiver card (USB-UT350T, Ultratek, USA) was used to output a pulse signal to the focused ultrasound transducer. The ultrasound transducer has a center frequency of 2.5 MHz, bandwidth of 50% and focal length of 5 mm. The LFP signals from the hippocampus were captured by a microelectrode (GBMA-S16, Blackrock Microsystems USA) and amplified by a 128-channel front-end amplifier (Cerebus, 128 channels, Blackrock Microsystems, USA). The analog signals were converted into digital by a 128-channel neural signal processor (Cerebus128 channels, Cyberknetics) and then transmitted to a computer for data analysis. The data were digitized at a sample rate of 30 kHz, and a low-pass filter with a 250-Hz cutoff frequency for the LFP was set in the Cerebus system.
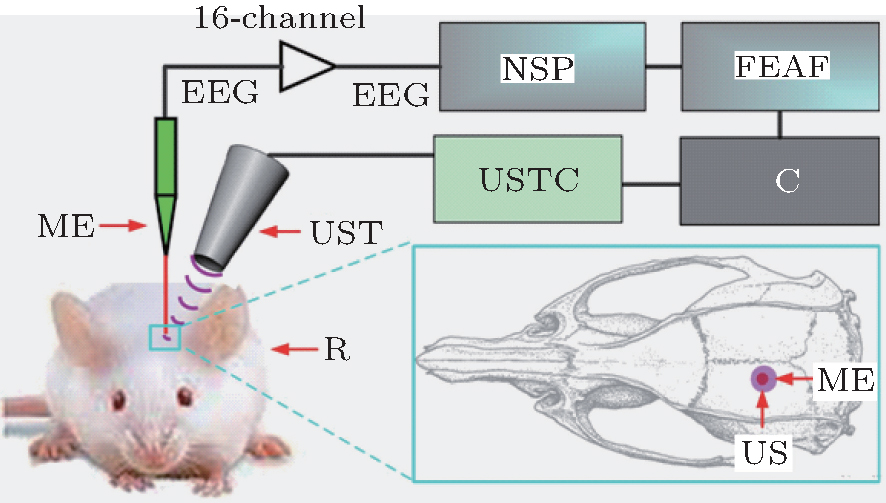 | Fig. 1. Schematic diagram of the experiment setup. An ultrasonic transmitter and receiver card output a pulse signal to the focused ultrasound transducer. The focused ultrasonic wave from the transducer passes through the ultrasonic coupling medium and stimulates the brain tissue. The LFP signals from the hippocampus are captured by the 16-channel microelectrode and amplified by the 128-channel front-end amplifier. The analog signals are converted into digital signals by a 128-channel neural signal processor and then transmitted to the computer. (C: computer, NSP: neural signal processor, USTC: ultrasonic transmitter card, FEAF: front-end amplifier, ME: microelectrode, US: ultrasound, UST: ultrasound transducer, R: rat, EEG: electroencephalogram). |
In the experiment, the pulse repetition frequency of the ultrasound was 500 Hz, the cycles per ultrasound pulse were four and one stimulus pulse contained 80 ultrasound pulses. The duration of the ultrasound stimulation and pulse durations are 160 ms and 1.6 μ s. The spatial-peak pulse-average intensities (ISPPA) of the ultrasound were measured by an ultrasonic sound power measuring instrument (YP0511F, Hangzhou) and they were 1.2 W/cm2, 2.5 W/cm2, 4 W/cm2, 9.8 W/cm2, and 19.2 W/cm2. The corresponding spatial-peak temporal-average intensities (ISPTA) were 0.96 mW/cm2, 2 mW/cm2, 3.2 mW/cm2, 7.84 mW/cm2, and 15.36 mW/cm2.
A total of five Sprague– Dawley rats (three month-old males) with body weights of ∼ 250 g were used in this study. All procedures were carried out in accordance with the Animal Ethics and Administrative Council of Yanshan University and Hebei Province, China, and all efforts were made to minimize both the animals’ suffering and the number of animals used. Surgical anesthesia was induced with sodium pentobarbital (3%, 5 mg/100 g, IP). The anesthetized rats were fixed on the stereotaxic apparatus (ST-5ND-C, Stoelting Co, USA) with ear bars and a clamping device. The fur near the rats’ brain was shaven, and the skin was cleaned with 0.9% sodium chloride physiological solution. The location of the hippocampus was determined according to the rat brain atlas. The skin was cut along the midline of the skull, and the subcutaneous tissue and periosteum were then cleaned. A section of skull was removed to expose the brain tissue with an area approximately 0.5 cm × 0.5 cm. After completion of the surgical procedures, a microelectrode (GBMA-S16, Blackrock Microsystems USA) was inserted into the hippocampus.
In the ultrasound stimulation experiment, the anesthetized rats were fixed on the stereotaxic apparatus (ST-5ND-C, Stoelting Co, USA) with ear bars and a clamping device. The ultrasound transducer secured to a fixture was aimed at the location of the rat hippocampus. The space between the brain and ultrasound transducer was filled by medical ultrasound gel as an ultrasonic coupling medium. The focused ultrasonic wave, which passed through the ultrasonic coupling medium, stimulates the brain tissue for noninvasive brain neuromodulation.
We use Welch’ s periodogram method to estimate the LFP power spectrum. Welch’ s method is an averaging modified periodogram to estimate the power spectrum. The method was used to analyze the LFP power spectrum with data segments, adding window functions and averaging data. The LFP data were separated into K segments and each segment contains the sampling points L, shifted by a fixed delay D:

t = 0, … , L − 1; k = 0, … , K − 1. Each segment of data is multiplied by the window function w(t), t = 0, … , L − 1, for a discrete Fourier transform that follows the equation:
The LFP power spectrum for the k-th segment can be expressed as

Therefore, the LFP power spectrum of the whole signal can be expressed as

where

In this study, we set the window to a Hamming window with width of 3 × 10⁴ points and overlap of 2.9 × 10⁴ points. Charts of the LFP mean absolute power at delta [1 Hz, 4 Hz), theta [4 Hz– 8 Hz), alpha [8 Hz– 12 Hz), beta [12 Hz– 32 Hz), and gamma [32 Hz– 100 Hz] frequency bands were drawn by Origin software. The time frequency diagram was calculated by shorttime Fourier transforms with a Hamming window, and the parameters setting is the same as that for the Welch method.
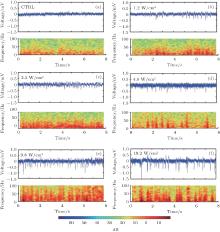
To demonstrate the effect of various levels of ultrasonic power on the LFP power spectrum, the LFP signals from the hippocampus were recorded under different ultrasonic powers and their corresponding power spectra were computed. The LFP signals in CTRL and FUS statuses with different ultrasonic powers (1.2 W/cm2, 2.5 W/cm2, 4 W/cm2, 9.8 W/cm2, 19.2 W/cm2) are shown in Figs. 2(a)– 2(f) (see chart above). The mean absolute amplitude of the LFP were 0.044 mV (CTRL), 0.062 mV (1.2 W/cm2), 0.063 mV (2.5 W/cm2), 0.069 mV (4.0 W/cm2), 0.081 mV (9.8 W/cm2), and 0.089 mV (19.2 W/cm2), respectively. We can clearly observe that the amplitude of the LFP signal with FUS is higher than that of the control. By comparing the amplitude of the LFP signal under FUS with different ultrasonic powers, we found that the amplitude of the LFP signal increased with the increase of ultrasonic power. The corresponding time-frequency diagrams of the LFP signals are also shown in Figs. 2(a)– 2(f) (see chart below), and we found that the LFP power with FUS is higher than that of the CTRL, especially in high frequency bands.
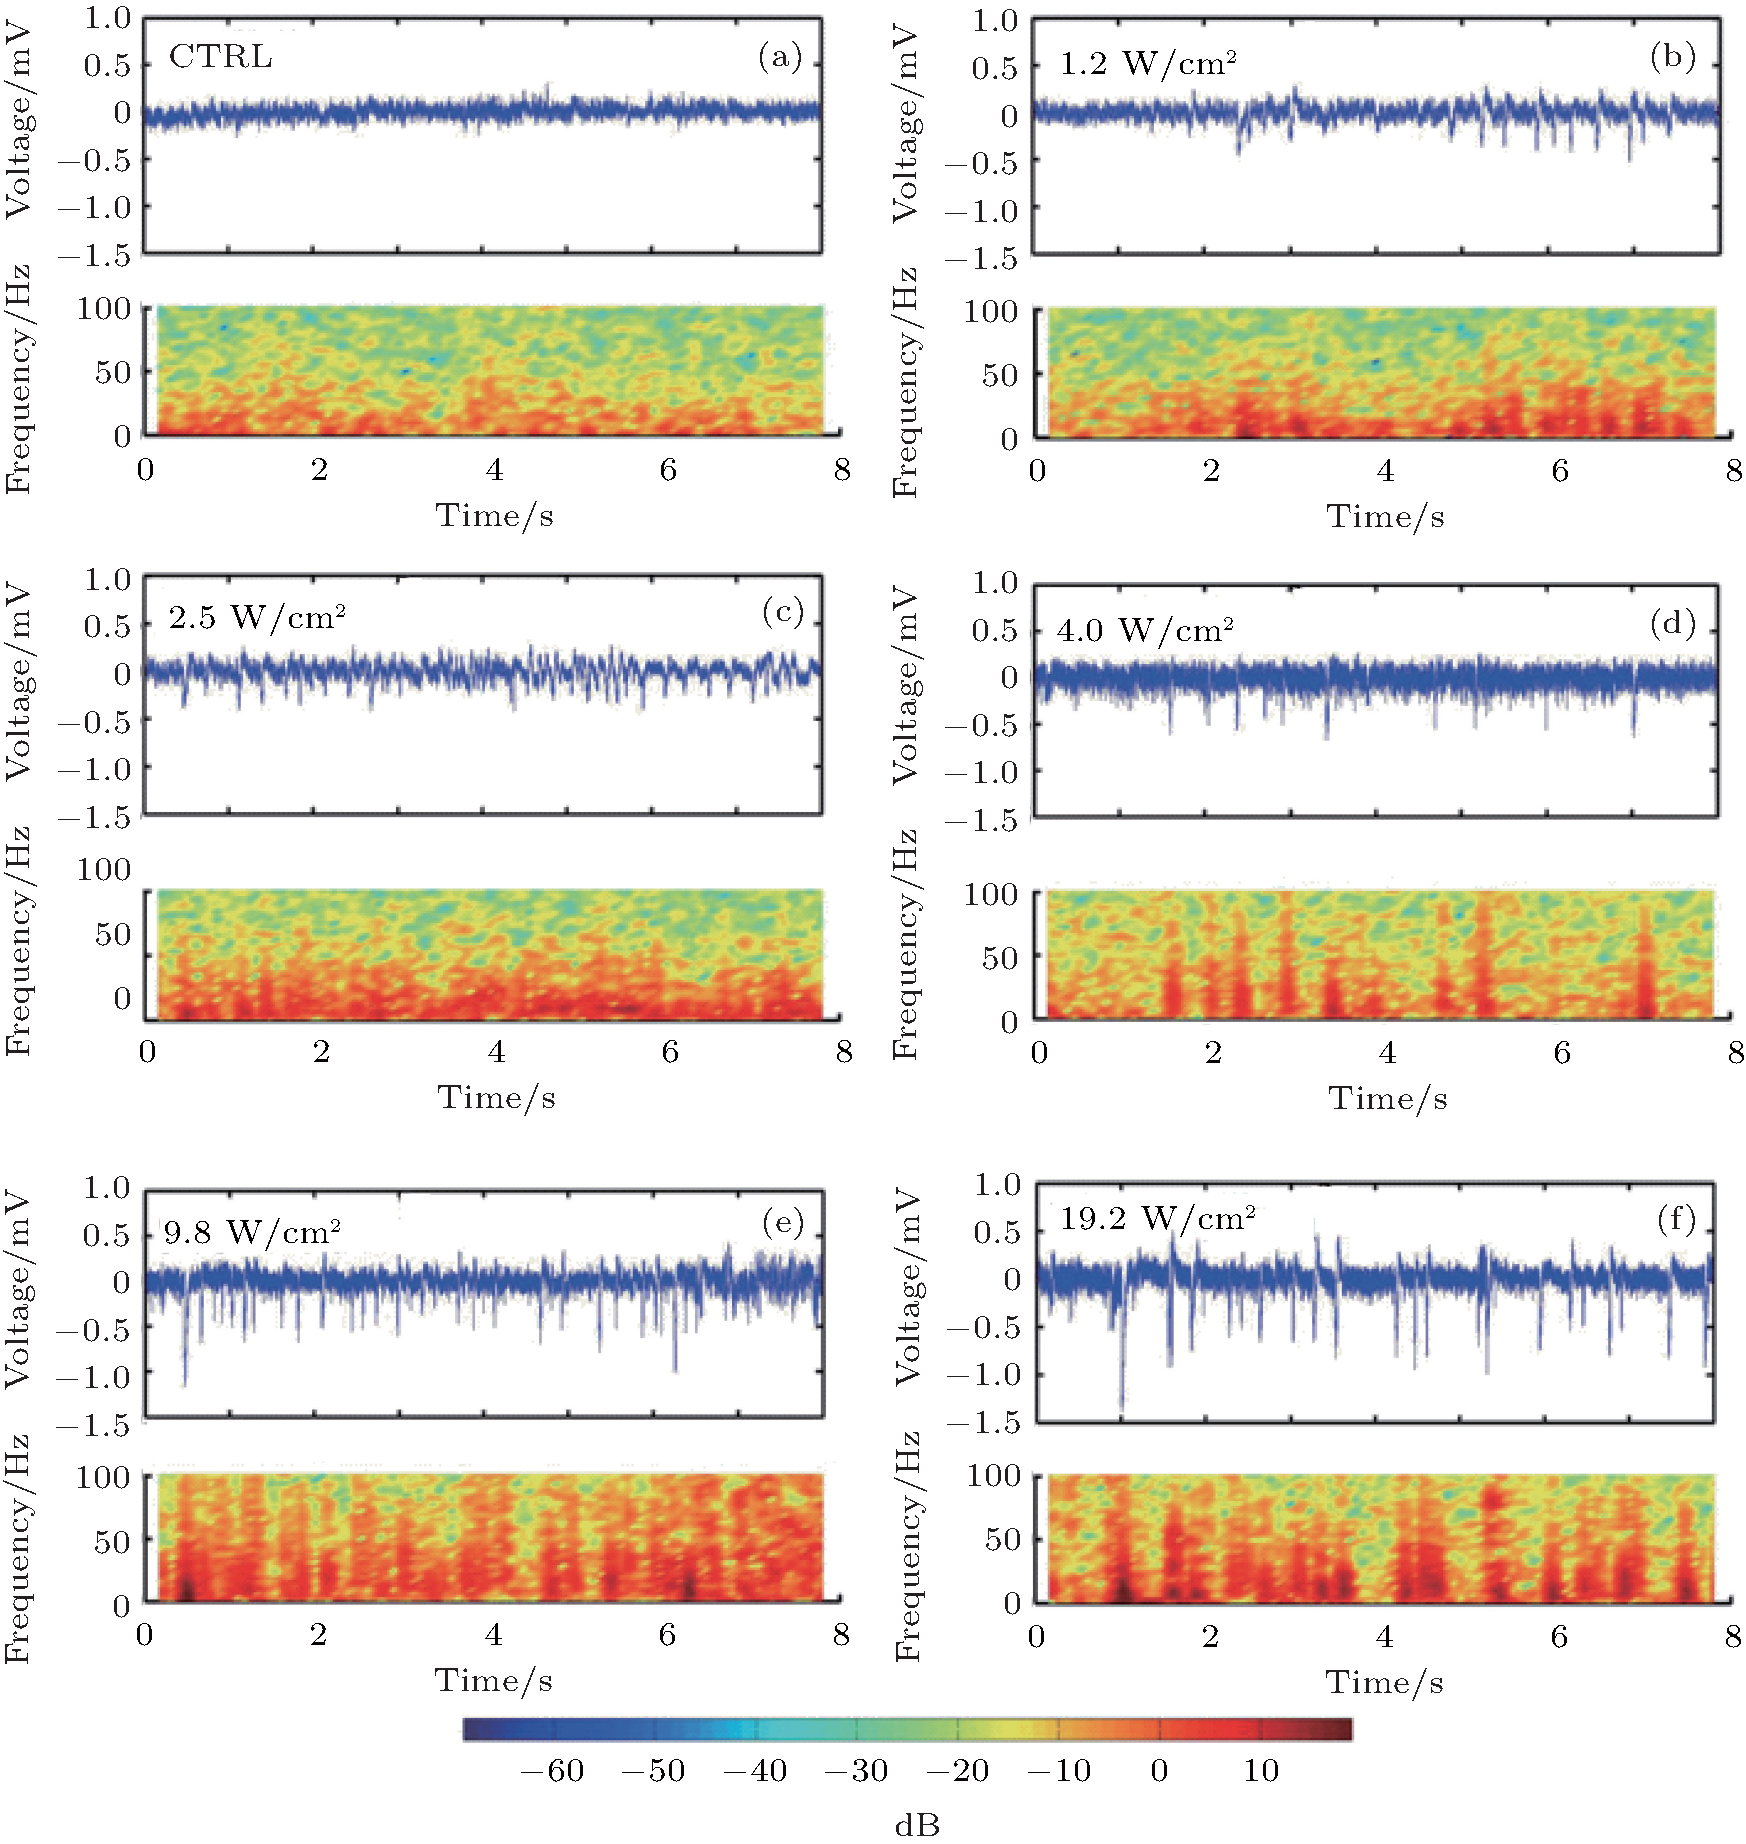 | Fig. 2. LFP signals and corresponding time-frequency diagram for the control conditions and under FUS at different ultrasonic power levels. (a) Control, (b) 1.2 W/cm2, (c) 2.5 W/cm2, (d) 4 W/cm2, (e) 9.8 W/cm2, (f) 19.2 W/cm2. |
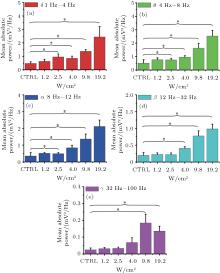
To further verify the effect of ultrasonic power on the LFP power spectrum, we quantitatively computed the LFP mean absolute power at delta (δ ), theta (θ ), alpha (α ), beta (β ), and gamma (γ ) frequency bands with different ultrasonic powers (n = 5, mean± s.e.m, * p < 0.05, t-test). The results of the mean absolute power at different frequency bands are shown in Figs. 3(a)– 3(e). We found that the intensity of the mean absolute power increased with FUS in all frequency bands, whereas the intensity of the mean absolute power increased with the increase of ultrasonic power. As can be observed from the results, when the ultrasonic powers were 1.2 W/cm2 and 2.5 W/cm2, the ratios were approximately equal in the δ , θ , α , β or γ frequency bands. When the ultrasonic power reached 4 W/cm2, the mean ratios were higher than at 1.2 W/cm2 and 2.5 W/cm2. By comparing the intensity of the LFP mean absolute power under FUS with different ultrasonic powers, all of the results demonstrate that ultrasonic power can affect the intensity of the LFP mean absolute power.
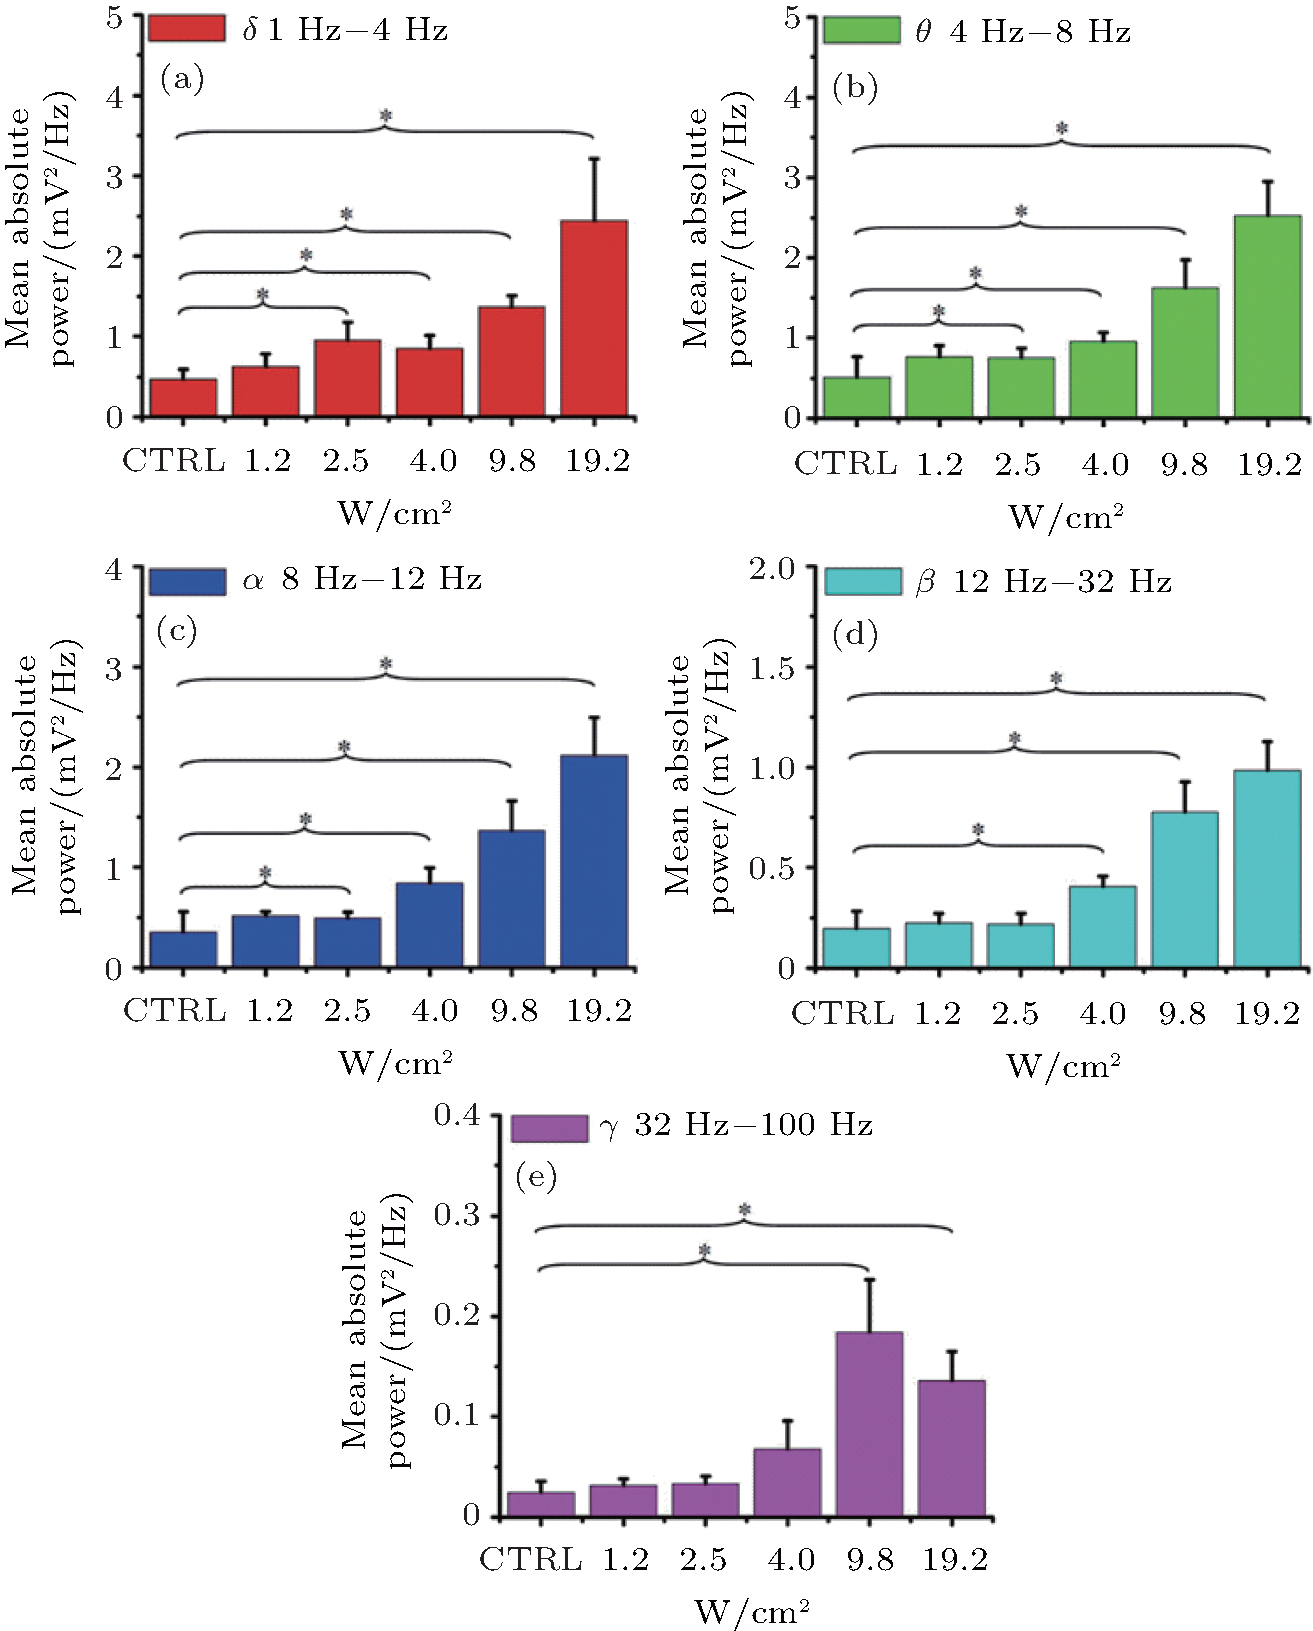 | Fig. 3. LFP mean absolute power at delta (δ 1 Hz– 4 Hz), theta (θ 4 Hz– 8 Hz), alpha (α 8 Hz– 12 Hz), beta (β 12 Hz– 32 Hz), and gamma (γ 32 Hz– 100 Hz) frequency bands with different ultrasonic power levels: 1.2 W/cm2, 2.5 W/cm2, 4 W/cm2, 9.8 W/cm2, 19.2 W/cm2 (n = 5 mean± s.e.m, * p < 0.05, t-test). (a) δ 1 Hz– 4 Hz, (b) θ 4 Hz– 8 Hz, (c) α 8 Hz– 12 Hz, (d) β 12 Hz– 32 Hz, (e) γ 32 Hz– 100 Hz. |
Electroencephalogram (EEG) is a widely used technique for the visualization of brain activity. It has been suggested that power spectrum can be used to evaluate the effects of a nerve stimulation protocol.[19] Power spectrum analysis has a strong reference value for brain stimulation and can estimate the extent of stimulation or inhibition of excitement. We investigated the relationship between the LFP power spectrum and ultrasonic power. The main finding of our study is an increase in the LFP power of δ , θ , α , β or γ frequency bands with the increase of ultrasonic power. The results can help us to optimize ultrasonic power in FUS.
In a previous study, ultrasound with frequencies of 0.35 MHz– 0.5 MHz was used in the experiment to enhance the penetration depth. We used ultrasound with a frequency of 2.5 MHz to stimulate rat brain tissues in this study. It is known that a frequency of 2.5 MHz is not likely to be useful for stimulation for human applications because skull absorption and scattering increases strongly. However, to enhance the special resolution, we used the frequency of 2.5 MHz to stimulate brain tissues because the radius of the ultrasonic focal spot is proportional to 1/f, where f is the frequency of the ultrasound.
Ultrasound is widely used in biology and medicine.[20– 22] In our study, we quantitatively analyzed the effect of FUS with different ultrasonic powers on the LFP power spectrum at different frequency bands. It will play an important role in setting the parameters of ultrasound in future FUS work. Other ultrasonic parameters, including the center frequency, stimulus frequency, pulse width, and number of cycles, may also affect the LFP mean absolute power. For our own future work, we will evaluate the effect of other ultrasonic parameters on the LFP power spectrum.
In summary, the rat hippocampus was stimulated by low-intensity focused ultrasound with different powers. The LFP signals before and during FUS were recorded and analyzed. The LFP mean absolute power was calculated to evaluate the effect of ultrasonic power on the LFP power spectrum. The experimental results indicate that the LFP mean absolute power at different frequency bands increases with increasing ultrasonic power. These results will help to optimize ultrasonic power in FUS work.
| 1 |
|
| 2 |
|
| 3 |
|
| 4 |
|
| 5 |
|
| 6 |
|
| 7 |
|
| 8 |
|
| 9 |
|
| 10 |
|
| 11 |
|
| 12 |
|
| 13 |
|
| 14 |
|
| 15 |
|
| 16 |
|
| 17 |
|
| 18 |
|
| 19 |
|
| 20 |
|
| 21 |
|
| 22 |
|