

Molecular dynamics simulation on generalized stacking fault energies of FCC metals under preloading stress
[Zhang Liang, Cheng Lü† , Kiet Tieu, Zhao Xing, Pei Lin-Qing, Guillaume Michal]
, Kiet Tieu, Zhao Xing, Pei Lin-Qing, Guillaume Michal]
|
|


†Corresponding author. E-mail: chenglu@uow.edu.cn
*Project supported by Australia Research Council Discovery Projects (Grant No. DP130103973). L. Zhang, X. Zhao and L. Q. Pei were financially supported by the China Scholarship Council (CSC).
Molecular dynamics (MD) simulations are performed to investigate the effects of stress on generalized stacking fault (GSF) energy of three fcc metals (Cu, Al, and Ni). The simulation model is deformed by uniaxial tension or compression in each of [111], [11-2], and [1-10] directions, respectively, before shifting the lattice to calculate the GSF curve. Simulation results show that the values of unstable stacking fault energy ( γusf), stable stacking fault energy ( γsf), and unstable twin fault energy ( γutf) of the three elements can change with the preloaded tensile or compressive stress in different directions. The ratio of γsf/ γusf, which is related to the energy barrier for full dislocation nucleation, and the ratio of γutf/ γusf, which is related to the energy barrier for twinning formation are plotted each as a function of the preloading stress. The results of this study reveal that the stress state can change the energy barrier of defect nucleation in the crystal lattice, and thereby can play an important role in the deformation mechanism of nanocrystalline material.
The mechanisms of plastic deformation of nanocrystalline materials have been widely studied because of their proven superior functional and mechanical properties.[1– 4] The plastic deformation of conventional coarse-grained material is caused mainly by dislocation nucleations and their motions in the interior of grains. However, nanoscale confinement severely restricts the operations of traditional dislocation generation mechanisms in nanocrystalline materials. Both experiment[5– 7] and molecular dynamics (MD) simulations[8– 10] have reported a deviation from traditional Hall– Petch constitutive behavior. Many studies[11– 14] have indicated that the dislocation activities in the interior of grain lessen when the average grain size is less than 100 nm, whereas mechanisms mediated by the grain boundary (GB) become dominant. For example, a small grain size can result in heterogeneous nucleation and emission of dislocations from GBs.[15– 17] Yamakov et al.[18] proposed a deformation mechanism map that describes the transition from dislocation-driven to GB-mediated plastic deformation based on the splitting distance between partial dislocations and the stacking fault energy γ sf. Van Swygenhoven et al.[19] revealed that stacking fault energy γ sf alone cannot capture the important physics of the nucleation of partial dislocations from GBs, and a correct explanation of the nature of slip in nanocrystalline metal requires the generalized stacking fault energy (GSF) curve that was introduced first by Vitek, [20, 21] involving both stable stacking fault energy γ sf and unstable stacking fault energy γ usf.
A study of stacking fault energy can help to better understand the slip behavior in nanocrystalline material and, thereby, to understand how to improve its mechanical properties. It is desirable to know the shape of the entire GSF curve in order to use it in a criterion for nucleation. Since only a single point known as the intrinsic (or stable) stacking fault can be measured experimentally, many efforts to calculate this curve are based on modeling and simulation methods, such as density functional theory (DFT) and molecular dynamics (MD). However, most of the previous simulation studies in calculating GSF are conducted in undeformed or stress free crystal structures, which is far from the actual situation where the micro- or nano-components can be deformed under multiple stress state. The preloading strain or stress on crystal structures are determined to significantly influence the GSF curve. For instance, Zimmerman et al.[22] observed that the unrelaxed γ usf value of 175 mJ/m2 was reduced to 99 mJ/m2 after biaxially stretching the lattice by 4% when calculating the GSF curve of Cu. Tschopp and McDowell[23] used MD simulations to investigate the influence of normal stress on the GSF curve in Cu, they found that the compressive (tensile) normal stress increases (decreases) the unstable stacking fault energy γ usf, while the stable stacking fault energy γ sf changes in an opposite manner. In addition, the stress influence on GSF curve is not limited in the normal direction of the slip plane, and the lateral stress can also influence the value of generalized stacking fault energy. Ogata and Yip[24] used DFT calculations of stacking fault energies for Al and Cu to study their ideal shear strengths. Their results indicated that the hydrostatic pressure has a significant effect on the critical resolved shear stress on an atomic scale. Further, Tschopp et al.[25] and Spearot et al.[26] proposed that the stress required for dislocation nucleation depends on both Schmid stress component (resolved shear stress in the slip direction) and non-Schmid stress component (resolved normal stress and resolved shear stress perpendicular to the slip direction) acting on the {111} slip plane. Our previous work[27, 28] also showed that the effect of stress state can play an important role in dislocation nucleation and fracture of nanocrystalline Cu.
All of the described studies show that the GSF curve can be affected by the magnitude and direction of the applied stress. In a previous study, Rice[29] indicated that unstable stacking fault energy γ usf of the GSF curve was related to the energy barrier for dislocation nucleation. Hai and Tadmor, [30] and Tadmor and Hai[31] developed a criterion for the deformation mechanism of mechanical twinning, and they found that the ‘ twinning tendency’ was closely related to the unstable twin fault energy γ usf of the GSF curve. In this sense, the energy barriers of both dislocation nucleation and twinning formation in crystals can be influenced by the stress state of crystal lattice. In the present work we carry out MD simulations to investigate the effects of preloading stress with different directions and magnitudes on the GSF curves of three fcc metals (Cu, Al, and Ni). The values of unstable stacking fault energy (γ usf), stable stacking fault energy (γ sf), and unstable twin fault energy (γ utf) are considered.
Simulations are performed by the parallel MD code LAMMPS.[32] The embedded atom method (EAM) potential is used in the MD simulations. The EAM method defines the total energy of an elemental system, which is expressed as

where V(rij) is a pair potential as a function of distance rij between atoms i and j, and F(ρ i) is the embedding energy as a function of host electron density ρ i induced at site i by all other atoms in the system. In this study, EAM potentials developed by Mishin et al. for Cu, [33] Al, [34] and Ni[35] are used. These well-defined potentials are widely used in the MD simulations and they can fit a large set of experimental and first-principles data. For example, the intrinsic (stable) stacking fault energy γ sf and unstable stacking fault energy γ usf of Cu from their simulation result are 44.4 mJ/m2 and 158 mJ/m2, respectively, [33] which are very close to the experimental values of 45 mJ/m2[36] and 162 mJ/m2.[33] Similarly for Al, Zope and Mishin[34] reported an intrinsic stacking fault energy of 146 mJ/m2 and an unstable stacking fault energy of 168 mJ/m2, both of which are in agreement with the ab initio calculations performed in their work.
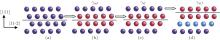
To calculate GSF using MD, a simulation model is created with [11-2], [111], and [1-10] directions and it is divided into two blocks in the normal direction (see in Fig.1). A free boundary condition is used in the normal direction ([111] direction), while a periodic boundary condition is used in the lateral directions ([11-2] and [1-10] directions). This is a similar boundary condition as that used in Ref. [37] to study the effect of vacancy defects on GSF energy of fcc metal. The GSF curve is determined by rigidly displacing the upper block in a (111) plane along a [11-2] direction while fixing the lower block and calculating the energy change in the whole simulation model. When displacing the upper block along the [11-2] direction, the lateral motion of atoms is constrained. The LAMMPS code for calculating the GSF curve of Cu in this study under stress-free condition is given in Appendix A.
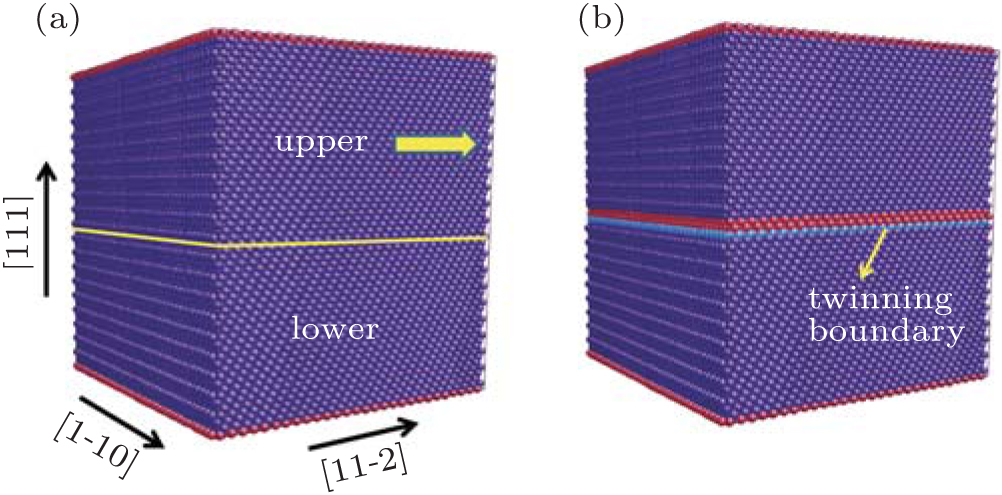 | Fig. 1. Simulation model for calculating the generalized stacking fault (GSF) energy curve. (a) The starting configuration with perfect fcc lattice. (b) A twinning boundary formed after rigidly displacing the upper block in a (111) plane along a [11-2] direction. Atoms with perfect fcc structure are colored with dark blue, the red atoms represent the stacking fault and the free surface, the light blue atoms indicate the twin fault. |
For the case of calculating γ usf and γ sf, the starting configuration is a perfect fcc lattice[22, 27] (see in Fig. 2(a)). Along the path, the system will first pass through an energy barrier that is referred to as an unstable stacking fault energy γ usf, the position of the displaced atoms is shown in Fig. 2(b). Zimmerman et al.[22] indicated that the ideal displacement of the fcc lattice when γ usf reached one-half of magnitude of the partial Burgers vector 

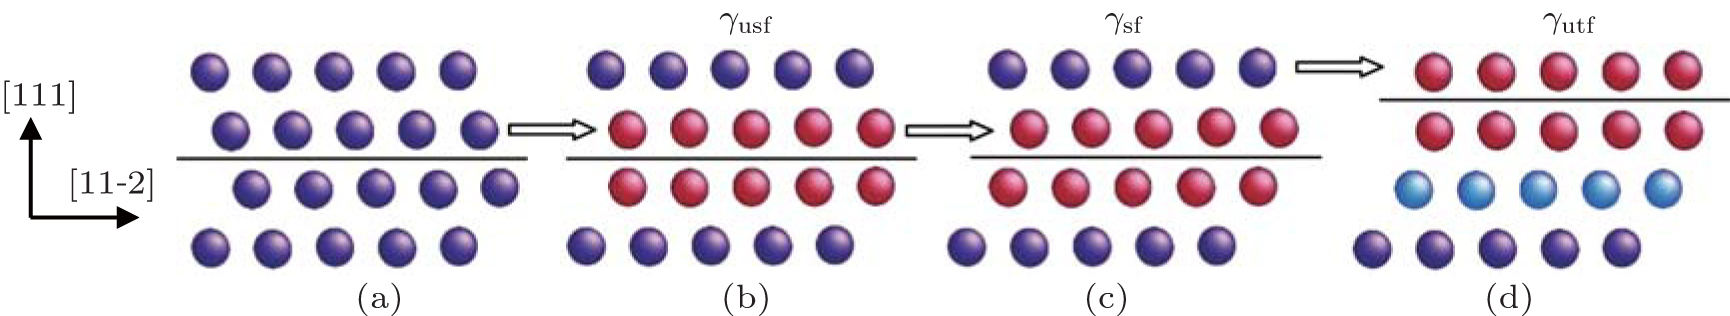 | Fig. 2. Schematic views of the atom positions when calculating the GSF curve. (a) perfect fcc crystal, (b) unstable stacking fault, (c) stable stacking fault, and (d) unstable twin fault. The configuration is viewed from the [1-10] direction. Atoms with perfect fcc structure are colored with dark blue, the red atoms represent the stacking fault, and the light blue atoms represent the twin fault. |
To simulate the influence of stress on the GSF curve, the simulation cell is uniformly strained along one of the following directions: [111], [11-2], and [1-10] with a constant rate of 108/s at 1 K before the calculation of the GSF energy in the (111) [11-2] slip system. The high strain rate is inherent in the simulations for computational efficiency to have a desired amount of deformation within a given simulation time. An isobaric-isothermal (NPT) ensemble is used during the uniaxial tensile or compression. While the strain deformation takes place in one direction, the pressures of the lateral directions are kept at zero. The system stress is attained by calculating the pressure of the entire system of atoms. The pressure is computed by the formula:

where the first term uses the components of the kinetic energy tensor and the second term uses the components of the virial tensor, N is the total number of atoms in the simulation model, V is the simulation model volume, r and f are the force vector and the distance vector respectively. System strain is derived from the positions of the periodic boundaries.
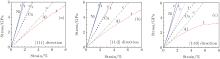
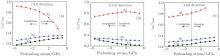
Figure 3 shows the plots of the stress– strain responses of the three investigated fcc metals (Cu, Al, and Ni) under uniaxial tension and compression along [111], [11-2], and [1-10] directions, respectively. Notice that the negative values of compressive stresses are plotted in these panels in order to compare with the values of tensile stress. Obviously, the elastic modulus shows big differences for different elements. Also, due to the material anisotropy, elastic moduli are slightly different for the same element in different directions. In addition, tension-compression asymmetries in elastic response are evident in all directions. In general, the elastic modulus of compression is higher than the value of tension, and this trend of asymmetry is more obvious for Al than for the other two elements. The elastic moduli calculated from the initial slope of the MD simulations are listed in Table1. Notice that the nonlinear elastic effect is obvious for Al in the [1-10] direction. This nonlinear stress– strain response is due to the non-negligible lattice rotation during elastic deformation at high strain.[23]
 | Fig. 3. Stress– strain curves for uniaxial tension and compression of Cu, Al, and Ni along (a) [111] direction, (b) [11-2] direction, and (c) [1-10] direction. The negative values of compressive stress are plotted. Letter t means uniaxial tension while c refers to uniaxial compression. |
| Table 1. Elastic moduli from MD simulation. |
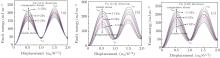
The influence of the preloading stress on the GSF curve of Cu is shown in Fig.4. In the normal [111] direction and lateral [1-10] direction, the tensile (compressive) stress reduces (increases) the unstable stacking fault energy (γ usf) and the unstable twin fault energy (γ utf), the greater the magnitude of the preloading stress, the greater the decreases (increases) of the value is. However, the stable stacking fault energy (γ sf) changes in an opposite manner in the [111] direction. The value of γ sf increases under the preloading tensile stress and decreases under the compressive stress. The effect is more noticeable at higher stress of compression. For example, γ sf increases 4.9% at 5-GPa tensile stress and reduces 17.5% at 5-GPa compressive stress. Unlike the cases in the [111] and [1-10] directions, the tensile stress increases the values ofγ usf and γ utf in the [11-2] direction while the compressive stress reduces the values. It is interesting to note that under the preloading stresses in all directions, the values of γ usf, γ sf, and γ utf may reach, before or after their ideal displacement, a value that can be expected from geometric considerations. Ideally in the figures, 


 | Fig. 4. Influence of stress on the generalized stacking fault energy curve in Cu. The tensile and compressive stresses are applied along (a) [111] direction, (b) [11-2] direction, and (c) [1-10] direction. |
Figure 5 shows the effects of stress on the GSF curve of Ni. In general, the influences of tensile and compressive stresses on the GSF curve of Ni in all directions are similar to the stress effect on Cu. In the [111] and [1-10] directions, γ usf and γ utf decrease (increase) with an increase in the magnitudes of tensile (compressive) stress, while the tensile and compressive stress’ effects are in an opposite way in the [11-2] direction. The influence of the preloading stress on GSF curve of Ni is not so obvious as that of Cu, and the deviation of the ideal displacement when each value is reached is less than that of Cu. This is due to the higher elastic modulus of Ni than that of Cu (see in Fig.3); i.e., lattice deformation and the change of the interatomic distance are both less in Ni than in Cu at the same value of the applied stress.
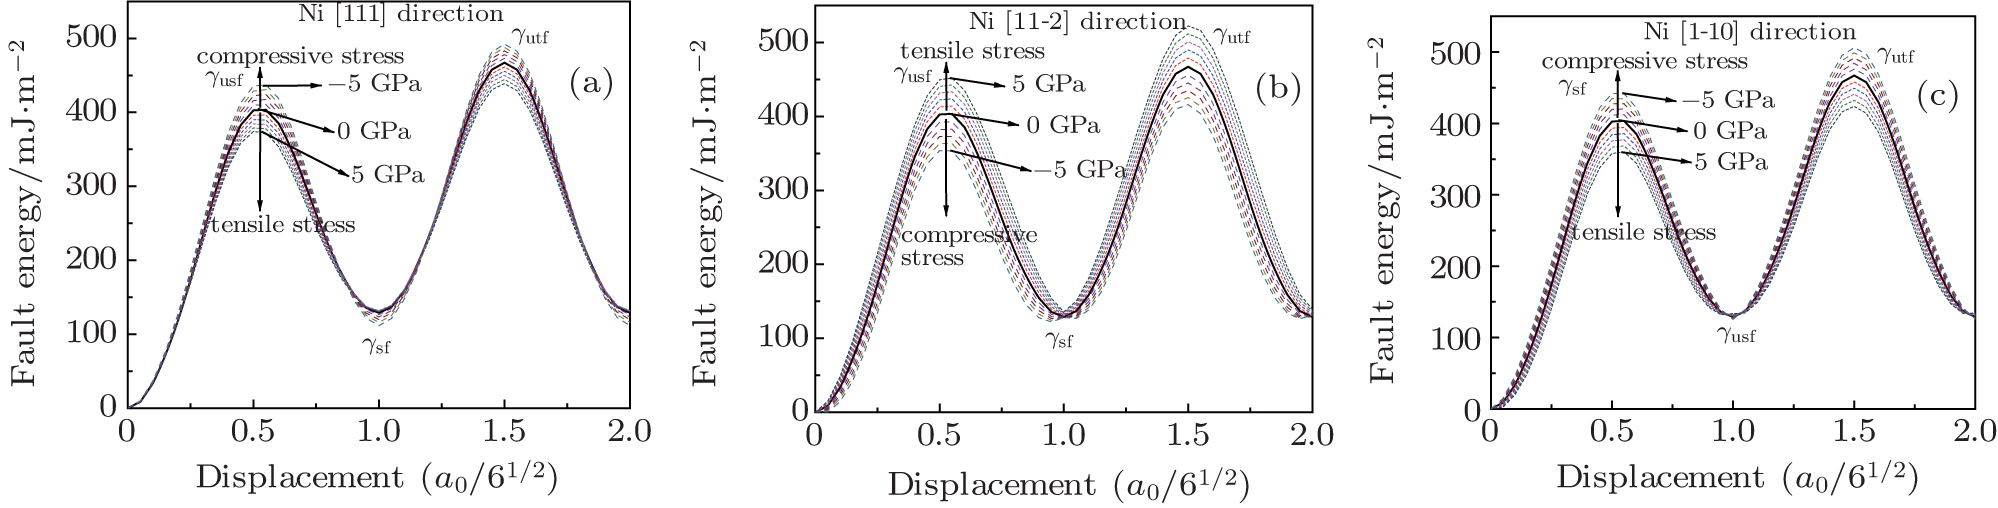 | Fig. 5. Influence of stress on the generalized stacking fault energy curve in Ni. The tensile and compressive stresses are applied along (a) [111] direction, (b) [11-2] direction, and (c) [1-10] direction. |
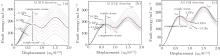
For Cu and Ni, the preloading stress has an obvious influence on the values of γ usf and γ utf, while the influence on the value of γ sf is limited. However, this is not the case of Al, the preloading stress can greatly influence on the three values in all directions, especially in the normal [111] direction. Figure 6 shows the influences of tensile and compressive stresses on the GSF curve of Al. In Fig.6(a), the values of γ usf, γ sf, and γ utf increase for 41.2%, 59.8%, and 43.3% at 5-GPa compressive stress and drops sharply for 53.5%, 82.7%, and 59.4%, respectively, at 5-GPa tensile stress. Another differences of Al from Cu and Ni in the GSF curve are observed in [1-10] direction. In Figs.4(c) and 5(c), γ usf and γ utf decrease in tension and increase in compression, while in Fig.6(c), this effect acts in an opposite manner. In addition, the applied tension stress plays a little role in the values of γ usf and γ utf in [1-10] direction, which have 1.1% and 2.3% increase, respectively, at 3-GPa tensile stress. Moreover, the values of different fault energies can change faster at a higher tensile stress in the [11-2] and [1-10] directions due to the nonlinear elastic effect in these directions of Al.
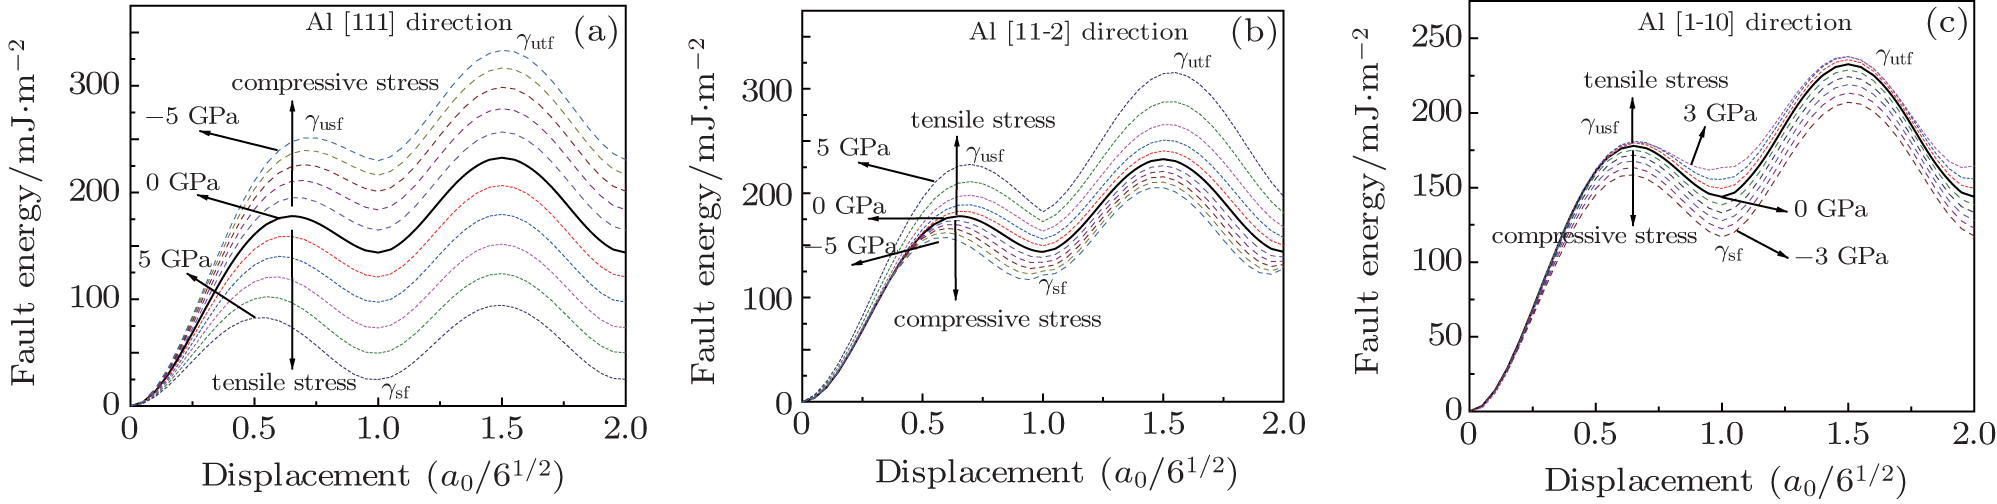 | Fig. 6. Influence of stress on the generalized stacking fault energy curve in Al. The tensile and compressive stresses are applied along (a) [111] direction, (b) [11-2] direction, and (c) [1-10] direction. |
In previous studies, MD simulations have revealed that the small gain size in nanocrystalline material can result in the heterogeneous nucleation and emission of dislocations from the GBs. The deformation mechanism has been confirmed by recent in situ transmission electron microscopic experiments in nanocrystalline Al[38] and Cu.[39] The experiments have also shown that stacking faults and deformation twins can be formed through partial dislocation emission from GBs. Van Swygenhoven et al.[19] indicated that all aspects of the GSF curve are incorporated to well understand the slip activities observed in simulations, and the deformation cannot be explained by means of the absolute value of γ sf alone, as suggested by Yamakov et al.[18] Specifically, whether extended partial dislocations or full dislocations travel through the grains dominates the deformation mechanism in a simulation can be understood in terms of the ratio γ sf/γ usf. This value closer to unity is associated with fcc material that nucleates full dislocations.
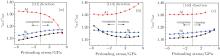
Figure 7 shows the variations of ratio γ sf/γ usf with preloading stress in different directions. For the cases of Cu and Ni, the applied tensile stress increases the value of γ sf/γ usf while the compressive stress decreases this value is in [111] and [1-10] directions. In the [11-2] direction, this effect acts in an opposite manner. Overall, the influences of the applied stress on the value ofγ sf/γ usf for Cu and Ni are not obvious. The value is at a relatively low level (ranging from 0.17 to 0.33 for Cu and 0.26 to 0.37 for Ni), which means the nucleation of partial dislocation and its propagation in the grain are still the dominant mechanism in nanocrystalline Cu and Ni, even under the condition of high stress concentration.
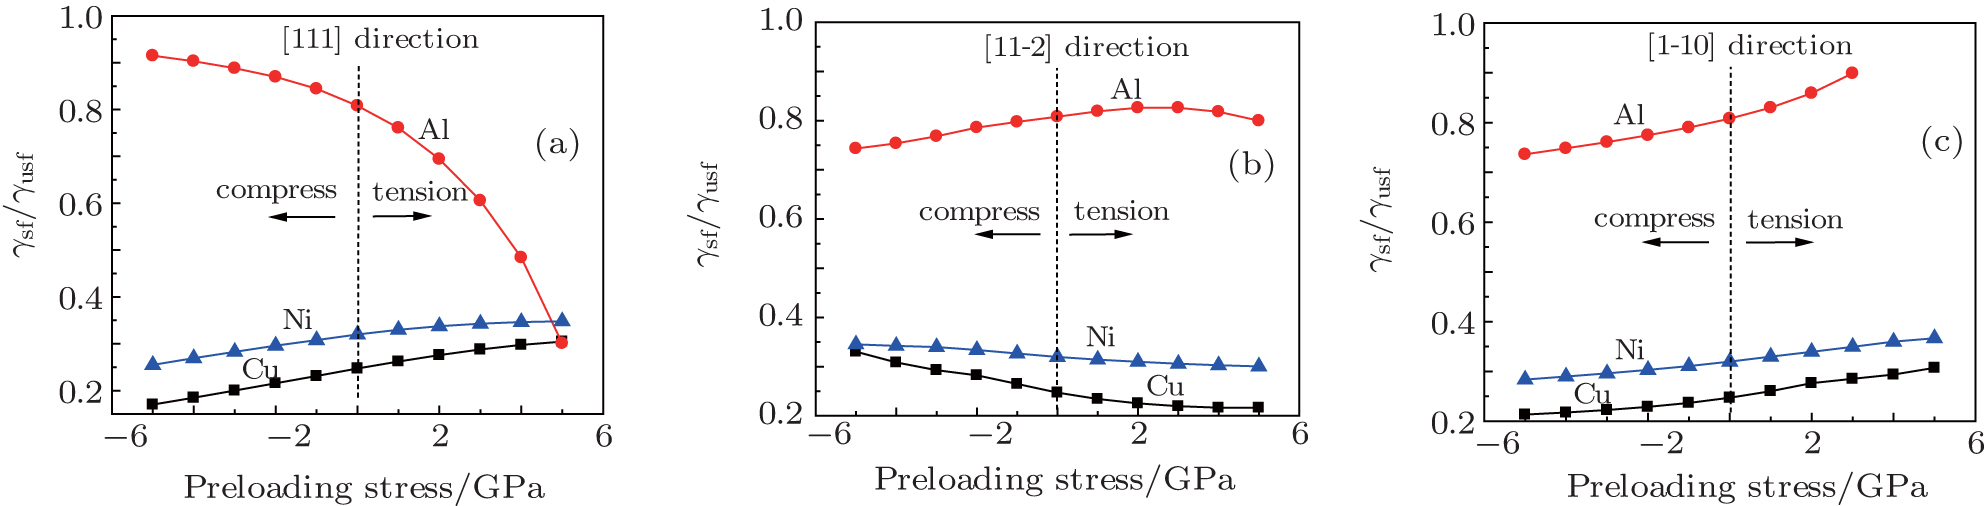 | Fig. 7. Variations of ratio of stable stacking fault energy to unstable stacking fault energy (γ sf/γ usf) with preloading stress along (a) [111] direction, (b) [11-2] direction, and (c) [1-10] direction. |
For the case of Al, the ratio γ sf/γ usf decreases significantly with the increase of the preloading tensile stress in the [111] direction (see in Fig.7(a)). At 5-GPa tensile stress, the ratio drops to the same level as those of in the cases of Cu and Ni. The sharp decrease of γ sf/γ usf indicates that the nucleation of full dislocation (with trailing partial dislocation) that is observed in simulations of Al[17, 19] may be restricted under tensile stress that is applied normal to the slip plane, i.e., the extended partial dislocation may dominate the deformation mechanisms, which is the same as the cases of Cu and Ni. In addition, the applied compressive stress in the [111] direction and the tensile stress in the [1-10] direction increase the ratioγ sf/γ usf to a level closer to unity, as shown in Figs.7(a) and 7(c). This means that the trailing partial dislocations can nucleate more easily and the separation between the leading and trailing partials is shortened. The effect of stress in the [11-2] direction on the ratio γ sf/γ usf is not obvious, ranging from 0.74 to 0.83.
As previously reported, [30, 31] the observation of twinning nucleation in a simulation is dependent on ratio γ utf/γ usf, where γ utf relates to the energy barrier for twinning formation and γ usf is associated with the barrier for a full dislocation nucleation. The ratio controls the competition between the two possible mechanisms. The values of γ utf is larger than those of γ usf in all cases of our simulation for the GSF curve, which is consistent with the case discussed by Van Swygenhoven et al.[19] through testing the GSF curves with different EAM potentials. This can explain why mechanical twinning is not observed as the dominant mechanism in most of the MD simulations of nanocrystalline samples with defect-free grains, since it overcomes the greater energy barrier. The influence of the applied stress on the ratio γ utf/γ usf is shown in Fig.8. In general, the value of γ utf/γ usf for Cu is at the lowest level in all the three tested elements, and this value is closer to unity when compressive stress is applied normal to the slip plane (see in Fig.8(a)). This means that the barriers for twinning formation and for dislocation nucleation are comparable and that twinning is easier to grow in Cu in certain conditions. For example, Lu et al.[40] used the nanoscale growth twins in Cu sample to effectively increase its strength. The applied tensile stress in the [111] and [1-10] directions and the compressive stress in the [11-2] direction increase the value ofγ utf/γ usf for Cu and thus increase the difficulty in twinning formation. For the case of Ni, the effects of stress on the ratio γ utf/γ usf are not significant in all directions, with the ration values ranging from 1.13 to 1.18.
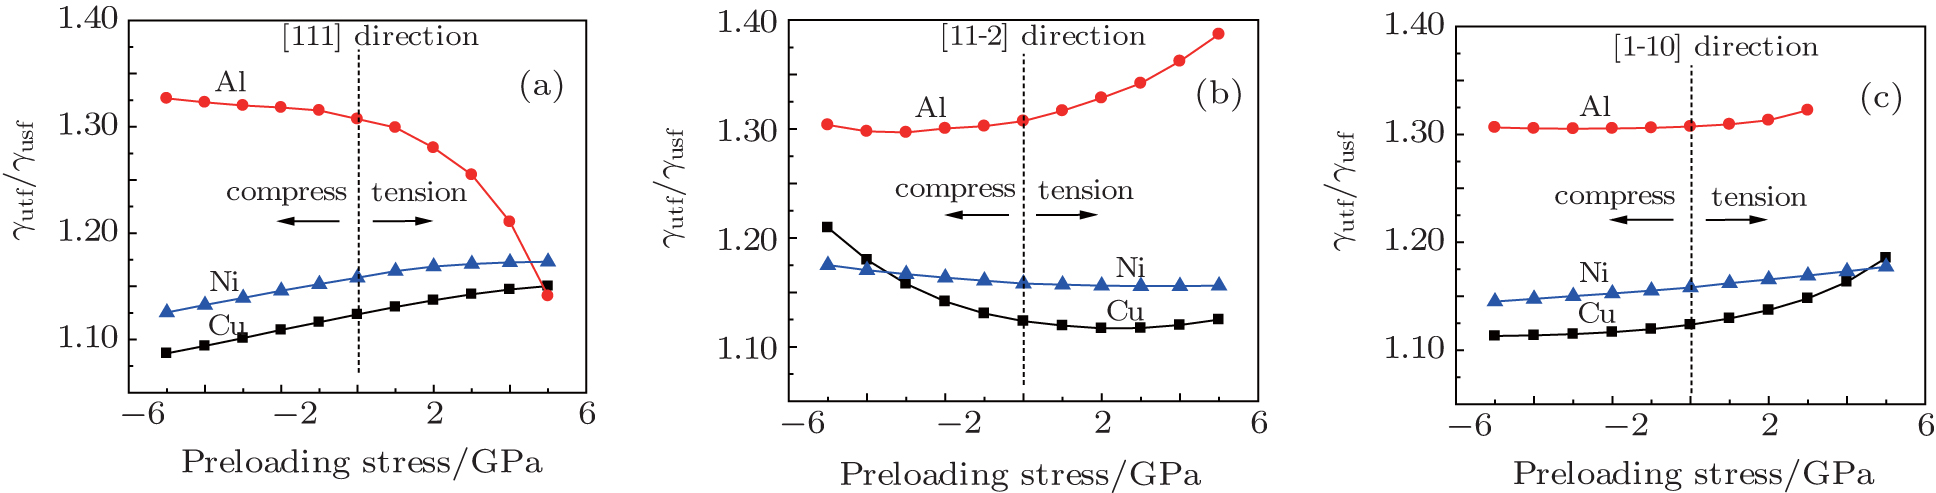 | Fig. 8. Variations of ratio of unstable twin fault energy to unstable stacking fault energy (γ utf/γ usf) with preloading stress along (a) [111] direction, (b) [11-2] direction, and (c) [1-10] direction. |
The value of γ utf/γ usf for Al is much higher than those for Cu and Ni, so the twinning is more difficult to form in Al. However, the tensile stress in the [111] direction can sharply reduce the value from 1.31 in stress-free condition to 1.14 at 5-GPa preloading stress. The sharp decrease of γ utf/γ usf indicates that twinning may also be observed as a deformation mechanism in high stress concentration conditions, especially when the applied tensile stress has a high component normal to the slip plane. For example, twinning deformation mechanism has been observed in experiments, 38, 39 in which twin boundary nucleation becomes favorable over full dislocation nucleation when high shear stress is provided (for example, during ball milling and high-pressure torsion). The tensile stresses in the [11-2] and [1-10] directions increase the value ofγ utf/γ usf for Al and thus can increase the difficulty in twinning formation.
MD simulations are used to investigate the influence of tensile and compressive stresses on (111) [11-2] GSF energy curves in the [111], [11-2], and [1-10] directions for three different fcc metals. The widely used EAM potentials developed by Mishin for Cu, [33] Al, [34] and Ni[35] are tested in this study. Simulation results show that the GSF curves of the three elements can be influenced by the preloading stress. The values of γ usf, γ sf, and γ utf increase or decrease when preloading tensile or compressive stress is applied in a certain direction. The effects of stress on the ratios of γ sf/γ usf, and γ utf/γ usf, which are closely related to the deformation mechanisms in nanocrystalline materials, are also investigated in this study. The results quantitatively demonstrate that not only the resolved stress along the slip plane (traditional Schmid factor) but also the resolved stress normal to the slip plane and the resolved stress perpendicular to the slip direction can play important roles in dislocation nucleation and twinning formation. The change in the GSF energy curve with applied stress indicates that the stress state is another important factor that can influence the deformation mechanism of nanocrystalline material.
| 1 |
|
| 2 |
|
| 3 |
|
| 4 |
|
| 5 |
|
| 6 |
|
| 7 |
|
| 8 |
|
| 9 |
|
| 10 |
|
| 11 |
|
| 12 |
|
| 13 |
|
| 14 |
|
| 15 |
|
| 16 |
|
| 17 |
|
| 18 |
|
| 19 |
|
| 20 |
|
| 21 |
|
| 22 |
|
| 23 |
|
| 24 |
|
| 25 |
|
| 26 |
|
| 27 |
|
| 28 |
|
| 29 |
|
| 30 |
|
| 31 |
|
| 32 |
|
| 33 |
|
| 34 |
|
| 35 |
|
| 36 |
|
| 37 |
|
| 38 |
|
| 39 |
|
| 40 |
|