Photoluminescence of rare-earth ion (Eu3+, Tm3+, and Er3+)-doped and co-doped ZnNb2O6 for solar cells
[Gao Sen-Peia), b) , Qian Yan-Nanc) , Wang Biao†a), b)  ]
]
]
|
|


†Corresponding author. E-mail: wangbiao@mail.sysu.edu.cn
*Project supported by the National Natural Science Foundation of China (Grant Nos. 10572155 and 10732100) and the Research Fund for the Doctoral Program of Ministry of Education, China (Grant No. 20130171130003).
Visible converted emissions produced at an excitation of 286 nm in ZnNb2O6 ceramics doped with rare-earth ions ( RE = Eu3+, Tm3+, Er3+ or a combination of these ions) were investigated with the aim of increasing the photovoltaic efficiency of solar cells. The structure of RE:ZnNb2O6 ceramics was confirmed by x-ray diffraction patterns. The undoped ZnNb2O6 could emit a blue emission under 286-nm excitation, which is attributed to the self-trapped excitons’ recombination of the efficient luminescence centers of edge-shared NbO6 groups. Upon 286-nm excitation, Eu:ZnNb2O6, Tm:ZnNb2O6, and Er:ZnNb2O6 ceramics showed blue, green, and red emissions, which correspond to the transitions of5D0 →7F J ( J = 1−4) (Eu3+),1G4 →3H6 (Tm3+), and2H11/2/4S3/2 →4I15/2 (Er3+), respectively. The calculated CIE chromaticity coordinates of Eu:ZnNb2O6, Tm:ZnNb2O6, and Er:ZnNb2O6 are (0.50, 0.31), (0.14, 0.19), and (0.29, 0.56), respectively. RE ion-co-doped ZnNb2O6 showed a combination of characteristic emissions. The chromaticity coordinates of Eu/Tm:ZnNb2O6, Eu/Er:ZnNb2O6, and Tm/Er:ZnNb2O6 were calculated to be (0.29, 0.24), (0.45, 0.37), and (0.17, 0.25).
Rare-earth ion-doped materials, which are used as light converter layers for enhancing the photovoltaic efficiency of solar cells, are currently attracting extensive interest.[1– 3] Although these solar cells could fill the energy gap left by fossil fuels, the transmission of sub-bandgap light still limits the photovoltaic efficiency of solar cells. In particular, the dye-sensitized solar cell only has high absorption in the visible range of 400 nm– 700 nm, due to its wide bandgap of about 1.7 eV– 1.8 eV.[4] Therefore, many researchers have sought to expand the possibilities for light converter layers that can convert the ultra-violet (UV, λ < 400 nm) into the visible emissions. [5– 8]
There are many studies on host materials, such as nanosystems, glass-systems, polymer-systems, and others. However, it is worthwhile to study the optical characteristics of rare-earth ion-doped zinc niobate (ZnNb2O6, ZN) because ZN ceramic is an interesting photoactive material and a typical dielectric material. ZnNb2O6 ceramic, which has an orthorhombic Columbite structure, exhibits excellent dielectric properties at microwave frequencies with a high dielectric constant (ε r = 25), high quality factor (Q × f = 83700 GHz), and low temperature coefficient of resonant frequency (τ f = − 56 ppm/° C).[9] Furthermore, ZnNb2O6 also displays good magnetic, catalytic, and optical properties.[10] Driven by the need for integration of tiny optoelectronic devices, the rare-earth ion-doped ZnNb2O6 (RE:ZnNb2O6 ceramics could be expanded since RE:ZnNb2O6 has possibilities to combine the dielectric and photoluminescence properties of ZnNb2O6 with the optical characteristics presented by rare-earth ions. Zhou et al.[11] first reported that in rare-earth-doped ZnNb2O6, the concentration of doped Dy3+ ions could influence the intensity of blue emission originating from pure ZnNb2O6 by energy transfer between Dy3+ and niobate groups. Gou et al.[12] discovered a shift of chromaticity coordinates from the cold-white region of Dy3+ :ZnNb2O6 to the warm-white region of Dy3+ /Al3+ :ZnNb2O6 phosphor under 365-nm excitation. Hsiao et al.[13] reported red emission of Eu:ZnNb2O6 under 288-nm excitation and blue emission of Tm:ZnNb2O6 under 282-nm excitation, both of which have potential applications in solar cells. Wang et al.[14] prepared Ho3+ /Yb3+ :ZnNb2O6 ceramics by a high temperature solid state method and reported green and red upconversion emissions in Ho3+ /Yb3+ : ZnNb2O6 under 980-nm excitation. Therefore, studying the optical characteristics of RE:ZnNb2O6 ceramics is worthwhile because they can increase the solar spectrum response of dye-sensitized solar cells.
In the present paper, we report how RE ion-doped and − co-doped ZnNb2O6 ceramics were successfully synthesized by a high temperature solid state method. The structural properties of RE:ZnNb2O6 were evaluated by x-ray diffraction (XRD) patterns. The excitation and emission spectra of the prepared RE:ZnNb2O6 ceramics were investigated under 286-nm excitation. The CIE chromaticity coordinates for the fluorescence of RE:ZnNb2O6 ceramics were calculated based on the 1931 CIE standard and marked in the CIE standard chromaticity diagram.
A series of RE ion-doped and -co-doped ZnNb2O6 ceramics were prepared by a high temperature solid state method. The concentrations of Eu3+ , Tm3+ , and Er3+ ions in ZN ceramics are shown in Table 1. The detailed procedure was as follows. The purities of the raw materials (Eu2O3, Tm2O3, Er2O3, ZnO, and Nb2O5 were 99.99%. The raw materials, which had been precisely weighed and thoroughly mixed for 24 hours, were fully ground in an agate mortar for 3 hours and then pressed into tablets. The tablets were sintered 2 h at 500 ° C and 800 ° C and then 4 h at 1150 ° C, to get the phase-pure rare-earth-doped ZnNb2O6 ceramics. The structure of RE:ZnNb2O6 ceramics was identified by x-ray diffraction (XRD) using a Rigaku D-Max 2200PC diffractometer with Cu-Kα radiation (λ = 0.15418 nm). A combined fluorescence lifetime and steady state spectrometer, FLSP920 by Edinburgh Instruments Ltd., was used to measure the excitation and emission spectra. All of these measures were performed at room temperature.
| Table 1. Raw material compositions (mol %) of RE ions in ZN ceramics. |
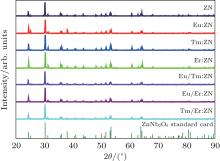
The powder XRD patterns of pure and RE:ZnNb2O6 ceramics are shown in Fig. 1. The result shows that all of the diffraction peaks can be well indexed to the known phase of ZnNb2O6 based on the standard XRD pattern (JCPDS#37-1371). No new peaks appear in the XRD pattern of RE:ZnNb2O6 compared with the undoped ZnNb2O6 ceramic, indicating that the doping ions (Eu3+ , Tm3+ , and Er3+ ) have no influence on the structure of RE:ZnNb2O6, and RE:ZnNb2O6 is still an orthorhombic system. So it is speculated that the doping Eu3+ , Tm3+ , and Er3+ ions may occupy the normal Zn-site or Nb-site rather than interstitial sites of the lattice.
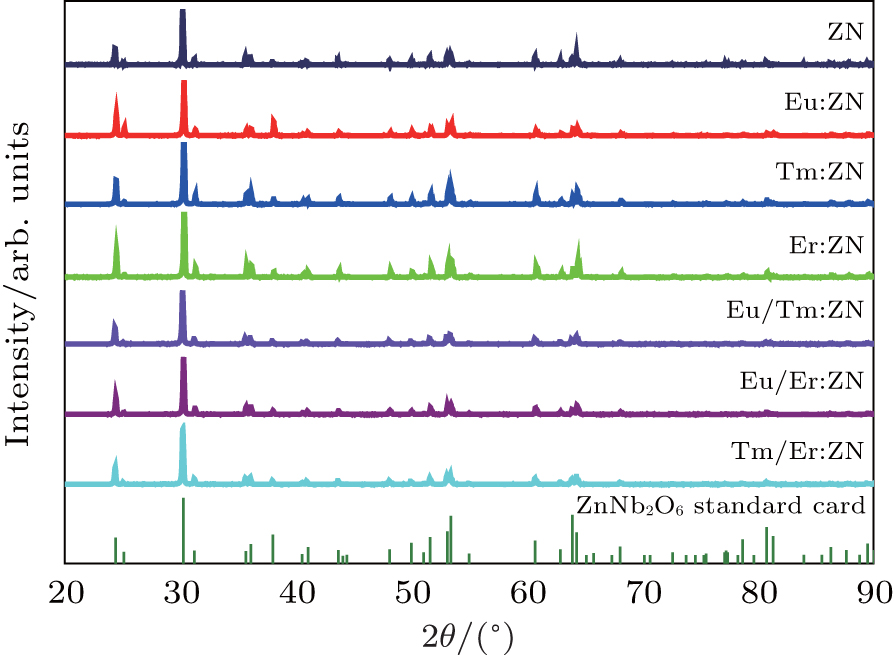 | Fig. 1. XRD patterns of prepared ZnNb2O6 ceramics. |
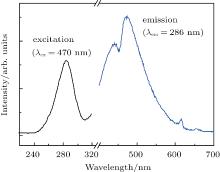
ZnNb2O6 has been investigated as a self-activated blue phosphor, [15] figure 2 shows the excitation and emission spectra of the pure ZnNb2O6 ceramic with monitoring excitation at 286 nm and emission at 470 nm. The broad excitation band showed absorption within the range from 230 nm to 310 nm. A blue emission band centered at 470 nm is observed in the self-activated ZnNb2O6 ceramic under 286-nm excitation. It is known that in the orthorhombic columbite structure of ZnNb2O6, both Zn and Nb atoms, which are centered at the octahedron, are surrounded by six O2− anions to form ZnO6 and NbO6 octahedra, respectively. The octahedra are connected to each other via sharing edge or corner to form a two-dimensionally extended sheet in the bc plane.[16] Here, the edge-sharing [NbO6]7− groups are efficient luminescent centers for blue emission, [17] which may be ascribed to recombination of self-trapped excitons.[18] Fragoso et al.[19] also reported that edge-sharing NbO6 octahedral groups show efficient blue luminescence with a large Stokes shift. As illustrated in Fig. 2, the observed emission bands at 445 nm, 615 nm, and 659 nm can be attributed to the defects and impurities generated from extrinsic niobate groups.[20]
 | Fig. 2. Excitation and emission spectra of undoped ZnNb2O6. |
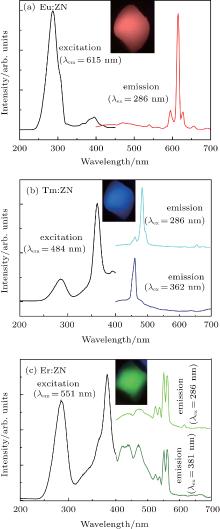
Figure 3(a) shows the excitation spectrum (λ em = 615 nm) of Eu:ZN and the corresponding emission spectra (λ ex = 286 nm) of Eu:ZN. The inset of Fig. 3(a) shows the emission color of Eu:ZN under 286-nm excitation, and a bright red-light emission in Eu:ZN ceramic can be easily observed by the naked eye. It can be clearly observed that the excitation spectrum consists of two main features, a strong broad band centered at 286 nm and a weak one at 396 nm. The 286-nm excitation band corresponds to the charge transfer from the 2p orbitals of the O2− to the 5d orbitals of the central Nb5+ atoms in the [NbO6]7− groups. The presence of the 286-nm excitation peak indicates that there is an energy transfer from the [NbO6]7− groups to Eu3+ in Eu:ZN. The excitation band at 396 nm, which belongs to the characteristic f– f transition lines within the 4f6 configuration of the Eu3+ ion, is assigned to the 7F0 → 3L6 transition of Eu3+ ion. Under 286-nm excitation, the observed visible emissions are centered at 595 nm, 615 nm, 628 nm, and 655 nm, as shown in the right of Fig. 3(a), and are attributed to the typical transitions of 5D0 → 7FJ (J = 1– 4), respectively. The green emission at 540 nm corresponds to the transition of 5D1 → 7F1 of Eu3+ ions in the Eu:ZN ceramic. Hsiao et al.[13] also reported the red emission at 613 nm of Eu3+ ion-doped ZnNb2O6 under 288-nm excitation due to the 5D0 → 7F2 transition of Eu3+ . In addition, they reported the influence of the concentration of Eu3+ on the emission intensity of Eu3+ ion-doped ZnNb2O6.
The photoluminescence excitation (λ em = 484 nm) and emission (λ ex = 286 nm and 362 nm) spectra of Tm:ZN are displayed in Fig. 3(b). It can be seen that the 286-nm and 362-nm excitation bands appear in the excitation spectrum of Tm:ZN. Similar to the Eu:ZN ceramic, the 286-nm excitation band is due to the 2p(O)– 4d(Nb) charge transfer transitions. The strong narrow line at 362 nm can be ascribed to the characteristic f– f transition (3H6 → 1D2 of Tm3+ within its 4f12 configuration. The inset of Fig. 3(b) shows that Tm:ZN ceramic could emit a bright blue-light emission, which can be easily observed by the naked eye. As illustrated in the emission spectrum of Tm:ZN under 286-nm excitation, a strong emission at 484 nm corresponds to the 1G4→ 3H6 transition of Tm3+ ions. The two weak emissions observed at 460 nm and 655 nm are due to the 1D2 → 3F4 and 1G4 → 3F4 transitions, respectively. Hsiao et al.[13] reported that the concentration of Tm3+ influences the blue emission intensity of Tm:ZnNb2O6. We both converted UV light into visible emission in RE-doped ZnNb2O6. Following 362-nm excitation at room temperature, the typical emission spectrum of Tm:ZN shows an intense emission at around 460 nm, which corresponds to the intra 4f– 4f 1D2 → 3F4 electronic transition of Tm3+ ions.
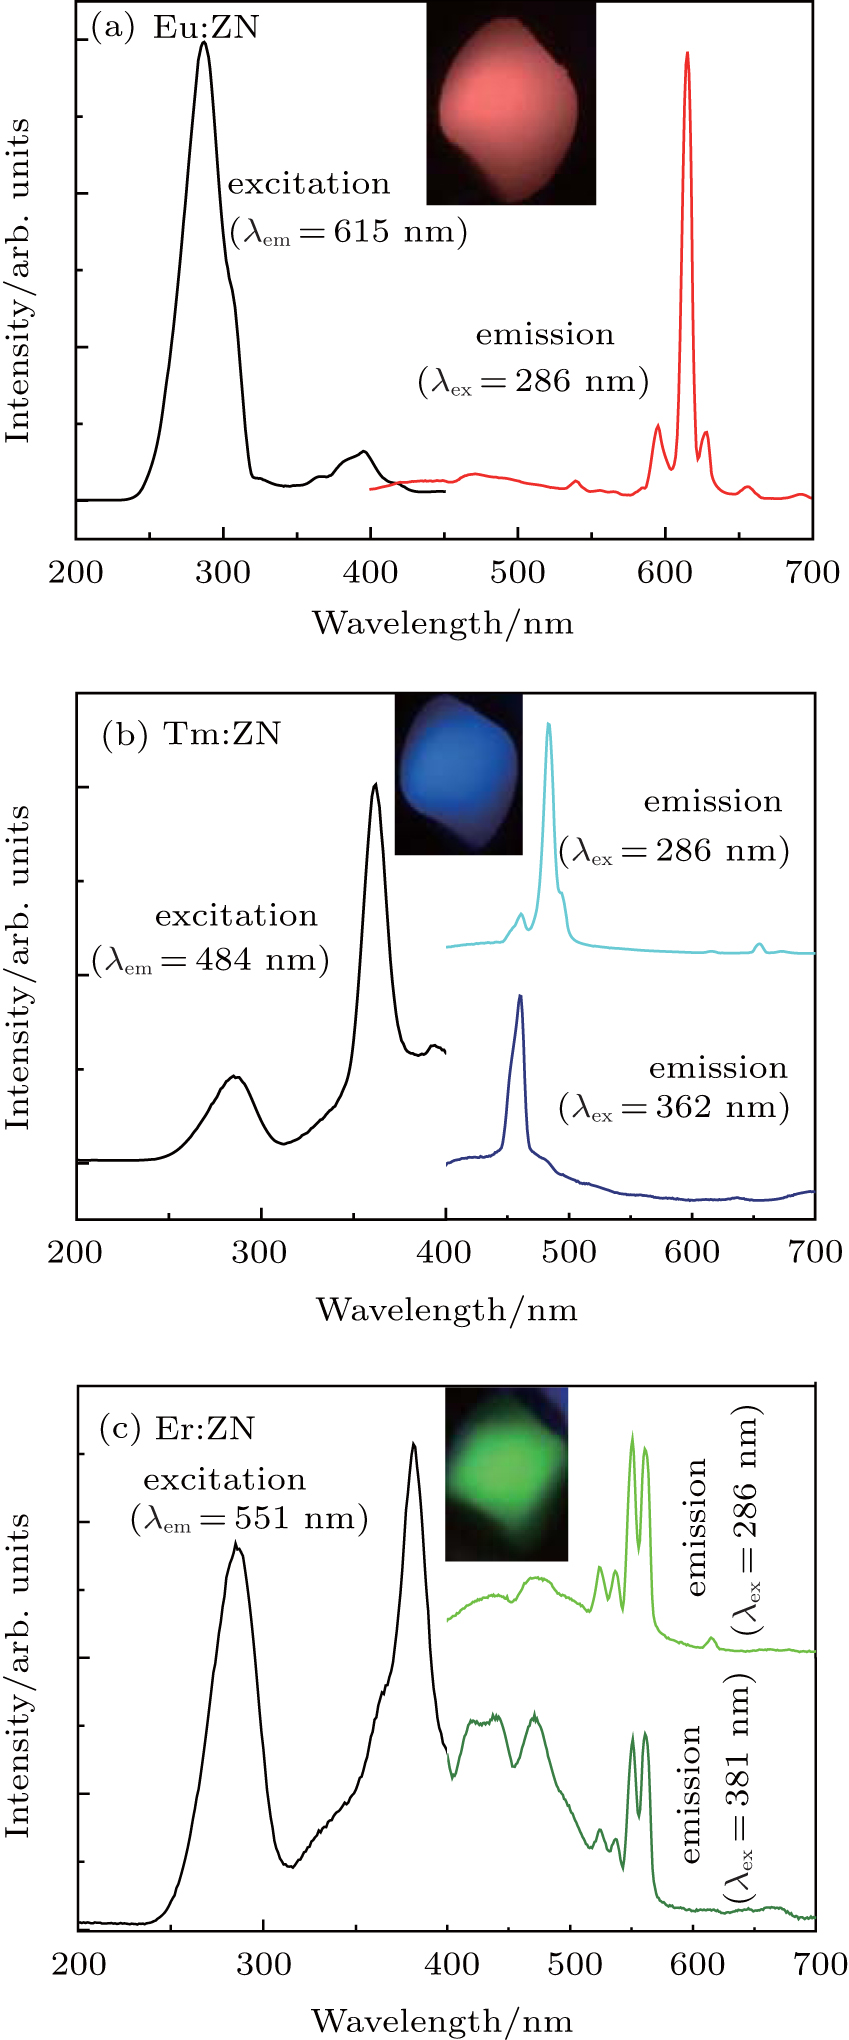 | Fig. 3. Excitation and emission spectra of (a) Eu:ZN, (b) Tm:ZN, and (c) Er:ZN. |
Figure 3(c) is the excitation spectrum of Er:ZN that is obtained by monitoring the emission at 552 nm and the emission spectra (λ ex = 286 nm and 381 nm) of Er:ZN. It can be clearly seen from the excitation spectrum of Er:ZN that two broad excitation bands are centered at 286 nm and 381 nm, respectively. The charge transfer from the 2p orbitals of the O2− to the 5d orbitals of the Nb5+ contributes to the 286-nm excitation peak in the excitation spectrum of Er:ZN. The strong narrow line at 381 nm is assigned to the 4I15/2 → 4G11/2 transition of Er3+ ion. It can be seen from the inset of Fig. 3(c) that the emission color of Er:ZN looks green to the naked eye. In the emission spectrum of Er:ZN under 286-nm excitation, the green emissions at 524 nm and 550 nm are assigned to the 2H11/2 → 4I15/2 and 4S3/2 → 4I15/2 transitions of Er3+ ion, respectively. It can also be seen that a blue emission centered at 470 nm is observed in the Er:ZN ceramic. The 470-nm blue emission, illustrated in Fig. 2, is ascribed to the self-activated ZnNb2O6 host materials. The photoluminescence emission spectrum of Er:ZN upon 381-nm excitation is shown in Fig. 3(c). The observed emissions from 410 nm to 480 nm are attributed to host material, while emissions at 524 nm and 550 nm are due to 2H11/2 → 4I15/2 and 4S3/2 → 4I15/2 transitions of Er3+ ions, respectively.
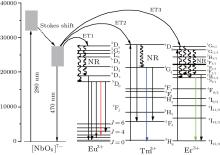
Figure 4 shows the energy diagram level of Eu3+ , Tm3+ , and Er3+ ions, as well as a simple model illustration of the energy transfers from the NbO6 groups to the RE ions. Under 286-nm excitation, the ground state of the [NbO6]7− groups is populated to the excited state, which has a large Stokes shift effect from Nb– O charge transfer. As for Eu:ZN, the excited state of Nb– O bonds can transfer its energy to the 5D4 state of Eu3+ ions through energy transfer (ET1: [NbO6]7− + 286 nm → 5D4 (Eu3+ )). Then, the 5D0 and 5D1 states of Eu3+ ions are populated via a nonradiative relaxation (NR) process. The Eu3+ ions at the 5D0 and 5D1 states give the radiative transitions of 5D0 → 7FJ (J = 1− 4) and 5D1 → 7F1, producing emissions at 595 nm, 615 nm, 628 nm, 655 nm, and 540 nm, respectively.
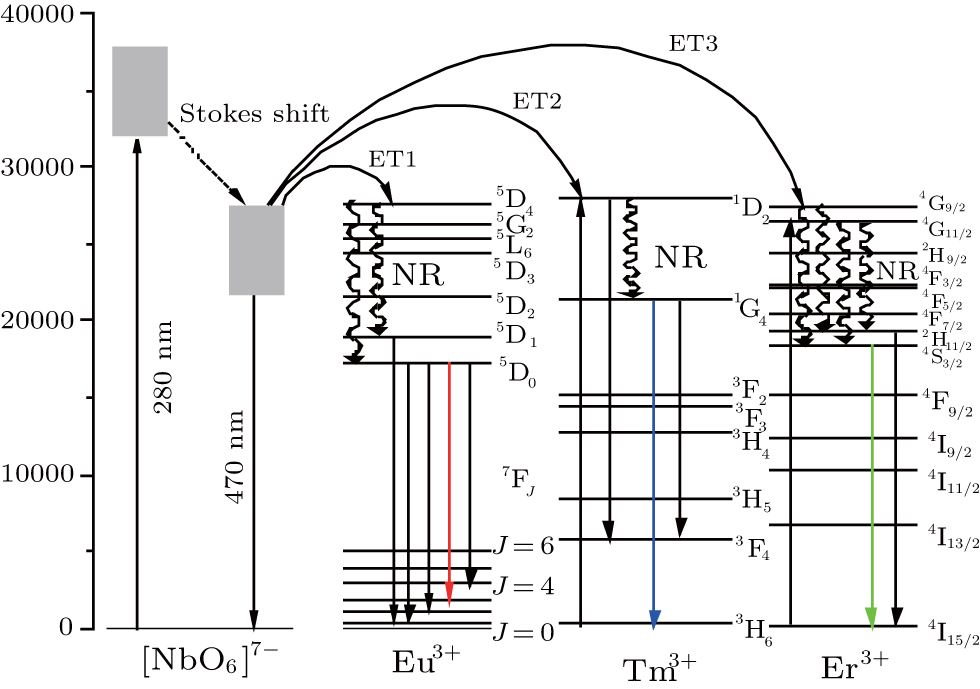 | Fig. 4. The energy diagram level of Eu3+ , Tm3+ , and Er3+ ions, as well as a simple model illustration of the energy transfers from the NbO6 groups to the RE ions. |
In the case of the Tm:ZN ceramic upon excitation of the 286-nm UV light, the 1D2 state of Tm3+ can be excited by ET2 process ([NbO6]7− + 286 nm → 1D2 (Tm3+ )). Subsequently, the 1G4 state of Tm3+ ions is populated by NR from the 1D2 state. Tm3+ ions at the 1G4 state decay radiatively to the 3H6 ground state, resulting in an intense blue emission at 484 nm. Meanwhile, the 1D2 → 3F4 and 1G4 → 3F4 transitions of Tm3+ ions produce 460-nm and 655-nm emissions, respectively. In Tm:ZN, the Tm3+ ions in the 3H6 ground state can also be directly excited by 362-nm wavelength light up to the 1D2 state. The Tm3+ ions at the 1D2 state radiatively relax to the 3F4 state, generating 460-nm emission.
The energy transfer process between NbO6 groups and Er3+ ions in Er:ZN is similar to those of Eu:ZN and Tm:ZN ceramics, the ET3 process ([NbO6]7− + 286 nm → 4G9/2 (Er3+ )) could excite the 4G9/2 state of Er3+ ions under 286-nm excitation. The Er3+ ions at the 4G9/2 state nonradiatively relax to the green-emitting 2H11/2/4S3/2 states in cascade. The green emissions at 524 nm and 550 nm are produced by the radiative relaxation process from the 2H11/2/4S3/2 states to the ground 4I15/2 state, respectively. It can also be seen that Er3+ ions at the ground 4I15/2 state are excited to the 4G11/2 state under 381-nm excitation. Then, the green-emitting 2H11/2/4S3/2 states are populated by NR process from the 4G11/2 state, producing emissions at 524 nm and 550 nm.
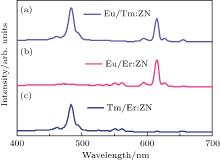
The optical characteristics of RE ion-co-doped ZN ceramics have been studied in order to expand the solar spectrum response of dye-sensitized solar cells. Figure 5 shows the emission spectra of Eu3+ /Er3+ , Eu3+ /Tm3+ , and Er3+ /Tm3+ co-doped ZnNb2O6 ceramics under 286-nm excitation. It can be seen from Fig. 5(a) that there is a blue emission at 460 nm and emissions at 595 nm, 615 nm, 628 nm, and 655 nm, which are ascribed to the 1G4 → 3H6 transition of Tm3+ ions and 5D0 → 7FJ (J = 1– 4) transitions of Eu3+ ions, respectively. Compared with the emission spectra of Eu:ZN and Tm:ZN ceramics, Eu/Tm:ZN emits a combination of optical characteristics of Eu3+ and Tm3+ ions, which is beneficial for the efficiency of light-light conversion. The emission spectrum of Eu/Er:ZN (shown in Fig. 5(b)) exhibits a strong red emission at 615 nm, which can be attributed to the 5D0 → 7F3 transition of Eu3+ ion. The three weak emissions obtained at 595 nm, 628 nm, and 655 nm correspond to 5D0 → 7FJ (J = 1, 2, and 4), respectively. The green emissions at 550-nm are assigned to the 4S3/2 → 4I15/2 transition of Er3+ ions. A strong blue emission at 460 nm, as shown in Fig. 5(c), results from the 1G4 → 3H6 transition of Tm3+ ions, and the weak green emissions are due to the 4S3/2 → 4I15/2 transitions of Er3+ ions. The experimental results show that the RE ion-co-doped ZN ceramic successfully combined the optical characteristics of two different RE ions. Seeta Rama Raju et al.[21] reported that Tm3+ , Eu3+ , and Er3+ ion-doped and ion-co-doped BaGd2O4 combined the optical characteristics of different RE ions. Moreover, Tm3+ , Eu3+ , and Er3+ ion-tri-doped BaGd2O4 also showed the characteristic emissions of Tm3+ , Eu3+ , and Er3+ ions. Usually, the absorption wavelength of a solar cell is about 400 nm– 1000 nm. Figures 3 and 5, considered together, show that RE ions-doped and co-doped ZN can efficiently convert UV light into a visible emission. The RE ion-doped and ion-co-doped ZN are considered for use as a downconversion layer placed on the front side of a silicon solar cell, which is combined with a back optical reflector. The RE:ZN downconversion layer absorbs UV solar radiation and emits visible emissions that are subsequently reabsorbed by the dye-sensitized solar cell. Moreover, RE ion-co-doped ZN ceramics can also enlarge the solar spectrum response because they can combine the optical characteristics of two different RE ions.
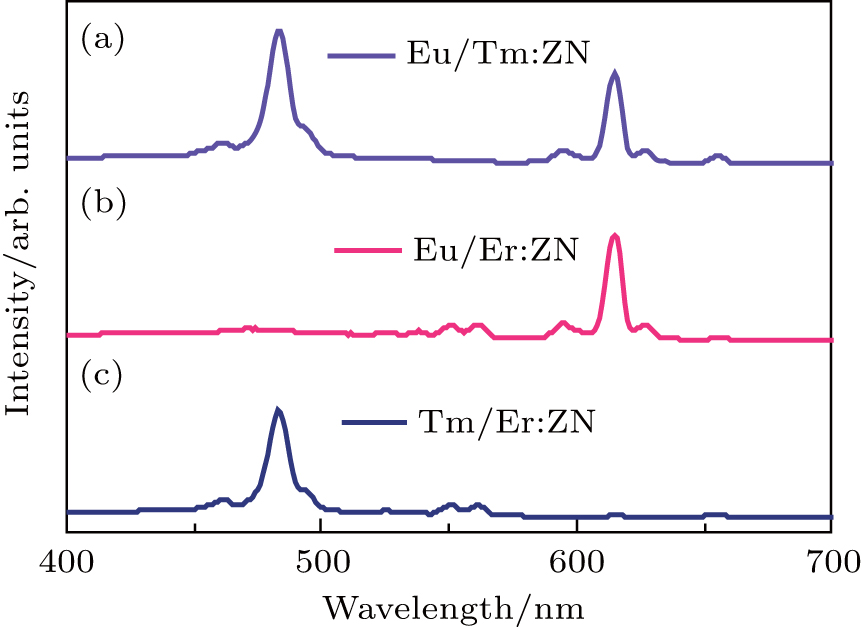 | Fig. 5. The emission spectra of (a) Eu3+ /Tm3+ :ZN, (b) Eu3+ /Er3+ :ZN, and (c) Tm3+ /Er3+ :ZN under 286-nm excitation. |
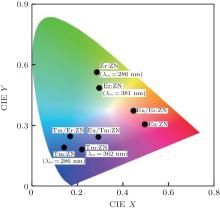
To characterize the true color of emitted light, it is necessary to study the color coordinates marked on a standard chromaticity diagram. The CIE 1931 xy chromaticity coordinates of RE:ZN (RE = Eu3+ , Tm3+ , and Er3+ under 286/362/381-nm excitation can be calculated by the following formula[22] and are presented in Fig. 6:

where X, Y, and Z are the three tristimulus values, which can be given by[23]


where P(λ ) is the tristimulus value for a color with a spectral power distribution, λ is the wavelength of the equivalent monochromatic light, x′ (λ ), y′ (λ ), and z′ (λ ) are three color-matching functions. According to the above equations, the calculated chromaticity coordinates of RE:ZN ceramics are listed in Table 2. As illustrated in Table 2, the chromaticity coordinates of Eu:ZN, Tm:ZN, and Er:ZN are (0.50, 0.31), (0.14, 0.19), and (0.29, 0.56) under 286-nm excitation, which indicate red, blue, and green emissions, corresponding to the colors observed by the naked eye, as shown in Fig. 3. As for the Tm:ZN ceramic under 362-nm excitation, the calculated value of CIE coordinates is (0.22, 0.18), which is located between the blue and purple regions, as shown in Fig. 6. The CIE coordinate for the emission spectrum of Er:ZN under 381-nm excitation is calculated to be (0.30, 0.48), which is located at the region between green and cyan, as shown in Fig. 6. It can be observed from Fig. 6 that the RE-doped ZN under 286-nm excitation has a higher color purity than Tm:ZN under 362-nm excitation and Er:ZN under 381-nm excitation. The color coordinates of RE ion-co-doped ZN ceramics are also listed in Table 2. It can be observed that the calculated coordinates of Eu/Tm:ZN, Eu/Er:ZN, and Tm/Eu:ZN are (0.29, 0.24), (0.45, 0.37), and (0.17, 0.25). It can be seen in Fig. 6 that the CIE coordinates of RE ion-co-doped ZN ceramics are located between the RE:ZN under 286-nm excitation, which indicates that multicolor emissions are achieved. Meanwhile, the shift of the CIE chromaticity coordinates confirms that the emission color can be adjusted through co-doping. Thus, we can tune the emission color of RE:ZN over a wide range. The obtained visible red, blue, and green emissions of RE ion-doped and ion-co-doped ZN ceramics indicate that RE:ZN can be considered to be a promising light converting layer for use in dye-sensitized solar cells.
 | Fig. 6. CIE chromaticity coordinates of RE-doped and RE-co-doped ZN ceramics. |
| Table 2. CIE coordinates of RE:ZN ceramics. |
In summary, Eu3+ , Tm3+ , and Er3+ ion-doped and ion-codoped ZnNb2O6 ceramics have been successfully prepared by a high temperature solid state method. Under 286-nm UV excitation, undoped ZnNb2O6 shows a blue emission at 470 nm due to the [NbO6]7− groups. Bright visibly enhanced visible blue, green, and red emissions, induced by 280-nm UV excitation, are gained in Tm:ZN, Er:ZN, and Eu:ZN ceramics, which can be ascribed to the 5D0 → 7FJ (J = 1– 4) (Eu3+ ), 1G4 → 3H6 (Tm3+ ), and 2H11/2/4S3/2 → 4I15/2 (Er3+ ), respectively. The emission spectra of RE ion-co-doped ZnNb2O6 show expanded emission spectra that result from the combination of the emission spectra of the corresponding RE ion-doped ZnNb2O6. The chromaticity coordinates of RE:ZN are calculated and the CIE diagram is presented to demonstrate the change of emission color.
| 1 |
|
| 2 |
|
| 3 |
|
| 4 |
|
| 5 |
|
| 6 |
|
| 7 |
|
| 8 |
|
| 9 |
|
| 10 |
|
| 11 |
|
| 12 |
|
| 13 |
|
| 14 |
|
| 15 |
|
| 16 |
|
| 17 |
|
| 18 |
|
| 19 |
|
| 20 |
|
| 21 |
|
| 22 |
|
| 23 |
|