Structured dark-field imaging for single nano-particles
[Chen Jiana) , Gao Kun†a)  , Wang Zhi-Li
a) , Yun Wen-Bingb) , Wu Zi-Yuc) ]
, Wang Zhi-Li|
|


†Corresponding author. E-mail: gaokun@ustc.edu.cn
*Project supported by the National Basic Research Program of China (Grant No. 2012CB825800), the Science Fund for Creative Research Groups, the National Natural Science Foundation of China (Grant No. 11321503), the Knowledge Innovation Program of the Chinese Academy of Sciences (Grant No. KJCX2-YW-N42), and the National Natural Science Foundation of China (Grant Nos. 11475170, 11205157, and 11305173).
In this work, we extensively describe and demonstrate the structured dark-field imaging (SDFI). SDFI is a newly proposed x-ray microscopy designed for revealing the fine features below Rayleigh resolution, in which different orders of scattered x-ray photons are collected by changing the numerical aperture of the condenser. Here, the samples of single particles are discussed to extend the scope of the SDFI technique reported in a previous work (Chen J, Gao K, Ge X, et al. 2013 Opt. Lett.38 2068). In addition, the details of the newly invented algorithm are explained, which is able to calculate the intensity of any pixel on the image plane rapidly and reliably.
Owing to its combination of high resolution and high penetration, x-ray microscopy has been proved to be an irreplaceable method of providing nondestructive images in lots of research areas, especially, material science and biology.[1– 8] Recently, resolutions down to 12 nm and 30 nm have been demonstrated by using soft and hard x-ray zone plates respectively.[9, 10] Until now, the resolution of nano x-ray microscopy is mainly limited by the numerical aperture (NA) of the objective optics (zone plate). And it is extremely hard to make further improvement due to the technical challenges of fabricating zone plates with finer outermost zone width and sufficient thickness. However, the resolution of several tens of nanometers is not sufficient for many research areas, and fine features below this resolution could be of prime importance. Thus, efforts have been made to overcome the limitation of Rayleigh resolution, such as near-field scanning optical microscope (NSOM), [11] confocal microscope, [12] stochastic optical reconstruction microscopy (STORM), [13] stimulated emission depletion (STED) microscopy, [14] etc.
The SDFI is a newly proposed method that has the potential to investigate fine features below Rayleigh resolution.[15] In the design of SDFI, traditional transmission x-ray microscopy (TXM) is reorganized by varying the aperture of condenser gradually, so that different scattering information at different illumination angles could be retrieved to detect fine features down below Rayleigh resolution.
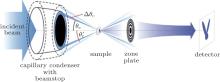
The setup of SDFI is shown in Fig. 1, The main body is just like the setup of TXM, [9] but NA of the condenser (NAc) is designed to be larger than, rather than exactly matching, that of objective (NAo). This means that a kind of dark-field microscopic image is obtained and only the scattered x-rays are collected by the objective. In SDFI, a series of dark-field images will be captured under different NAs of condenser which are carefully chosen. The angular width Δ θ c of each illumination is set to be one tenth of the NAo. With the scattering information collected at dark-field images, we are able to analyze the size, even the shape, of fine structures below Rayleigh resolution.
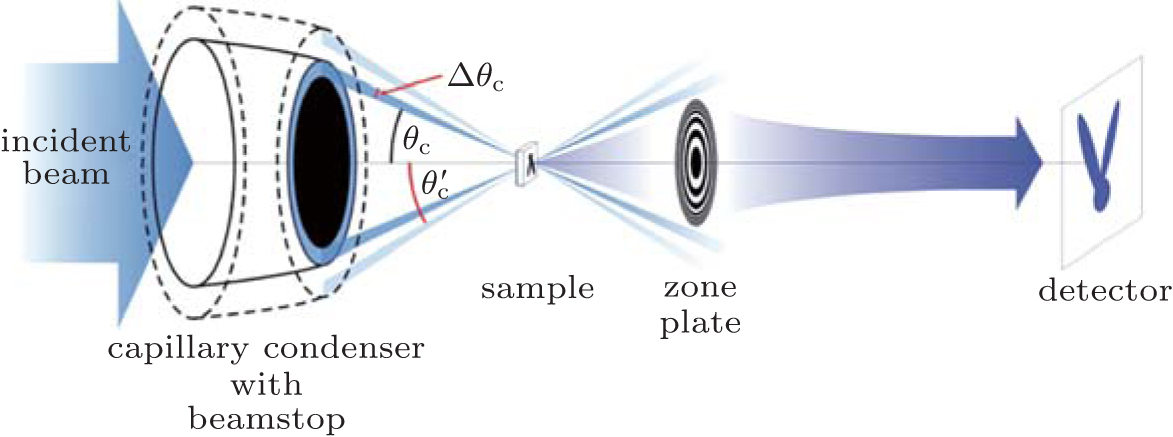 | Fig. 1. Schematic illustration of the structured dark-field imaging. |
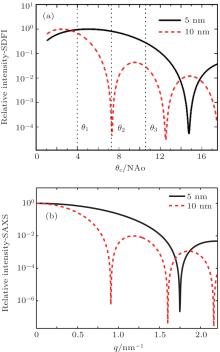
The dependence of the intensity on the illumination angle θ c at each pixel in an SDFI image is important for quantitatively understanding the SDFI concept and analyzing the experimental data. Figure 2(a) shows calculated SDFI curves for single 5-nm and 10-nm carbon particles each as a function of θ c at an operating wavelength of 1.5 Å (8 keV). The NA of the objective is 3 mrad, and the corresponding Rayleigh resolution is 30 nm. The angular width Δ θ c of the illumination beam is fixed at 0.3 mrad in the SDFI process. For comparison, figure 2(b) shows simulated small angle x-ray scattering (SAXS) spectra for the same particles (sparsely distributed) each as a function of scattering vector q. The SDFI curves have similar behaviors to the corresponding SAXS spectra, which confirms that SDFI can yield scattering information by varying θ c. It is clear from Fig. 2(a) that by recording the intensities at the three θ c positions indicated by θ 1, θ 2, and θ 3, we can identify that the particle size is 5-nm rather than 10 nm or vice versa. The procedure of scanning θ c is equivalent to simultaneously sampling the SAXS spectra for all the resolution elements. The same information can be obtained alternatively by scanning a fine focused beam in a raster fashion, albeit with significantly lower throughput and longer acquisition time.[16] By measuring the dark-field images with sufficient angular resolution, SDFI can easily perform such ‘ spatially resolved SAXS’ or ‘ sub-resolution characterization’ in a more effective manner.
 | Fig. 2. Comparison between SDFI curves and SAXS spectra. (a) Curves of calculated SDFI versus θ c for 5-nm and 10-nm spherical particles. (b) Curves of calculated SAXS spectra versus scattering vector q for the same particles as a function of scattering vector q. |
To calculate SDFI curves, we need to know the intensity of a particular pixel on the image plane. The frequently used method to calculate the intensity of one pixel does not consider the influence of neighboring pixels and also neglects the effect of system resolution, [17] which leads to an idealized result. Alternatively, one can simulate the image process to achieve the whole image plane and choose the intensity of the particular pixel, which results in much longer calculation time. For these reasons, we develop a new algorithm to calculate the intensity of one pixel reliably and rapidly.
The mathematical model of the SDFI signal is based on the well-known conclusion of coherent imaging in classical optics: for a coherently illuminated lens imaging system, the complex amplitude Ui on the image plane is the convolution of the amplitude point spread function (PSF) and the amplitude on the object plane, i.e., [18]

where Azp is the PSF of the lens system, ts the object transmission function, Uc the amplitude of coherent illumination on the object plane, and M the magnification of the system.
In a typical full-field imaging system with a spatially incoherent source illumination, e.g., typical nanometer resolution transmission x-ray microscopes, the final intensity on the image plane can be evaluated by summing up all the intensities generated by each independent point source (which essentially forms a partially coherent illumination introduced by the condenser). In SDFI, we are interested in the sub-resolution features therefore the illumination can be regarded as being uniform over the interested small area in the size of a Rayleigh resolution element. Under this approximation, the image intensity can be calculated by integrating Eq. (1) with translating Uc over the entire source region
where Σ is the two-dimensional (2D) distribution of the x-ray source, and rc is the center of each point source. In Eq. (2), the coherent illumination Uc is determined by the exiting pupil of the condenser, therefore Uc is also related to the illumination angle θ c. Equation (2) is actually an implicit form of the local intensity dependence on θ c.
Equation (2) involves a quadruple integral and it requires intense calculation power to evaluate the intensity of one pixel. To reduce the computational complexity and make a clearer view of the dependence of intensity on the illumination angle, we need an explicit form of Eq. (2). This can be performed by expanding the convolution in Eq. (2)
and applying Parseval’ s theorem to rewrite Eq. (3) into the reciprocal space form
where rz is the Fourier conjugate variable of rc, and r is a dummy variable for convolution integral. The kernel of the Fourier transform used to derive Eq. (4) is defined as exp(− ikrc · rz/di), where k is the wave vector and di is the image distance from the objective. This Fourier kernel physically means that rz is the coordinates on the objective plane. Note that in Eq. (4), we have neglected constant coefficients since they do not contribute useful information to morphological identification.
Note that due to the Fourier transform relation between the lens pupil function and its amplitude PSF on the focal plane, the Fourier transform of Uc is actually the exiting pupil of the condenser
where Rc is the function defining the exit pupil. In the SDFI configuration, Rc is an annular function corresponding to the annular aperture. According to translation theorem of Fourier transform, we have
By substituting Eq. (6) into Eq. (4) and rewriting the r-dependent factors into a Fourier transform, we obtain an explicit expression of the local dependence of intensity on the illumination angle θ c
which means that varying the illumination angle θ c is essentially a sampling procedure in radial direction of the reciprocal space rz. Equation (7) denotes that the sampling result at θ c is affected both by the objective PSF Azp and by the angular width Δ θ c of the illumination beam.
Compared with Eq. (3), which is conventional equation for calculating intensity of image plane, equation (7) is more efficient because it only contains one integral, and the integral area is only a small part of the whole plane (the annulus of condenser). And the time complexity becomes O(n) other than the conventional O(n4), with n is the width of the matrix we used. With the explicit form Eq. (7), the SDFI curve at pixel ri can be quickly and precisely calculated.
Equation (7) is a new algorithm for a lens-based microscopy system, which could calculate the intensity of particular pixels on the image plane rapidly. In some researches, the intensity distribution of entire plane is not necessary, but one or several points is of interest. In these cases, using Eq. (7) can greatly accelerate the calculation.
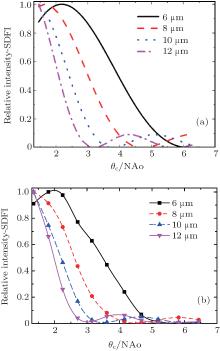
For simplicity, we perform an optical experiment to confirm the correctness of the SDFI theory. Instead of synchrotron radiation x-ray, we use a laser diode (wavelength: 650 nm) as a light source, and use a rotating ground glass to remove coherence of the laser. The other x-ray components (condenser, zone plate) are replaced by optic lenses, which are much easier to fabricate. The Rayleigh resolution of our optical system is about 18 μ m. The sample for optical experiment is an opaque membrane with holes, which have sizes ranging from 4 μ m to 15 μ m and are arranged individually on it. In the experiment, we measure the intensity data at θ c positions of 1.4, 1.8, 2.3, 2.7, 3.2, 3.6, 4.2, 4.7, 5.2, 5.8, and 6.4 times NAo, respectively. Figure 3 shows the calculated SDFI curves (Fig. 3(a)) and the measured SDFI curves (Fig. 3(b)) corresponding to the experimental results. Considering the existence of experimental errors, the results match the simulation curves well. Firstly, the shapes of calculated curves accord with those measured in experiment; secondly, relative positions of curves of different sample sizes matches well. Thus, we are able to distinguish different sizes of particles below Rayleigh resolution.
 | Fig. 3. (a) Simulated SDFI curves of individual holes with sizes of 6 μ m, 8 μ m, 10 μ m, and 12 μ m. (b) Corresponding SDFI curves measured with the optical setup. |
The basic theory of SDFI is based on wave optics, so the change of wavelength does not affect its validity. In fact, SDFI is suitable for all-wave band microscopes, including optical, x-ray and electron microscopes. Therefore, although the experiment is performed at optical wave range instead of x-ray range, we consider the optical experiment a convincing proof for SDFI theory.
The condensers with large NA are essential to SDFI system compared with the conventional TXM system. In addition, the total inner reflection of capillary condensers typically offers significantly higher focusing efficiency than zone plate condensers for x-ray applications, which is important for achieving high throughput. Alternatively, the structured illumination can be achieved using a condenser with a sufficiently large and wide NA and a set of suitably designed annular apertures to select the desired structured illumination.
The exposure time is an important consideration in applying the SDFI method and it depends on the angular width of the illumination beam and also the physical property of the voids or particles, such as size, shape, and composition at the operating x-ray energy. Typically, a Δ θ c of about one tenth of the NAo offers sufficient scanning accuracy and comparable illumination flux to that obtained in a conventional Zernike phase contrast imaging system. The scattering intensity of voids or particles as a function of size and density can be calculated using the new formula. Small particles scatter more photons at high angles therefore the exposure time at high angles is comparable to that at lower angles, while for large particles the required exposure time decreases quickly with the decrease of θ c.
We explain the basic theory of structured dark-field imaging in more detail by extending its scope to single particle case. Experiments within visible light wavelength of single particle sample of four different sizes are performed and the results agree well with the theory. By simplifying integral calculus, time complexity of the new algorithm used for SDFI becomes O(n), compared with the conventional O(n4). We can expect that SDFI will be generalized to more complex systems by using our fast algorithm.
| 1 |
|
| 2 |
|
| 3 |
|
| 4 |
|
| 5 |
|
| 6 |
|
| 7 |
|
| 8 |
|
| 9 |
|
| 10 |
|
| 11 |
|
| 12 |
|
| 13 |
|
| 14 |
|
| 15 |
|
| 16 |
|
| 17 |
|
| 18 |
|