Liu Shi-Dong, Zhao Yong-Tao†, Wang Yu-Yu‡, N Stolterfoht, Cheng Rui, Zhou Xian-Ming, Xu Hu-Shan, Xiao Guo-Qing. Analytical model for describing ion guiding through capillaries in insulating polymers. Chinese Physics B, 24(8): 086104
Permissions
Analytical model for describing ion guiding through capillaries in insulating polymers
Liu Shi-Donga),b), Zhao Yong-Tao†a), Wang Yu-Yu‡a), N Stolterfohtc), Cheng Ruia), Zhou Xian-Minga), Xu Hu-Shana), Xiao Guo-Qinga)
Institute of Modern Physics, Chinese Academy of Sciences, Lanzhou 730000, China
University of Chinese Academy of Sciences, Beijing 100049, China
Helmholtz–Zentrum Berlin für Materialien und Energie, 14109 Berlin, Germany
*Project supported by the Major State Basic Research Development Program of China (Grant No. 2010CB832902) and the National Natural Science Foundation of China (Grant Nos. 11275241, 11275238, 11105192, and 11375034).
Abstract
An analytical description for guiding of ions through nanocapillaries is given on the basis of previous work. The current entering into the capillary is assumed to be divided into a current fraction transmitted through the capillary, a current fraction flowing away via the capillary conductivity and a current fraction remaining within the capillary, which is responsible for its charge-up. The discharging current is assumed to be governed by the Frenkel–Poole process. At higher conductivities the analytical model shows a blocking of the ion transmission, which is in agreement with recent simulations. Also, it is shown that ion blocking observed in experiments is well reproduced by the analytical formula. Furthermore, the asymptotic fraction of transmitted ions is determined. Apart from the key controlling parameter (charge-to-energy ratio), the ratio of the capillary conductivity to the incident current is included in the model. Differences resulting from the nonlinear and linear limits of the Frenkel–Poole discharge are pointed out.
PACS:
61.85.+p; 34.50.Fa; 71.45.Gm
Keyword:
ion guiding; charging and discharging time; blocked transmission; asymptotic transmission
Guiding of slow highly charged ions through insulating nanocapillaries has been discovered more than a decade ago.[1] The guiding phenomenon has been attributed to a self-organized creation of charge patches on the inner walls of the capillaries.[1, 2] Ions entering into the tilted capillary deposit charges in the entrance region generating an electric deflecting field so that subsequent ions are deflected towards the capillary exit. The ions are guided at relatively large distances away from the capillary wall so that electron capture into the projectile is inhibited. As a result, the major fraction of highly charged ions remains in their initial charge state.
The dynamic feature of ion guiding in which the angular distribution of the transmitted ions exhibits oscillatory behavior with increasing irradiation time revealed that additional weaker charge patches are produced further inside the capillary.[1– 11] Thus, the ions are guided along the capillary axis while undergoing several deflections. At sufficiently long irradiation time, equilibrium is attained for which the fraction of transmitted ions and their emission angle stabilize.
Originally, attention was focused on guiding properties at equilibrium by varying experimental parameters such as the capillary material and dimension as well as the projectile energies and charge states. Until now, various capillaries in different insulating materials such as polyethylene terephthalate (PET), [1, 6, 12] SiO2, [2, 13] Al2O3, [4, 14, 15] polycarbonate (PC), [16, 17] and Si3N4[18] have been employed in several laboratories to verify the ion guiding effect. Additional work has been performed concerning the guiding properties of a single-glass capillary (tapered, [19– 23] straight, [24, 25]) to bend and focus slow highly charged ions, which may be a promising tool due to their low-cost and simple manufacture. Besides positive ions, electrons, [26, 27] negative ions, [28, 29] and molecular ions[30] have been used as projectiles. A variety of other significant results are published in Refs. [31]– [35] and in the references given above.
Most of the more recent investigations of the guiding effect are focused on the dynamic properties, i.e., the time evolution of ion transmission through insulating capillaries. In general, the transmitted ion intensity first increases with irradiation time and finally achieves saturation at equilibrium.[4– 6, 23] The increase of the transmitted intensity reflects the charge-up process whose charging time changes with the tilt angle, [5, 36] incident current, [37, 38] the capillary dimension, [31] and its materials.[16] The oscillations of the mean deflection angles due to additional charge patches formed within the capillary have been reproduced in simulations.[8– 11]
A further important dynamic property is that after the rise to a maximum value the transmitted ion intensity exhibits a decrease, referred to as blocking effect.[16, 21, 39, 40] Experimental results indicate that the ion blocking develops faster at smaller tilt angles. This may be due to collective effects of neighboring capillaries.[39, 40] On the other hand, recent simulation with a single nanocapillary implies that the higher conductivity of the material can also lead to ion blocking.[10]
In this paper, we present an analytical formula to describe the transmission of ions guided through insulating capillaries. The formula can be employed to explain the ion blocking caused by higher conductivity of the capillary materials. Section 2 introduces the analytic model based on previous work.[1] In Section 3, the time evolution of the fraction of transmitted ions is investigated by means of the analytic formula. It is concluded that higher conductivities can produce ion blocking. The asymptotic ion fraction (i.e., the ion transmission for irradiation time t → ∞ ) is discussed in Section 4. Conclusions are given in Section 5.
2. Method of analysis
The present analysis incorporates analytical expressions proposed previously.[1] The current Jin entering into the capillary splits into the current Jdep deposited on the inner wall, Jdis flowing away via the capillary conductivity and Jtr transmitted through the capillary
The deposited current Jdep is responsible for the capillary charging. It will be shown that the discharging current Jdis is influenced by the deposited charge Qdep collected by means of the deposited current Jdep. Consequently, the transmitted current Jtr depends on the charge Qdep deposited on the capillary wall. This point is consistent with the self-organized charge-up governing the capillary guiding.
In order to obtain the deposited charge Qdep, we assume that the capillary is similar to a cylindrical capacitor so that the deposited charge Qdep is given in the following form:
where Q∞ is the charge which is needed to achieve ion guiding, and τ dep represents the charging time of the capillary. It has been shown experimentally that τ dep depends on the tilt angle, [5, 16, 21, 36] incident current, [37, 38] the capillary dimension, [31] and its materials.[16] In fact, equation (2) can be deduced in terms of a linear model[1] in which the capillary conductivity is independent of the deposited charge Qdep. However, it has been found that equation (2) is applicable in cases where the results are dominated by nonlinear effects.[38] The equilibrium charge is given as Q∞ = Jinτ dep.[1] This relation is retained for the following analysis. However, it should be pointed out that it is difficult to determine τ dep theoretically so that τ dep is introduced as an adjustable parameter here. Using the relation of Jdep = dQdep /dt, we get
The discharging current is determined by the capillary conductivity. For nanocapillaries the surface conductivity is much larger than the bulk conductivity, [9, 10] whereas the bulk conductivity is dominant for a macrocapillary.[41] The sharp increase of the surface conductivity is governed by the Frenkel– Poole process, [42] which describes the conductivity produced by thermal electron liberation from deep traps enhanced by the lowering of the potential barrier by a high electric field
with
where, σ 0 is the capillary conductivity for a small field and E represents the electric field created by the charges deposited on the capillary inner wall. Moreover, E0 is a characteristic field with the temperature T and the Boltzmann constant k. It is assumed that the field E inside the capillary is proportional to the deposited charges, which are mostly located near the capillary entrance.[8– 11]
From the Frenkel– Poole model follow the discharging current Jdis can be written as[38]
where Qdep is the deposited charge on the inner wall; τ dis is the discharging time constant associated with the material properties, and Q0 is a characteristic charge governing the exponential increase of the discharging current. Similar to a capacitor, the discharging time τ dis can be described as τ dis = Ce/σ 0 with a suitable capacity of the capillary. One may argue that for a capacitor the charging and discharging time should be equal. However, previous experiments[1, 38] show that these two constants are different for nanocapillaries in PET. The difference likely results from the nonlinear effects of the charge transport. This is the reason why the charging time τ dep is introduced as a free parameter as stated above.
Inserting Eq. (2) into Eq. (5) leads to the discharging current
where α = τ dep / τ dis which is an important parameter for determining the features of ion guiding. Generally, it follows that α ≪ 1 as a result of τ dep ≪ τ dis. In the following, it will be shown that the shape of the curve of ions transmitted with time is strongly governed by the α value.
Combining Eqs. (1), (3), and (5), the time evolution of the transmitted ion fraction is obtained as
The second term in Eq. (7) results from the nonlinear effects of the discharging represented by Eq. (5). For α → 0 the nonlinear effect on the discharging current disappears. Then, equation (7) reduces to the expression [1− exp(− t/τ dep)] as obtained by a linear model.[1, 9] Although specific experimental results agree with the linear model, most guiding features are reproduced by the nonlinear model. In Eq. (7) the nonlinear term is responsible for blocking effects, which will be analyzed in the following.
3. Dynamic properties of ion guiding
In this section, emphasis is devoted to the evolution of the transmitted ion fraction as a function of the irradiation time. First, the time evolution of transmitted ion fraction is exhibited for different capillary conductivities. Then, the analytical model is employed to fit the experimental ion transmissions through PC capillaries.[16]
To obtain the physical picture of the dynamics of ion guiding, it is useful to consider results available from previous experiments and simulations. It has been experimentally shown that the upper limitation for the electric field inside the capillary etched in PC or PET insulators is ∼ 100 V/μ m.[43] Moreover, the characteristic field E0 introduced in Eq. (4) is ∼ 1.3 V/μ m at room temperature. Thus, the maximum value of Qdep(t)/Q0 is equal to E/E0 of ∼ 75 since the electric field is approximately proportional to the deposited charges. The experiments yielded the value of ∼ 100.[3, 38] However, for analyzing the time evolution, we adopt an intermediate value of 50 for Q∞ /Q0 with which the transmission is stable.[10]
Due to the wide range of the incident current and the different dimensions of the capillaries employed in the experiments, the value of α is difficult to determine. For a typical case with the current density of nA/mm2, the charging time τ dep is of the order of a few minutes. The discharging time τ dis obtained by fitting experimental data, however, is of the order of 104 min or even longer.[3, 36, 38] It should be added that the small value of about 40 min was reported in Ref. [1] because the discharging was measured only for one hour. If the measurement would have been performed for a long time, a large value could be found. Thus, in order to reveal the ion transmission we shall vary the α value around 10− 4 which is in accordance with model results given in Refs. [3], [36], and [38].
3.1. The influence of conductivities on the transmission
Figure 1 shows the transmitted ion fraction ftr as a function of the irradiation time. The values of Q∞ /Q0 and τ dep are fixed at 50 and 2 min, respectively, whereas the discharging time τ dis associated with the conductivity is treated as a variable. The essential differences in the time evolution for the varying discharging time are clearly visible. Stable guiding is established when the discharging time is relatively large, which corresponds to a lower conductivity of the capillary material (see left-hand column of the graph). Moreover, the lower conductivity gives rise to a high transmitted ion fraction, which indicates that for this case the capillaries own a higher capability to guide ions.
Fig. 1. Time evolutions of the transmitted ion fraction with different α = τ dep/τ dis values indicated in each column of this figure. The ion fraction is calculated using Eq. (7). The charging time is set at 2 min, and the discharging time is considered to be an adjustable parameter.
On the contrary, for faster discharging time of α ≥ 0.0004 associated with a higher conductivity, a partial blocking of the ion transmission is achieved leading asymptotically to a smaller ion transmission. A similar conclusion was drawn in recent simulations.[10] This indicates that our analytical model is suitable to describe basic properties of the guiding dynamics. It should be added in accordance with previous simulations[8] that no transmission can be observed when the conductivity is further increased. The decreasing ion transmission can be understood since the deposited charges are quickly depleted as a result of the higher conductivity so that the generated field is insufficient to deflect the following ions. It is noteworthy from Eq. (7) that this kind of blocking caused by the higher conductivity is an inevitable product of the nonlinear effect on the discharging current. With the linear version[1] of the present model, this blocking cannot be observed.
It should be added that blocking of the ion transmission may also occur as a result of overcharging the patches, which may lead to irregular fluctuation in the ion guiding.[24] However, this overcharging was observed only for cases of a linear charge transport.[41] With nonlinear effects on the discharge, overloading of the deposited charge patch is unlikely to happen, since the deposited charges would readily transport away by the sharply increased conductivity (see Eq. (4)). Hence, it is expected that the ion blocking observed in experiments[16] is primarily caused by the higher conductivity for PC.
3.2. Fitting of experimental blocking curves
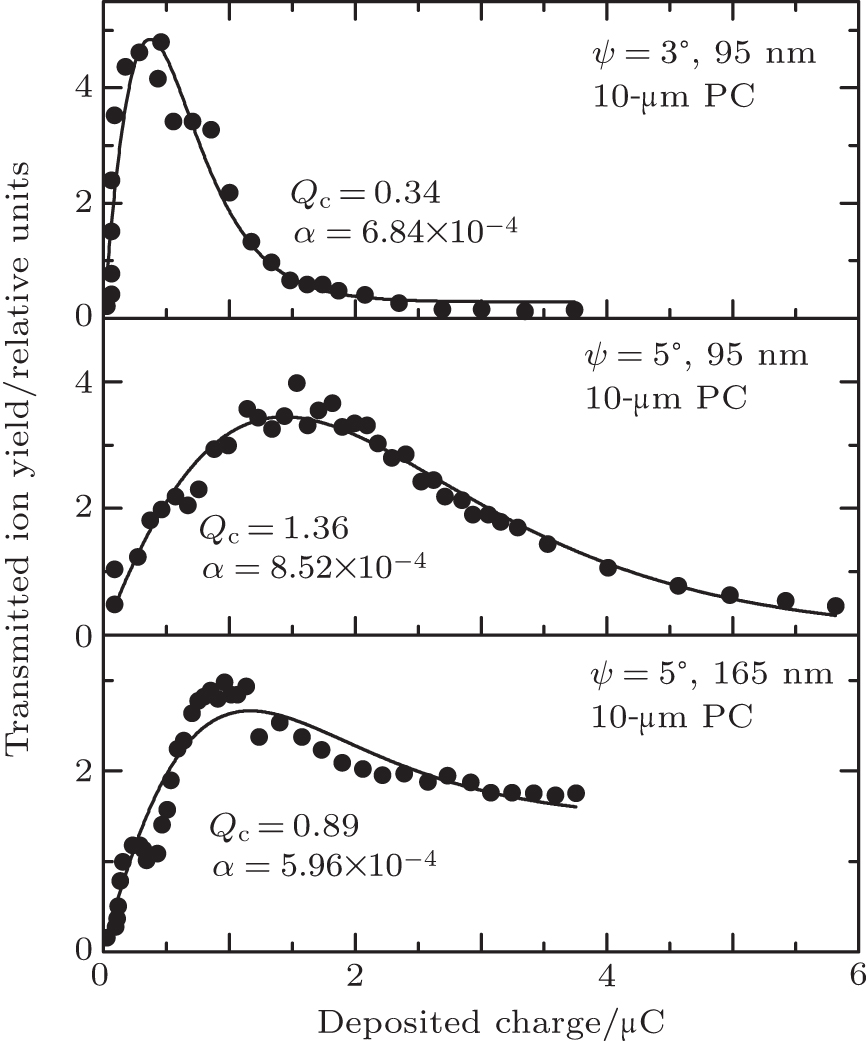
In this section experimental data for ion blocking are reproduced by the present analytical model. These data are taken from Ref. [16] in which 3-keV Ne7+ ions are guided through the capillaries with a length of 10 μ m and different diameters as indicated in Fig. 2. The tilt angles and diameters of the capillaries are indicated in the graph. As shown in Fig. 2 the experimental data for ion blocking[16] can well be fitted by Eq. (7). This may not be a surprise, since the present model includes various free parameters. As mentioned above, the parameter Q∞ /Q0 is fixed at ∼ 50 in order to reduce the number of the free parameters in Eq. (7). To achieve agreement between the maximum values of the experimental and theoretical results, equation (7) is multiplied by an adjustable factor. It should be noted, however, that the value of Qc for ψ = 3° obtained by our analytical model is about 10 times larger than that obtained by fitting the rising part of the ion yield with an exponential growth function.[16] It may be due to the fact that the ion yield starts to decrease before the rising part of ion yield reaches saturation.
Fig. 2. Fitting through the experimental data (dots[16]). The solid line is obtained using Eq. (7) with Q∞ /Q0 fixed at ∼ 50. Other fitting parameters are given in the graph.
It should be noted that additional data of the blocked transmission, measured previously, [39] can also reasonably be fitted by our analytical model. In any case, we have shown that our analytical formula can generally reproduce the experimental results.[16, 39]
4. The asymptotic transmission
According to foregoing discussions, the ion fraction either increases to saturation or decreases to a lower limit (referred to as equilibrium transmission and blocked transmission, respectively), which asymptotically approach constant values. Thus, we use the notation asymptotic transmission for both cases.
To obtain the asymptotic ion transmission, we set t → ∞ in Eq. (7) with replacement of α so that the fraction of transmitted ions is expressed as
It is seen from Eq. (8) that the transmitted ion fraction is governed only by the charging time τ dep since τ dis is a constant, which is related to material properties.
It is recalled that the charging time τ dep is defined by means of the charge Q∞ and the incident current Jin
As shown previously, [3] the ion is preferentially guided through the capillary when its perpendicular energy T⊥ satisfies the relation
where Tp is the projectile energy, and Up is the potential characteristic for the entrance region of the capillary. With a suitable capacity Ce of the capillary, the potential can be obtained by
Therefore, equations (9)– (11) can be combined to obtain the charging time τ dep as
Using this expression, equation (8) can be written as
where σ 0 = Ce/τ dis. In the case of the linear model, equation (13) is reduced as
From Eqs. (13) and (14), it is seen that the dependence of the transmitted ion fraction on the tilt angle can be described by a parabolic equation. However, in the literatures a Gaussian-type expression[36] is generally used to describe the transmitted ion fraction. This disagreement is attributed to various simplifications and approximations in our analysis. Nevertheless, our analytical model can reveal the key parameters (projectile energy-to-charge ratio Tp/q and sin2ψ ) which govern the capillary guiding.
It should be noted that the ratio of the conductivity σ 0 to the incident current Jin is another parameter explicitly included in Eqs. (13) and (14). Hence, the results obtained by varying the conductivity with a constant incident current will be the same as those obtained by keeping the conductivity and varying the incident current. The only distinction between Eqs. (13) and (14) is the nonlinear term exp . However, the physical phenomena behind these two formulas are quite different. It is worth noting that the linear model applies to macrocapillaries in which ion guiding is mainly governed by the bulk conductivity while the nonlinear model applies to nanocapillaries for which the surface conductivity is dominant.[41]
From Eq. (14), which is based on the linear model, it readily follows that the fraction of ions transmitted through capillaries with lower conductivities is higher, in agreement with the recent experiments[24] and simulation.[41] It implies in certain limits that macrocapillaries with lower conductivity have a higher capability to guide ions.
On the other hand, as shown in previous experiments with nanocapillaries, [38] the fraction of transmitted ions increases only slightly with the incident current. This result can be understood from the nonlinear Eq. (13). It has been shown in previous experiments[38] that Q∞ /Q0 increases slightly with incident current. This slight increase is enhanced by the exponential function so that the decrease by the inverse incident current is compensated. Thus, we may interpret the near constancy of the transmitted ion fraction with a change of the ion current by more than two orders of magnitude.[38]
5. Summary
In summary, the focus of this work is to derive an analytical formula for ion guiding that takes place within insulating capillaries. It is assumed that the current incident into the capillary splits into the current transmitted through the capillary, the current transported away by the capillary conductivity, and the remaining current charging the capillary. The capillary charge-up process is assumed to be similar to that of a cylindrical capacitor. The discharging current is expressed by a nonlinear exponential law, which is governed by the Frenkel– Poole process.
It is shown that for capillaries with higher conductivity, the ion transmission is blocked either partially or fully. The experimental data[16] of blocked transmission can be well fitted by our analytical formula. This finding, which is consistent with the results obtained in previous simulations, [10] is an inevitable result produced by nonlinear effects on discharging current.
In addition, the governing parameters for asymptotic ion transmission are derived. It is indicated that the ion fraction depends not only on the ratio of the ion energy to charge state and the tilt angle, but also on the ratio of the capillary conductivity to the ion current. In the case of nonlinear model, the variation of the ratio σ 0/Jin is likely to be compensated by the exponential term exp so that the ion transmission exhibits minor changes. On the contrary, in the case of the linear model, the variation of the ratio σ 0/Jin leads to a change of the ion transmissions in agreement with a recent experiment.[24]
SahanaM B, SkogP, VíkorGy, Rajendra KumarR T and SchuchR2006Phys. Rev. A73040901DOI:10.1103/PhysRevA.73.040901[Cited within:1]
14
ChenX M, XiF Y, QiuX Y, ShaoJ X, XiaoG Q, CuiY, SunG Z, WangJ, ChenY F, LiuH P, YinY Z, WangY Y, LiD H, LouF J, WangX A, XJ K and ZhouC L2009Chin. Phys. B181955DOI:10.1088/1674-1056/18/5/038[Cited within:1]
15
ChenY F, ChenX M, LouF J, XuJ Z, ShaoJ X, SunG Z, WangJ, XiF Y, YinY Z, WangX A, XuJ K, CuiY and DingB W2009Chin. Phys. B182739DOI:10.1088/1674-1056/18/7/019[Cited within:1]
IkedaT, KanaiY, KojimaT M, IwaiY, KambaraT, YamazakiY, HoshinoM, NebikiT and NarusawaT2006Appl. Phys. Lett. 89163502DOI:10.1063/1.2362642[Cited within:2]
FengD, ShaoJ X, JiM C, ZouX R, WangG Y, MaY Z, ZhouW, ZhouH, LiY, ZhouM and ChenX M2009Phys. Rev. A85064901[Cited within:1]
29
LvX Y, ChenL, ChenX M, JiaJ J, ZhouP, ZhouC L, QiuX Y, ShaoJ X, CuiY, YinY Z, WangH W and JiM C2011Chin. Phys. B20013401DOI:10.1088/1674-1056/20/1/013401[Cited within:1]
StolterfohtN, HellhammerR, JuhászZ, SulikB, BayerV, TrautmannC, BodewitsE, de NijsA J, DangH M and HoekstraR2009Phys. Rev. A79042902DOI:10.1103/PhysRevA.79.042902[Cited within:1]
12
2002
0.0
0.0
... [1] The guiding phenomenon has been attributed to a self-organized creation of charge patches on the inner walls of the capillaries ...
... [1,2] Ions entering into the tilted capillary deposit charges in the entrance region generating an electric deflecting field so that subsequent ions are deflected towards the capillary exit ...
... [1#cod#x2013 ...
... Until now, various capillaries in different insulating materials such as polyethylene terephthalate (PET),[1,6,12] SiO2,[2,13] Al2O3,[4,14,15] polycarbonate (PC),[16,17] and Si3N4[18] have been employed in several laboratories to verify the ion guiding effect ...
... [1] In Section#cod#x00A0 ...
... [1] The current Jin entering into the capillary splits into the current Jdep deposited on the inner wall, Jdis flowing away via the capillary conductivity and Jtr transmitted through the capillary ...
... (2) can be deduced in terms of a linear model[1] in which the capillary conductivity is independent of the deposited charge Qdep ...
... [1] This relation is retained for the following analysis ...
... However, previous experiments[1,38] show that these two constants are different for nanocapillaries in PET ...
... [1,9] Although specific experimental results agree with the linear model, most guiding features are reproduced by the nonlinear model ...
... [1] because the discharging was measured only for one hour ...
... With the linear version[1] of the present model, this blocking cannot be observed ...
2
2008
0.0
0.0
... [1,2] Ions entering into the tilted capillary deposit charges in the entrance region generating an electric deflecting field so that subsequent ions are deflected towards the capillary exit ...
... Until now, various capillaries in different insulating materials such as polyethylene terephthalate (PET),[1,6,12] SiO2,[2,13] Al2O3,[4,14,15] polycarbonate (PC),[16,17] and Si3N4[18] have been employed in several laboratories to verify the ion guiding effect ...
4
2003
0.0
0.0
... [3,38] However, for analyzing the time evolution, we adopt an intermediate value of 50 for Q#cod#x221E ...
... [3,36,38] It should be added that the small value of about 40#cod#x00A0 ...
... [3],[36], and [38] ...
... As shown previously,[3] the ion is preferentially guided through the capillary when its perpendicular energy T#cod#x22A5 ...
2
2007
0.0
0.0
... Until now, various capillaries in different insulating materials such as polyethylene terephthalate (PET),[1,6,12] SiO2,[2,13] Al2O3,[4,14,15] polycarbonate (PC),[16,17] and Si3N4[18] have been employed in several laboratories to verify the ion guiding effect ...
... [4#cod#x2013 ...
2
2009
0.0
0.0
... 6,23] The increase of the transmitted intensity reflects the charge-up process whose charging time changes with the tilt angle,[5,36] incident current,[37,38] the capillary dimension,[31] and its materials ...
... dep depends on the tilt angle,[5,16,21,36] incident current,[37,38] the capillary dimension,[31] and its materials ...
2
2009
0.0
0.0
... Until now, various capillaries in different insulating materials such as polyethylene terephthalate (PET),[1,6,12] SiO2,[2,13] Al2O3,[4,14,15] polycarbonate (PC),[16,17] and Si3N4[18] have been employed in several laboratories to verify the ion guiding effect ...
... 6,23] The increase of the transmitted intensity reflects the charge-up process whose charging time changes with the tilt angle,[5,36] incident current,[37,38] the capillary dimension,[31] and its materials ...
1
2010
0.0
0.0
3
2005
0.0
0.0
... [8#cod#x2013 ...
... [8#cod#x2013 ...
... It should be added in accordance with previous simulations[8] that no transmission can be observed when the conductivity is further increased ...
2
2005
0.0
0.0
... For nanocapillaries the surface conductivity is much larger than the bulk conductivity,[9,10] whereas the bulk conductivity is dominant for a macrocapillary ...
... [1,9] Although specific experimental results agree with the linear model, most guiding features are reproduced by the nonlinear model ...
5
2013
0.0
0.0
... [10] ...
... For nanocapillaries the surface conductivity is much larger than the bulk conductivity,[9,10] whereas the bulk conductivity is dominant for a macrocapillary ...
... [10] ...
... [10] This indicates that our analytical model is suitable to describe basic properties of the guiding dynamics ...
... This finding, which is consistent with the results obtained in previous simulations,[10] is an inevitable result produced by nonlinear effects on discharging current ...
3
2013
0.0
0.0
... 11] Thus, the ions are guided along the capillary axis while undergoing several deflections ...
... 11] ...
... 11] ...
1
2005
0.0
0.0
... Until now, various capillaries in different insulating materials such as polyethylene terephthalate (PET),[1,6,12] SiO2,[2,13] Al2O3,[4,14,15] polycarbonate (PC),[16,17] and Si3N4[18] have been employed in several laboratories to verify the ion guiding effect ...
1
2006
0.0
0.0
... Until now, various capillaries in different insulating materials such as polyethylene terephthalate (PET),[1,6,12] SiO2,[2,13] Al2O3,[4,14,15] polycarbonate (PC),[16,17] and Si3N4[18] have been employed in several laboratories to verify the ion guiding effect ...
1
2009
0.0
0.0
... Until now, various capillaries in different insulating materials such as polyethylene terephthalate (PET),[1,6,12] SiO2,[2,13] Al2O3,[4,14,15] polycarbonate (PC),[16,17] and Si3N4[18] have been employed in several laboratories to verify the ion guiding effect ...
1
2009
0.0
0.0
... Until now, various capillaries in different insulating materials such as polyethylene terephthalate (PET),[1,6,12] SiO2,[2,13] Al2O3,[4,14,15] polycarbonate (PC),[16,17] and Si3N4[18] have been employed in several laboratories to verify the ion guiding effect ...
12
2011
0.0
0.0
... Until now, various capillaries in different insulating materials such as polyethylene terephthalate (PET),[1,6,12] SiO2,[2,13] Al2O3,[4,14,15] polycarbonate (PC),[16,17] and Si3N4[18] have been employed in several laboratories to verify the ion guiding effect ...
... [16] The oscillations of the mean deflection angles due to additional charge patches formed within the capillary have been reproduced in simulations ...
... [16,21,39,40] Experimental results indicate that the ion blocking develops faster at smaller tilt angles ...
... dep depends on the tilt angle,[5,16,21,36] incident current,[37,38] the capillary dimension,[31] and its materials ...
... [16] In fact, equation#cod#x00A0 ...
... [16] ...
... Hence, it is expected that the ion blocking observed in experiments[16] is primarily caused by the higher conductivity for PC ...
... [16] in which 3-keV Ne7#cod#x002B ...
... 2 the experimental data for ion blocking[16] can well be fitted by Eq ...
... [16] It may be due to the fact that the ion yield starts to decrease before the rising part of ion yield reaches saturation ...
... [16,39] ...
... The experimental data[16] of blocked transmission can be well fitted by our analytical formula ...
1
2009
0.0
0.0
... Until now, various capillaries in different insulating materials such as polyethylene terephthalate (PET),[1,6,12] SiO2,[2,13] Al2O3,[4,14,15] polycarbonate (PC),[16,17] and Si3N4[18] have been employed in several laboratories to verify the ion guiding effect ...
1
2006
0.0
0.0
... Until now, various capillaries in different insulating materials such as polyethylene terephthalate (PET),[1,6,12] SiO2,[2,13] Al2O3,[4,14,15] polycarbonate (PC),[16,17] and Si3N4[18] have been employed in several laboratories to verify the ion guiding effect ...
1
2012
0.0
0.0
... Additional work has been performed concerning the guiding properties of a single-glass capillary (tapered,[19#cod#x2013 ...
1
2011
0.0
0.0
2
2009
0.0
0.0
... [16,21,39,40] Experimental results indicate that the ion blocking develops faster at smaller tilt angles ...
... dep depends on the tilt angle,[5,16,21,36] incident current,[37,38] the capillary dimension,[31] and its materials ...
1
2008
0.0
0.0
2
2006
0.0
0.0
... 23] straight,[24,25]) to bend and focus slow highly charged ions, which may be a promising tool due to their low-cost and simple manufacture ...
... 6,23] The increase of the transmitted intensity reflects the charge-up process whose charging time changes with the tilt angle,[5,36] incident current,[37,38] the capillary dimension,[31] and its materials ...
4
2012
0.0
0.0
... 23] straight,[24,25]) to bend and focus slow highly charged ions, which may be a promising tool due to their low-cost and simple manufacture ...
... [24] However, this overcharging was observed only for cases of a linear charge transport ...
... (14), which is based on the linear model, it readily follows that the fraction of ions transmitted through capillaries with lower conductivities is higher, in agreement with the recent experiments[24] and simulation ...
... [24] ...
1
2009
0.0
0.0
... 23] straight,[24,25]) to bend and focus slow highly charged ions, which may be a promising tool due to their low-cost and simple manufacture ...
1
2007
0.0
0.0
... Besides positive ions, electrons,[26,27] negative ions,[28,29] and molecular ions[30] have been used as projectiles ...
1
2011
0.0
0.0
... Besides positive ions, electrons,[26,27] negative ions,[28,29] and molecular ions[30] have been used as projectiles ...
1
2009
0.0
0.0
... Besides positive ions, electrons,[26,27] negative ions,[28,29] and molecular ions[30] have been used as projectiles ...
1
2011
0.0
0.0
... Besides positive ions, electrons,[26,27] negative ions,[28,29] and molecular ions[30] have been used as projectiles ...
1
2005
0.0
0.0
... Besides positive ions, electrons,[26,27] negative ions,[28,29] and molecular ions[30] have been used as projectiles ...
3
2005
0.0
0.0
... [31]#cod#x2013 ...
... 6,23] The increase of the transmitted intensity reflects the charge-up process whose charging time changes with the tilt angle,[5,36] incident current,[37,38] the capillary dimension,[31] and its materials ...
... dep depends on the tilt angle,[5,16,21,36] incident current,[37,38] the capillary dimension,[31] and its materials ...
1
2009
0.0
0.0
1
2005
0.0
0.0
1
2007
0.0
0.0
1
2012
0.0
0.0
... [35] and in the references given above ...
5
2004
0.0
0.0
... 6,23] The increase of the transmitted intensity reflects the charge-up process whose charging time changes with the tilt angle,[5,36] incident current,[37,38] the capillary dimension,[31] and its materials ...
... dep depends on the tilt angle,[5,16,21,36] incident current,[37,38] the capillary dimension,[31] and its materials ...
... [3,36,38] It should be added that the small value of about 40#cod#x00A0 ...
... [3],[36], and [38] ...
... However, in the literatures a Gaussian-type expression[36] is generally used to describe the transmitted ion fraction ...
2
2007
0.0
0.0
... 6,23] The increase of the transmitted intensity reflects the charge-up process whose charging time changes with the tilt angle,[5,36] incident current,[37,38] the capillary dimension,[31] and its materials ...
... dep depends on the tilt angle,[5,16,21,36] incident current,[37,38] the capillary dimension,[31] and its materials ...
11
2007
0.0
0.0
... 6,23] The increase of the transmitted intensity reflects the charge-up process whose charging time changes with the tilt angle,[5,36] incident current,[37,38] the capillary dimension,[31] and its materials ...
... dep depends on the tilt angle,[5,16,21,36] incident current,[37,38] the capillary dimension,[31] and its materials ...
... [38] The equilibrium charge is given as Q#cod#x221E ...
... Poole model follow the discharging current Jdis can be written as[38] ...
... However, previous experiments[1,38] show that these two constants are different for nanocapillaries in PET ...
... [3,38] However, for analyzing the time evolution, we adopt an intermediate value of 50 for Q#cod#x221E ...
... [3,36,38] It should be added that the small value of about 40#cod#x00A0 ...
... [3],[36], and [38] ...
... On the other hand, as shown in previous experiments with nanocapillaries,[38] the fraction of transmitted ions increases only slightly with the incident current ...
... It has been shown in previous experiments[38] that Q#cod#x221E ...
... [38] ...
4
2012
0.0
0.0
... [16,21,39,40] Experimental results indicate that the ion blocking develops faster at smaller tilt angles ...
... [39,40] On the other hand, recent simulation with a single nanocapillary implies that the higher conductivity of the material can also lead to ion blocking ...
... It should be noted that additional data of the blocked transmission, measured previously,[39] can also reasonably be fitted by our analytical model ...
... [16,39] ...
2
2013
0.0
0.0
... [16,21,39,40] Experimental results indicate that the ion blocking develops faster at smaller tilt angles ...
... [39,40] On the other hand, recent simulation with a single nanocapillary implies that the higher conductivity of the material can also lead to ion blocking ...
4
2014
0.0
0.0
... [41] The sharp increase of the surface conductivity is governed by the Frenkel#cod#x2013 ...
... [41] With nonlinear effects on the discharge, overloading of the deposited charge patch is unlikely to happen, since the deposited charges would readily transport away by the sharply increased conductivity (see Eq ...
... [41] ...
... [41] It implies in certain limits that macrocapillaries with lower conductivity have a higher capability to guide ions ...
1
1938
0.0
0.0
... Poole process,[42] which describes the conductivity produced by thermal electron liberation from deep traps enhanced by the lowering of the potential barrier by a high electric field ...
1
2009
0.0
0.0
... [43] Moreover, the characteristic field E0 introduced in Eq ...
Analytical model for describing ion guiding through capillaries in insulating polymers
[Liu Shi-Donga),b), Zhao Yong-Tao†a), Wang Yu-Yu‡a), N Stolterfohtc), Cheng Ruia), Zhou Xian-Minga), Xu Hu-Shana), Xiao Guo-Qinga)]


 , Wang Yu-Yu‡