Silicene: from monolayer to multilayer — A concise review
Li Hui† , Hui-Xia Fu, Meng Sheng
, Hui-Xia Fu, Meng Sheng 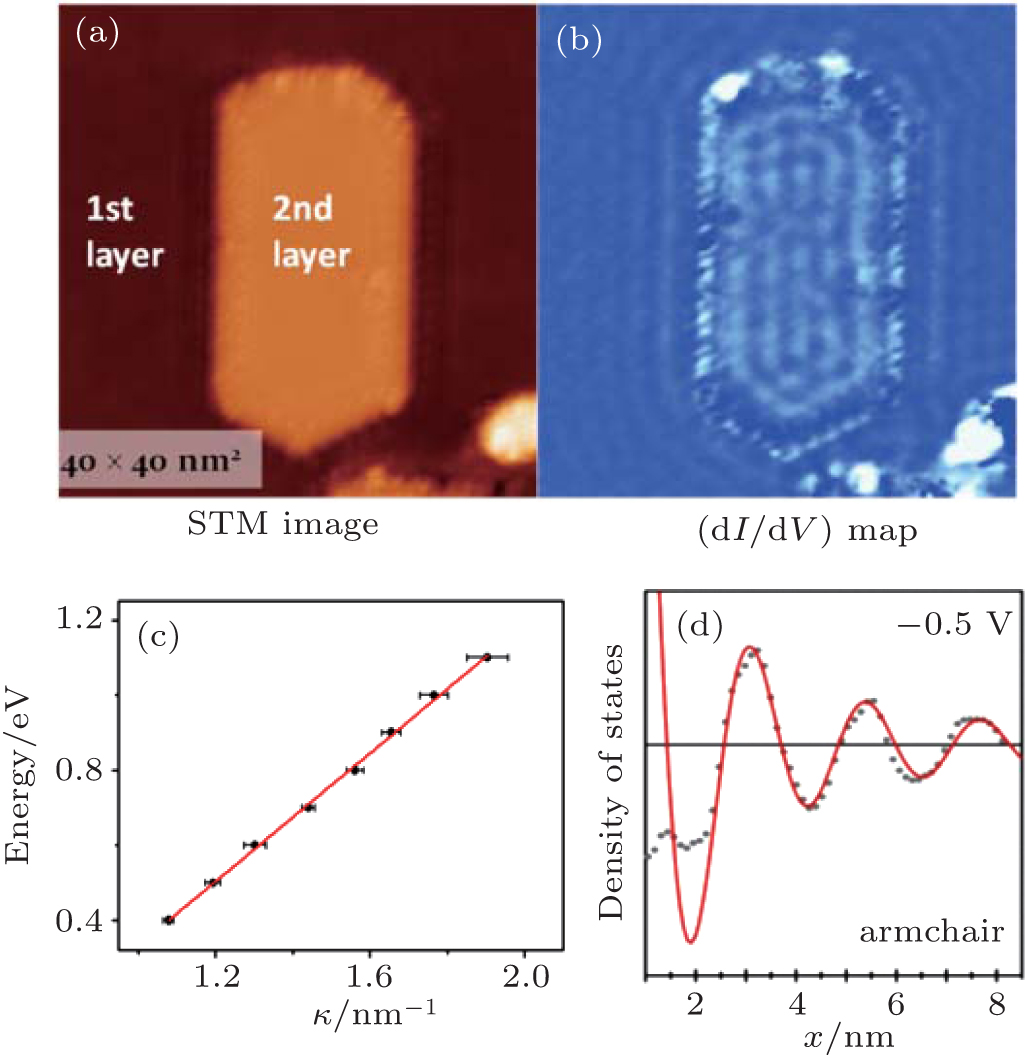
Silicene: from monolayer to multilayer — A concise review |
|
Li Hui†
, Hui-Xia Fu, Meng Sheng |
| (a) STM image (40 nm×40 nm) of SLS surface containing an island of BLS, taken at tip bias –1.0 V. (b) d I /d V map of the same area as panel (a), taken at tip bias of 0.5 V. (c) Energy dispersion as a function of κ for silicene, determined from the wavelength of QPI patterns. (d) LDOS on SLS as a function of distance from armchair edges at –0.5 V. The position of step edge is set at x = 0. Gray dots, experimental values; red lines, fits to the data.[ 9 , 21 ] |
| |