

Reactive oxygen species in plasma against E. coli cells survival rate
[Zhou Ren-Wua) , Zhang Xian-Hui†a)  , Zong Zi-Chao
b) , Li Jun-Xionga) , Yang Zhou-Bina) , Liu Dong-Pingb) , Yang Si-Zea) ]
, Zong Zi-Chao|
|

 , Zong Zi-Chao
†Corresponding author. E-mail: zhangxh@xmu.edu.cn
*Project supported by the Natural Science Foundation of Fujian Province, China (Grant No. 2014J01025), the National Natural Science Foundation of China (Grant No. 11275261), and the Funds from the Fujian Provincial Key Laboratory for Plasma and Magnetic Resonance, China.
In this paper, we report on the contrastive analysis of inactivation efficiency of E. coli cells in solution with different disinfection methods. Compared with the hydrogen peroxide solution and the ozone gas, the atmospheric-pressure He plasma can completely kill the E. coli cells in the shortest time. The inactivation efficiency of E. coli cells in solution can be well described by using the chemical reaction rate model. X-ray photoelectron spectroscopy (XPS) analysis shows that the C–O or C=O content of the inactivated E. coli cell surface by plasma is predominantly increased, indicating the quantity of oxygen-containing species in plasma is more than those of two other methods, and then the C–C or C–H bonds can be broken, leading to the etching of organic compounds. Analysis also indicates that plasma-generated species can play a crucial role in the inactivation process by their direct reactions or the decompositions of reactive species, such as ozone into OH radicals in water, then reacting with E. coli cells.
Sterilization is a physical or chemical process to eliminate microorganisms in the environment.[1– 4] Nonequilibrium atmospheric pressure plasma has received much attention in recent years due to its many advantages including operation at atmospheric pressure, low-temperature, long operative duration, and economical and simple systems.[5– 8] More importantly, atmospheric pressure plasma can generate a huge variety of reactive species, such as peroxide molecules, metastable particles, radicals, charged particles, and ultraviolet (UV) photons, which are supposed to be beneficial to environmental hygiene and healthcare in the fields of medicine, food safety, and cosmetics.[9– 11] Hydrogen peroxide (H2O2) and ozone (O3), acting as the reactive oxygen species (ROS), can react with organisms directly and be considered very effective against various kinds of microorganisms.[12– 14]
Although various biomedical applications of the atmospheric pressure plasma have been developed over the past decade, [15– 17] fundamental understanding of the bacterial inactivation process has remained insufficient. Few experiments have been performed to examine the atmospheric pressure plasma-induced destruction of the chemical structure of bacterial cells. In this study, the inactivation efficiency of E. coli cells by the atmospheric pressure cold plasma jet (APPJ) is compared with the one treated by the H2O2 solution or the ozone gas. The results show the APPJ has several significant advantages, including 1) the atmospheric-pressure plasma is more effective in inactivating E. coli cells than other methods; 2) the atmospheric-pressure plasma can be obtained by using He as a working gas which does not cause undesirable effects such as residual toxicity, environmental pollution, and health hazards to humans and animals.[18, 19] The APPJ is characterized by using optical emission spectroscopy, and the discharge power of the APPJ is measured as a function of discharge voltage. Surface chemical compositions of untreated and treated E. coli samples by XPS are compared to analyze the plasma inactivation process of E. coli cells obtained with these three treatment methods based on the experimental results.
The schematic diagram of the APPJ is illustrated in Fig. 1. The sterilization device mainly consists of a special designed convergent-shaped quartz tube, a high-voltage electrode, and a grounded electrode. This design can focus the APPJ and collect reactive radicals onto the surface of the treated sample. One 360-μ m-thick and 10-cm-long tungsten wire is inserted into a hollow fiber (400-μ m inner diameter and 1200-μ m outer diameter) that is sealed at one end acting as a high voltage electrode. The grounded electrode is a copper wire mesh (yellow line) covering the quartz tube, and 2 mm away from the nuzzle mouth. To avoid surface discharge and improve the discharge stability of the APPJ, the quartz tube is covered with a special designed quartz layer at one end. The He gas with a flow rate of 2.0 Standard Liter per Minute (SLM) is injected into the plasma device and flows through the quartz tube. The plasma device is driven by an AC power supply with a peak voltage (VP) range of 0 kV– 15 kV at a frequency of 7.0 kHz.
Applied voltage and discharge current are simultaneously measured using a Tektronix DPO5024 digital oscilloscope with a 1:1000 H.V. probe (Tektronix P6015A) and a Tektronix P2220 current probe. The discharge current for this plasma device is obtained by measuring the voltage over a small resistor (50 ω ), connected in series to ground. One capacitor of 2.0 μ F in series to ground is used to obtain a Lissajous figure of this discharge.[20] Measurements for the charges across this capacitor and the applied voltage across the discharge device result in a Lissajous figure, which is used to calculate the discharge power. Optical emission spectrum (OES) is obtained by using a SpectraPro-750i monochromator (Acton Research Cooporation) with a resolution of 0.05 nm in a wavelength range of 200 nm– 800 nm. OES is obtained by fixing the optical fiber into the outlet of the needle-shape APPJ.
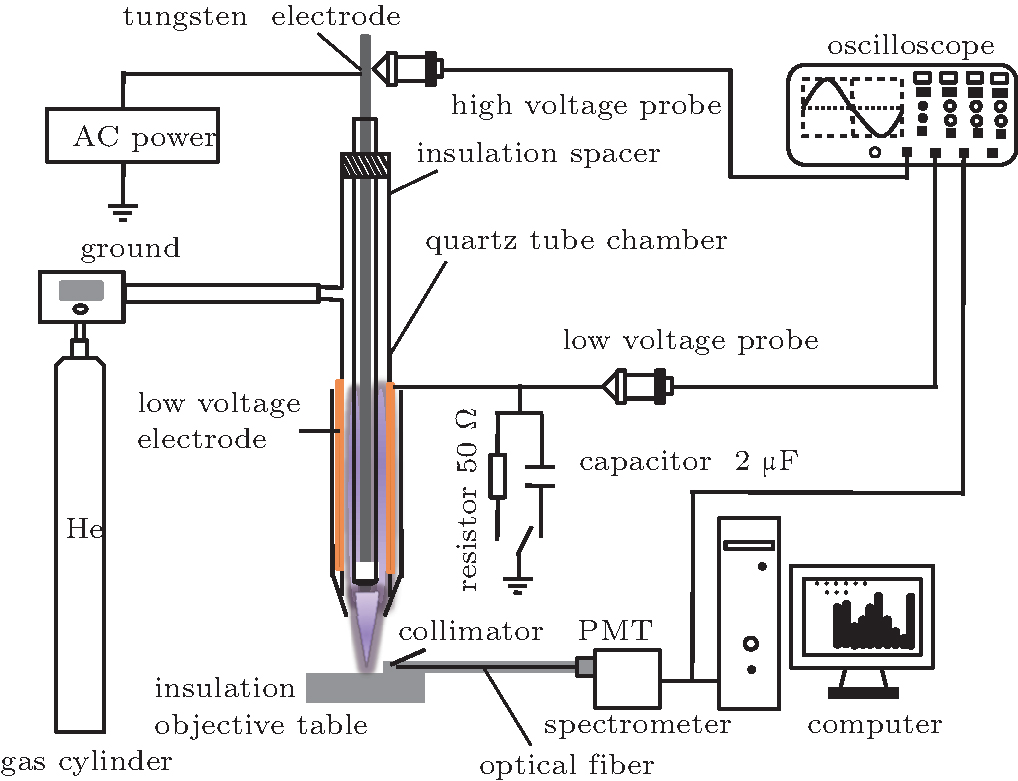 | Fig. 1. Schematic diagram of the experimental setup. |
A single colony of E. coli is inoculated into about 200-mL LB liquid medium (tryptone: 2 g, yeast extract: 1 g, NaCl: 2 g, distilled water: 200 g, pH= 7.2) and is cultivated on the shaking table with a spinning speed of 150 rpm at 27 ° C. The cultivation time is 48 h. Then, 6-μ l culture is transferred to the glass slide for plasma inactivation. The culture with an E. coli concentration of 106 CFU/mL is treated by using the APPJ while the untreated one is used as the control. The plasma inactivation treatment is performed at VP = 4.5 kV. After plasma inactivation, E. coli samples are washed out by 1-ml distilled water, and 300-μ l washed solution of E. coli is used to spread over agar media and incubated for 24 h under 27 ° C. The hydrogen peroxide sterilization is performed at different sterilization times. The hydrogen peroxide and E. coli concentrations are 5.0% and 108 CFU/mL, respectively. 6-μ l E. coli solution is transferred to 100-μ l H2O2 solution for H2O2 inactivation. After a certain time, 100-ml distilled water is immediately added into the H2O2 solution to slow down or stop the oxidation reaction. Then, 300-μ l diluted solutions with different treatment times are inoculated on the standard Petri dishes (9 cm in diameter) containing 15-mL LB solid medium. The static cultivation is kept at 27 ° C for 24 h. Ozone gas is generated by ozonizer (KT-KB10T, Shanghai) with the production of 3000 mg/h and controlled by gas flowmeter with a flow rate of 2.0 Standard Litre per Minute (SLM). 6-μ l culture with an E. coli concentration of 106 CFU/mL is transferred to the glass slide and treated by ozone gas directly. After ozone treatment, E. coli samples are washed out by 1-ml distilled water, and 300-μ l washed solution of E. coli is used to spread over agar media and incubated for 24 h under 27 ° C.
X-ray photoelectron spectroscopy (XPS) analysis is performed to evaluate and compare the surface chemical compositions of E. coli cells. With the treatment varied from 10 s to 3 min by the APPJ and the hydrogen peroxide solution or the ozone gas, the 300-μ l E. coli washed solution is deposited on a single-crystal bare chip and is dried in air. Each bare chip is 2.0-cm-wide, 2.0-cm-long, and 0.45-mm-thick. XPS measurements are performed immediately for the untreated and treated samples. The Physical Electronics PE5800 ESCA/Auger electron spectroscopy system is used for this study. Survey scans (0 eV– 1000 eV), acquired with an analyzer pass energy of 93.9 eV, are used to determine elemental compositions of samples. A photoelectron take-off angle of 45° is used for all spectra. High-resolution C 1s and O 1s spectra are deconvolved to analyze the C and O bonding environment at the surfaces of E. coli samples. In addition, after being inactivated by the APPJ, the samples containing E. coli are immediately observed by using SEM (Hitachi 4800), while the plasma-untreated samples are used as the control samples. The detailed process is similar to that reported in our previous work.[21]
Figure 2(a) shows the applied voltage and current waveforms of the APPJ obtained by using He as the discharge gas. The visually uniform needle-shaped plasma consists of current pulses with pulse widths of hundreds of nanoseconds, which indicates that atmospheric pressure barrier discharge is formed inside the quartz tube.[22, 23] The current directions (positive or negative) are different in the voltage-rising and voltage-falling half-cycles. When positive or negative voltage is applied to the high-voltage tungsten electrode, the charge distribution on the outside surface of the quartz fiber and the inner surface of the quartz tube are completely different. The charges accumulated on their surfaces form the inverse electrical field, which causes the quenching of the current pulses. The next pulse breakdowns occur only when the “ net” electric field in the quartz tube is strong enough to initiate the pulse discharge again. The “ net” electric field can induce breakdown discharges at the outlet of the quartz tube and result in the APPJ with its length of 5 cm.
Figure 2(b) shows the discharge power as a function of the applied voltage (peak to peak voltatge), and the inset gives a typical Lissajous figure with VP= 4.5 kV. As stated before, the Lissajous figure can be used to calculate the electric power, and the area of the closed curve is proportional to the discharge power. The discharge power linearly increases from 3.0 W to 39 W while VP is varied from 2.5 kV to 15 kV. An increase in the discharge power indicates that the electron and ion density in the atmospheric pressure plasma increase obviously. All the treatments of E. coli cells are performed by using the needle-shaped plasma at VP = 4.5 kV, corresponding to the discharge power of 18 W. The APPJ running at the relatively low discharge power indicates that the slight increase in temperature does not cause the obvious effect on the survival efficiency of bacteria cells.[10, 24]
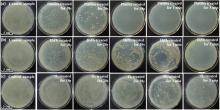
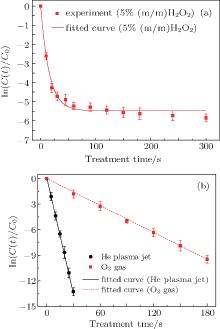
Figure 3 shows the photographs of E. coli samples after treatment, which spread on agar plates and are being incubated. The samples have been treated by using the APPJ (a), 5% hydrogen peroxide solution (b), and the ozone gas (c). Clearly, the inactivation efficiency of E. coli cells depends on both the treatment time and method used. Compared with different treatment measures, the APPJ is effective in killing the E. coli cells. According to these, the inactivation efficiency and fitting curves are obtained. Figure 4(a) shows the variation of ln(C(t)/C0) values with treatment time in 5% H2O2 solution, where C0 and C(t) are the concentration of E. coli cells alive at t = 0 and the concentration of E. coli cells alive at the treatment time (t), respectively. When the treatment time (t) increases from 0 to 60 s, the ln(C(t)/C0) value is rapidly reduced, then it turns to decrease slowly at t > 60 s. The rapid decrease in the ln(C(t)/C0) value shows that E. coli cells are efficiently inactivated in the hydrogen peroxide solution at this initial stage.
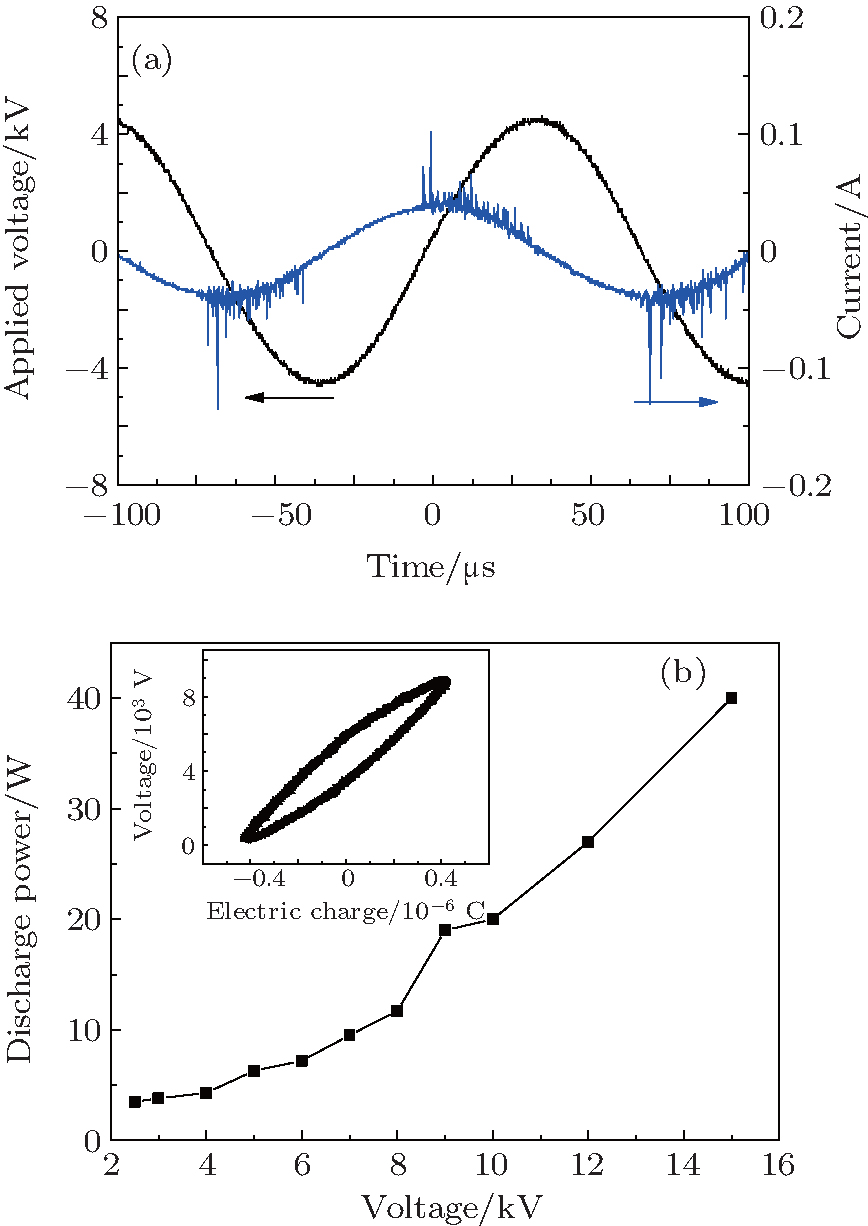 | Fig. 2. (a) Typical applied voltage and current waveforms obtained at VP = 4.5 kV, and (b) voltage-versus-charge (Lissajous figure) of the APPJ running at atmospheric pressure. The measurements are performed at an He rate of 2 SLM and a frequency of 7 kHz. |
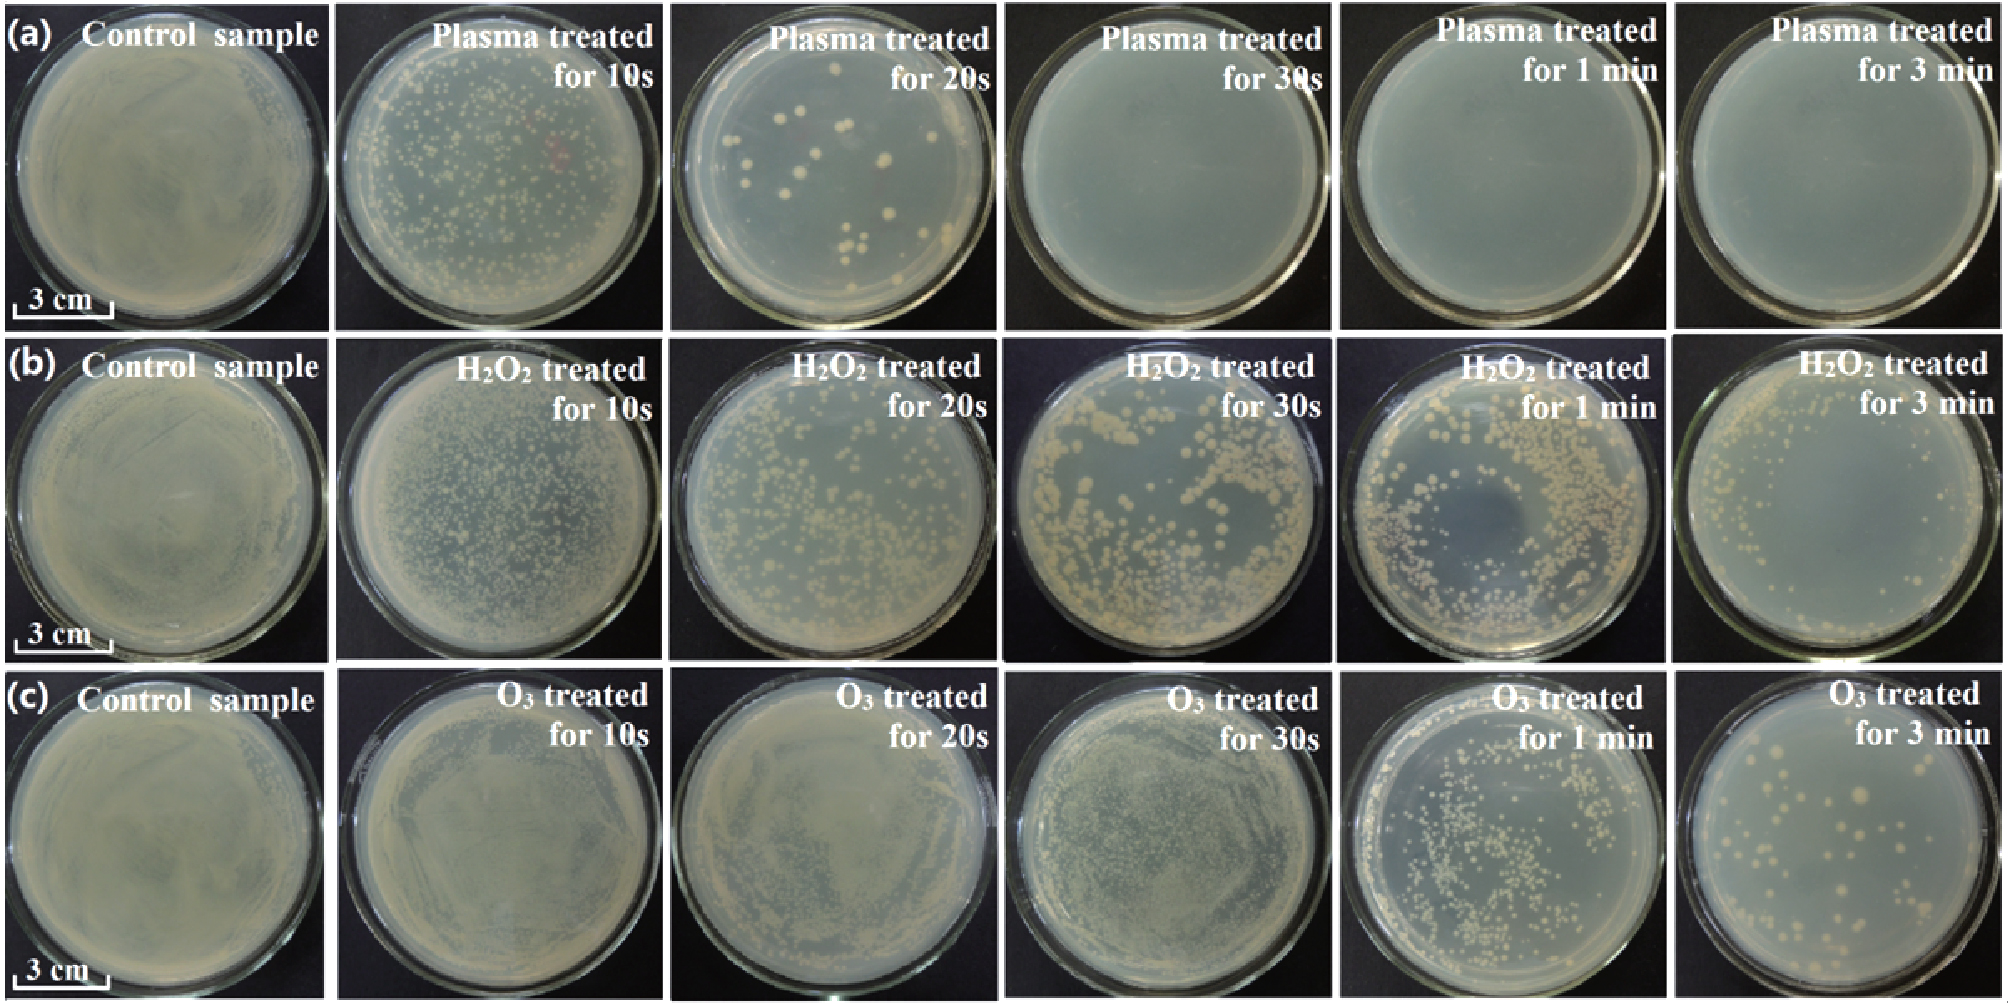 | Fig. 3. Photographs of E. coli samples after treatment, showing that the E. coli samples spread on agar plates and are being incubated. The samples have been treated by using (a) the APPJ, (b) 5% hydrogen peroxide solution, (c) O3 gas. The plasma treatments have been performed at VP = 4.5 kV within different treatment times. |
Since the ROS plays a crucial role in the inactivation process, the reaction processes of these oxidants can be briefly described below[25]

One E. coli cell is assumed to be killed after reacting with α ROS species. Thus, the oxidation reaction rate can be written as

where k0 is the rate constant of the oxidation reaction, α is the mean value for inactivating one E. coli cell, C(t) is the E. coli concentration at the treatment time (t), and CROS is the concentration of ROS species in vicinity of E. coli cells. The CROS is strongly dependent on the inactivation methods as follows:
(i) During the discharge generated at a given VP and gas flow rate, the density of ROS in the APPJ is assumed to be constant; Similarly, with a steady operation of an ozonator and a given gas flow rate, CROS can also be considered as a constant. Thus, one can obtain the following equation by solving Eq. (2):

where 
(ii) The H2O2 molecule acting as one oxidant in the solution can react with organisms, one can obtain values as a function of t:[26]

where CH2O2(t) is the concentration of H2O2 at the inactivation time (t), C0, H2O2 is the concentration of H2O2 without treatment and β is the constant. Combining Eqs. (2) and (4), one can obtain
where

and 
 | Fig. 4. (a) Comparison between the ln(C(t)/C0) values obtained in 5% H2O2 solutions within different treatment times and fitted ones theoretically by using Eq. (5), (b) comparison between ln(C(t)/C0) values obtained under He plasma treatments and fitted ones theoretically by using Eq. (3). |
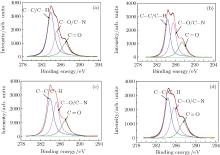
Figure 5 shows the typical angle-resolved XPS C 1s spectra for untreated (control) E. coli sample (a), and the E. coli samples treated by the APPJ for 30 s (b), treated by H2O2 solution for 30 s (c), and treated by ozone gas for 30 s (d). Analysis shows that the experimental curves can be fitted by using a series of peaks assigned to − C– C/– C– H (BE= 284.8 eV), − C– O/– C– N (BE= 286.2 eV), and − C= O (BE= 287.1 eV) groups on the basis of literature data.[27– 29] The XPS C 1s spectrum of the control E. coli sample is predominantly composed of − C– C/C– H groups, and contains a relatively small number of − C– O/– C– N, and − C= O groups. This XPS spectra clearly indicate that the E. coli cells can be considered as hydrocarbon compounds with unsaturated fatty acids. The relative intensities of – C– C/C– H groups in all the treated E. coli samples are obviously smaller than the ones observed in the control sample. In addition, the relative intensities of − C– O/– C– N and − C= O groups in the treated E. coli samples are greatly improved. The relative abundances of carbon components as determined by XPS analysis, for the control and treated E. coli samples by different methods are reported in Table 1. Clearly, O3 or H2O2 treatment for 30 s may result in a rapid decrease in each of the relative intensities of − C– C/– CH groups and an obvious increase in each of the relative intensities of − C– O/– C– N and − C= O groups. Plasma treatment for 30 s can further reduce the intensities of − C– C/– CH groups. The much lower − C– C/– CH content values for plasma-treated E. coli samples indicate that their surfaces are mainly composed of oxygen-containing groups.
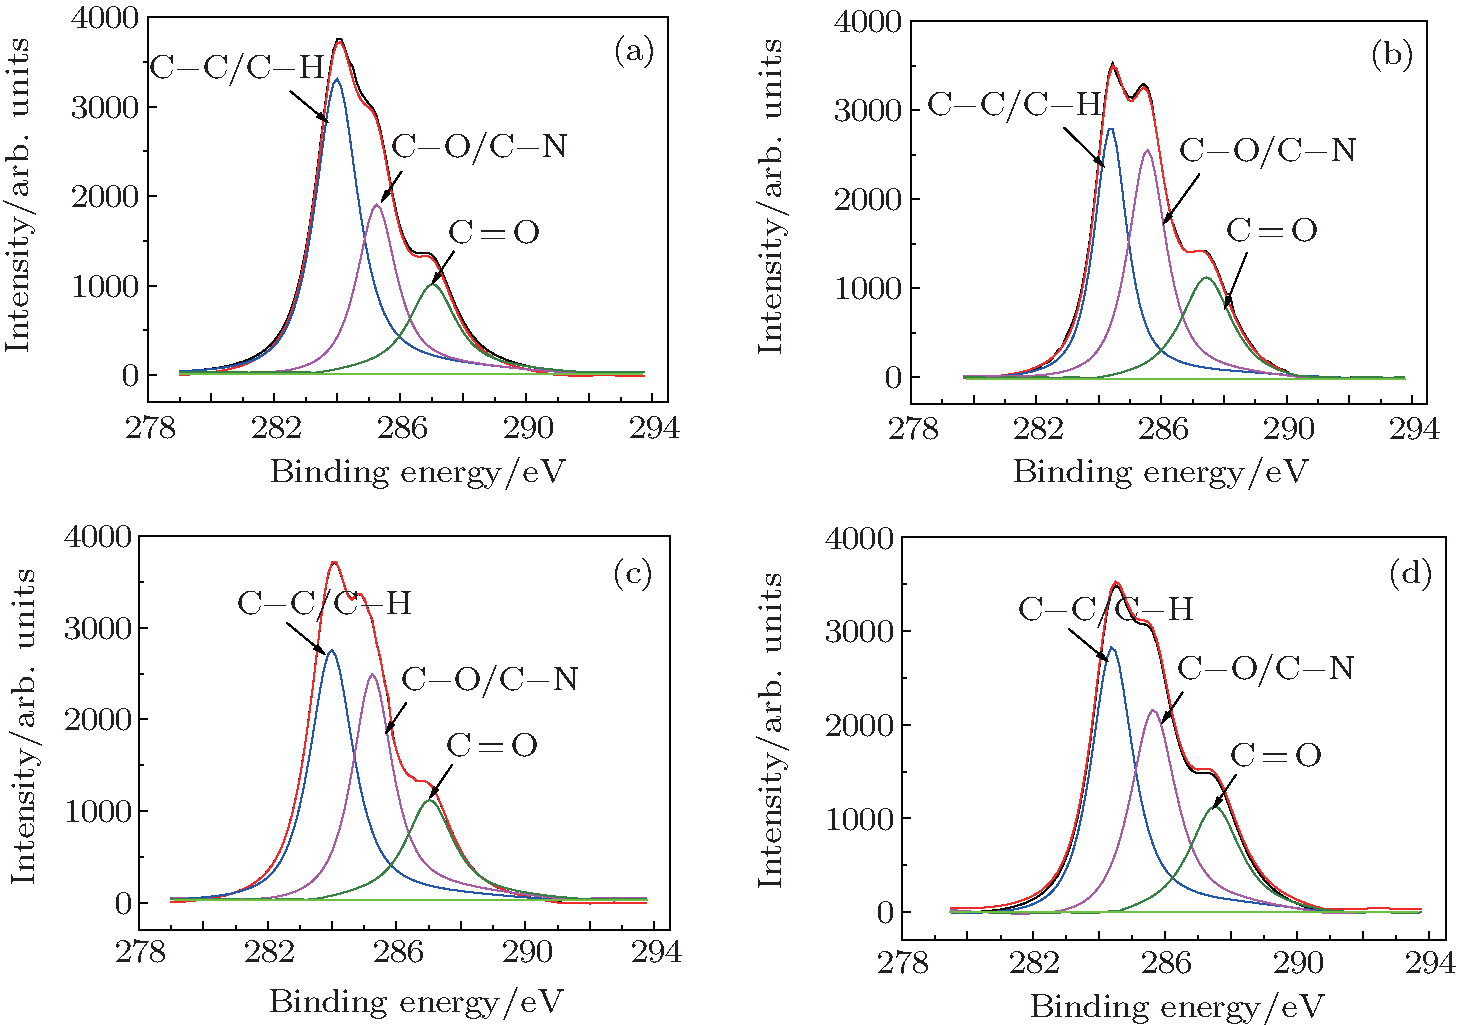 | Fig. 5. Typical angle-resolved XPS C 1s spectra for (a) untreated (control) E. coli sample, (b) the E. coli samples treated by the APPJ for 30 s, (c) treated by H2O2 solution for 30 s, and (d) treated by ozone gas for 30 s. |
| Table 1. XPS C 1s and elemental composition for untreated and treated E. coli samples by different methods. |
Table 1 also shows the elemental compositions of E. coli samples. These values are obtained from the ratios of the total integrated intensities of these elements. Carbon, oxygen, nitrogen, and sulphur are included in all samples. The – C– C and – C– H groups at the surfaces of treated E. coli samples can be oxidized into – C– O and – C= O groups by various reactive oxygen species, resulting in an absolute increase in the oxygen content of E. coli sample and a relative decrease in the carbon content, while nitrogen and sulphur content values do not significantly change with the treatment time. In fact, the absolute intensities of nitrogen and sulphur content of E. coli samples remain substantially unchanged, and the relative intensity of N or S content may change a little with measurement error in XPS analysis or the change of C and O content values. In addition, plasma treatment for 30 s can further increase the intensity of oxygen content. These results indicate that E. coli cell membranes containing unsaturated fatty acids and protein molecules can be easily destroyed due to the strong effects of relative oxygen species.
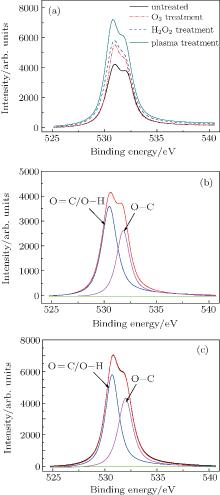
Figure 6 shows the typical angle-resolved XPS O 1s spectra for comparison for with untreated (control) and treated E. coli samples by plasma, H2O2 or O3 (a), untreated (control) E. coli sample (b), and the E. coli samples treated by the APPJ for 30 s (c). Analysis shows that the experimental curves can be fitted by using a series of peaks assigned to – O– C (BE= 532.5 eV) and – O= C/– O– H (BE= 531.2 eV) groups on the basis of the literature data.[28, 30] The number of oxygen-containing groups of E. coli samples is much higher in plasma treatment than in H2O2 or O3 treatment as shown in Fig. 6(a). Furthermore, figures 6(b) and 6(c) show plasma treatment for 30 s may cause the relative intensities of – O– C and – O= C/– O– H groups to increase obviously, which is matched with the experimental analyses in Fig. 5.
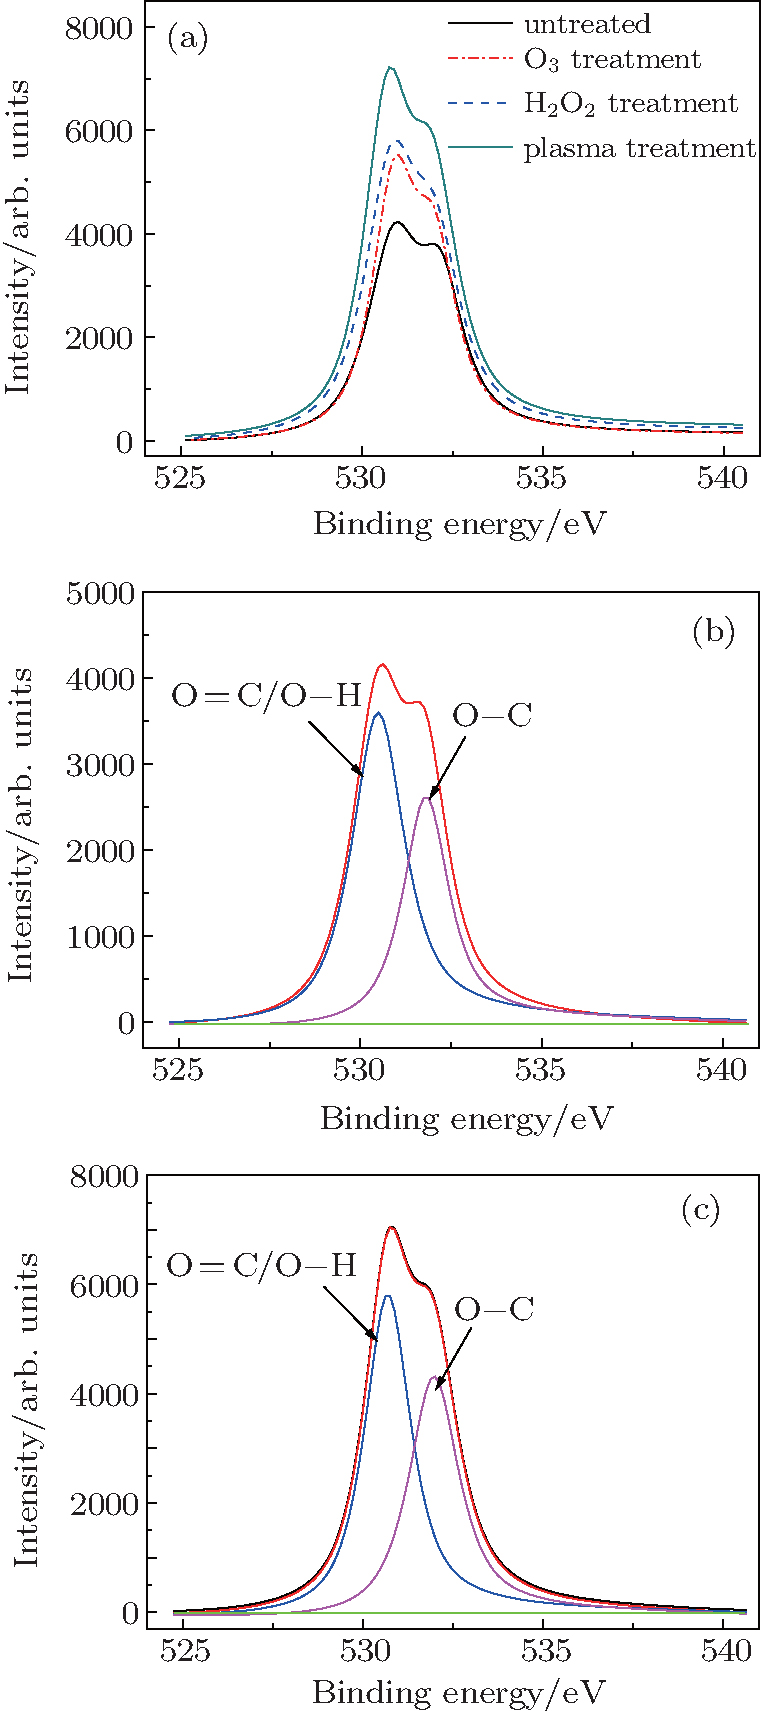 | Fig. 6. Typical angle-resolved XPS O 1s spectra for comparison with untreated and treated E. coli samples by plasma, H2O2 or O3 (a), untreated E. coli sample (b), and the E. coli samples treated by the APPJ for 30 s (c). |
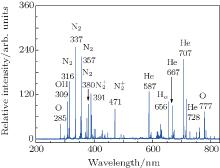
Figure 7 shows the typical OES spectrum of the APPJ generated at VP = 4.5 kV. The optical emissions from the N2 second positive system (C3Π → B3 Π ) at 316, 337, 357, 380, and 405 nm, [31, 32] and the first negative system of 


 | Fig. 7. Typical OES spectra of the APPJ generated at VP = 4.5 kV. |
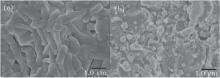
Figure 8 shows the SEM images of the control and treated E. coli cells. It is clearly seen that the plasma-untreated E. coli cells [Fig. 8(a)] are close to an ellipsoid in shape. After being exposed to the APPJ for 30 s at VP = 4.5 kV, the E. coli cells are completely destroyed, as shown in Fig. 8(b). Plasma treatment has broken up the cell membrane, made the loss of cytochylema and led to the cell inactivation. This resulted from the various plasma activated derivatives, such as OH, O, O3, which can play a key role in the cell inactivation processing.
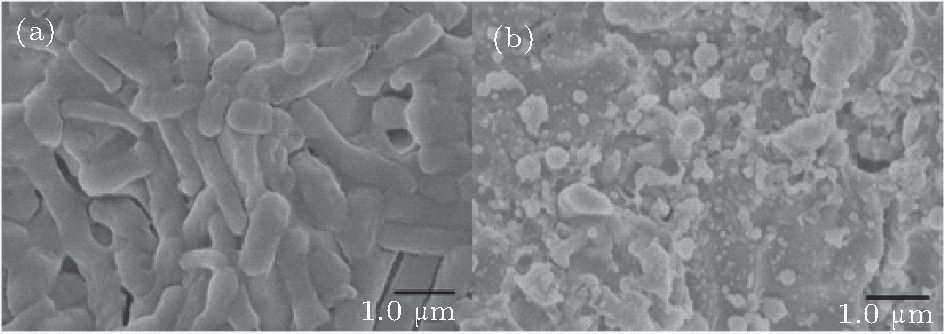 | Fig. 8. (a) The SEM images of E. coli (control), (b) plasma-treated E. coli. |
Chemical composition and structure of E. coli cell will be changed by plasma, H2O2 or O3 treatment. The plasma-generated reactive species, such as peroxide molecules, metastable particles, radicals, charged particles, and UV photons, are supposed to play a crucial role in efficiently killing the microorganisms. Hydrogen peroxide (H2O2) or the ozone (O3), acting as the ROS have been also considered to be very effective against various kinds of microorganisms.[12, 13] All these particles are natural carriers of energy, thus it is believed that they play a significant role in biomedical plasma inactivation. Cell membranes containing unsaturated fatty acids and protein molecules can be easily destroyed due to the strong effects of relative oxygen species.[9] The presence of these plasma-activated species can therefore compromise the function of the cell membrane whose role is to act as a barrier against the transport of ions and polar compounds in and out of the cells. All these treatments result in the oxidized surface of E. coli samples, corresponding to an increase in the O content, as shown in XPS spectra. However, the extremely low surface quantity of C– C/C– H groups for plasma-treated E. coli samples indicates that plasma-activated oxygen-containing species oxidize not only the unsaturated fatty acids, but also C– C and C– H groups at the surface of treated E. coli samples. These very active species, such as O radicals are able to break the C– C or C– H bonds, and cause the etching of organic compounds. From the physical point of view, the interactions for the inactivation of bacteria include the direct and indirect contact modes with biological objects.[2] For the direct contact mode, the short-living particles, such as charged species, radicals, and UV photons have a high chance of reaching the surfaces of treated objects and changing their chemical structures. In the indirect contact mode, the decompositions of reactive species can react with bacteria. In this study, the H2O2 or O3 may react with bacteria by the direct contact with organic compound or the decomposition of hydrogen peroxide or ozone in water into OH radicals reacting with organic compound.[38] However, the plasma inactivation efficacy in the direct exposure is much higher than that in the case of indirect contact mode.
The inactivation of E. coli cells is performed by using the APPJ, the hydrogen peroxide solution, and the ozone gas. The chemical reaction rate model is used to quantitatively describe the inactivation efficiencies of E. coli cells. By the contrast analysis, the APPJ is more effective in inactivating E. coli cells than H2O2 or O3 treatment. XPS analysis indicates that the oxygen-containing species generated in plasma, H2O2 solution or O3 gas can break the C– C or C– H bonds at the surface of E. coli cells, cause the chemical erosion to cell wall or membrane, and lead to the lethal effect to E. coli cells. Analysis shows that the reactive species play a crucial role in the inactivation process, and the inactivation rate of E. coli cells is strongly dependent on the reactive oxygen concentration, indicating that the APPJ is a novel effective method in the sterilization field, and therefore, it can become a potential alternative to conventional methods in the future.
| 1 |
|
| 2 |
|
| 3 |
|
| 4 |
|
| 5 |
|
| 6 |
|
| 7 |
|
| 8 |
|
| 9 |
|
| 10 |
|
| 11 |
|
| 12 |
|
| 13 |
|
| 14 |
|
| 15 |
|
| 16 |
|
| 17 |
|
| 18 |
|
| 19 |
|
| 20 |
|
| 21 |
|
| 22 |
|
| 23 |
|
| 24 |
|
| 25 |
|
| 26 |
|
| 27 |
|
| 28 |
|
| 29 |
|
| 30 |
|
| 31 |
|
| 32 |
|
| 33 |
|
| 34 |
|
| 35 |
|
| 36 |
|
| 37 |
|
| 38 |
|