


Effect of pulse width on near-infrared supercontinuum generation in nonlinear fiber amplifier
[Song Rui† , Lei Cheng-Min, Chen Sheng-Ping, Wang Ze-Feng, Hou Jing]
, Lei Cheng-Min, Chen Sheng-Ping, Wang Ze-Feng, Hou Jing]
|
|


†Corresponding author. E-mail: srnotice@163.com
*Project supported by the National Natural Science Foundation of China (Grant Nos. 11404404 and 11274385) and the Outstanding Youth Fund Project of Hunan Province and the Fund of Innovation of National University of Defense Technology, China (Grant No. B120701).
The effect of pulse width on near-infrared supercontinuum generation in nonlinear fiber amplifier is investigated theoretically and experimentally. The complex Ginzburg–Landau equation and adaptive split-step Fourier method are used to simulate the propagation of pulses with different pulse widths in the fiber amplifier, and the results show that a longer pulse is more profitable in near-infrared supercontinuum generation if the central wavelength of the input laser lies in the normal dispersion region of the gain fiber. A four-stage master oscillator power amplifier configuration is adopted and the output spectra under picosecond and nanosecond input pulses are compared with each other. The experimental results are in good accordance with the simulations which can provide some guidance for further optimization of the system.
Near-infrared supercontinuum (SC) has a wide range of applications, which is usually composed of a laser pump and a nonlinear medium. With regard to the nonlinear medium, photonic crystal fiber (PCF) has been widely used in visible and near-infrared SC generation, owing to its flexible dispersion control and high nonlinearity since its first fabrication in 1996.[1– 3] For the laser pump, the fiber laser is an ideal choice for SC generation in the sense of beam quality, heat treatment, and electric-to-optical conversion efficiency. Both continuous wave (CW) and pulsed fiber lasers have been used as the pump for SC generation in PCF, and lots of excellent results have been achieved.[4– 7] In recent years, SC generation directly from a nonlinear fiber amplifier has attracted lots of attention due to its low splicing loss, simple structure, and high optical-to-optical conversion efficiency, and many good results have been achieved in either low or high average output powers.[8– 13]
The advantage of the pulsed fiber laser pump compared with CW fiber laser is its wide SC that can be generated under low average power owing to its high peak power. As a result, most visible SCs and near-infrared SCs are pumped by pulsed fiber laser both in PCF and in nonlinear fiber amplifier. The pulse width has a significant effect on near-infrared SC generation because different pulse widths involve different nonlinear effects, and the pulse width can range from femtoseconds to nanoseconds.[14– 16] Andrean et al. have studied the influence of pump pulse duration ranging from 500 fs up to 10 ps on near-infrared SC generation in PCF under the same peak power.[17] In Ref. [17], an analytical model for soliton energy exchange was developed and the experiments showed that the width of the near-infrared SC pumped by 10-ps pulse was 200-nm wider than that pumped by 500-fs pulse, which was in good agreement with numerical simulation result. However, the effect of pulse duration on near-infrared SC generation in nonlinear fiber amplifier has been rarely reported. So it is very important to study it theoretically and experimentally.
The complex Ginzburg– Landau equation has been widely used in the numerical simulations for the propagation of pulses in a fiber amplifier, which is shown below[18]
where α is the loss of the gain fiber, A(z, t) is the slowly varying amplitude of the pulse envelope, A(z, ω ) is its Fourier transformation, γ is the nonlinear parameter at the carrier frequency, β k is the k-order dispersion coefficient, 

with g and Es being the small signal gain coefficient and saturation energy of the ytterbium-doped fiber respectively. One photon per mode noise model[20] is used in the simulation, and the adaptive split-step Fourier method is adopted to solve Eq. (1).[21] We set the shape and bandwidth of the gain spectrum to be Lorentzian distribution and 40 nm respectively with a central wavelength of 1064 nm. A Mach– Zehnder interferometer[22] is utilized to measure the dispersion parameters of the gain fiber used in this paper.
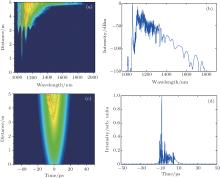
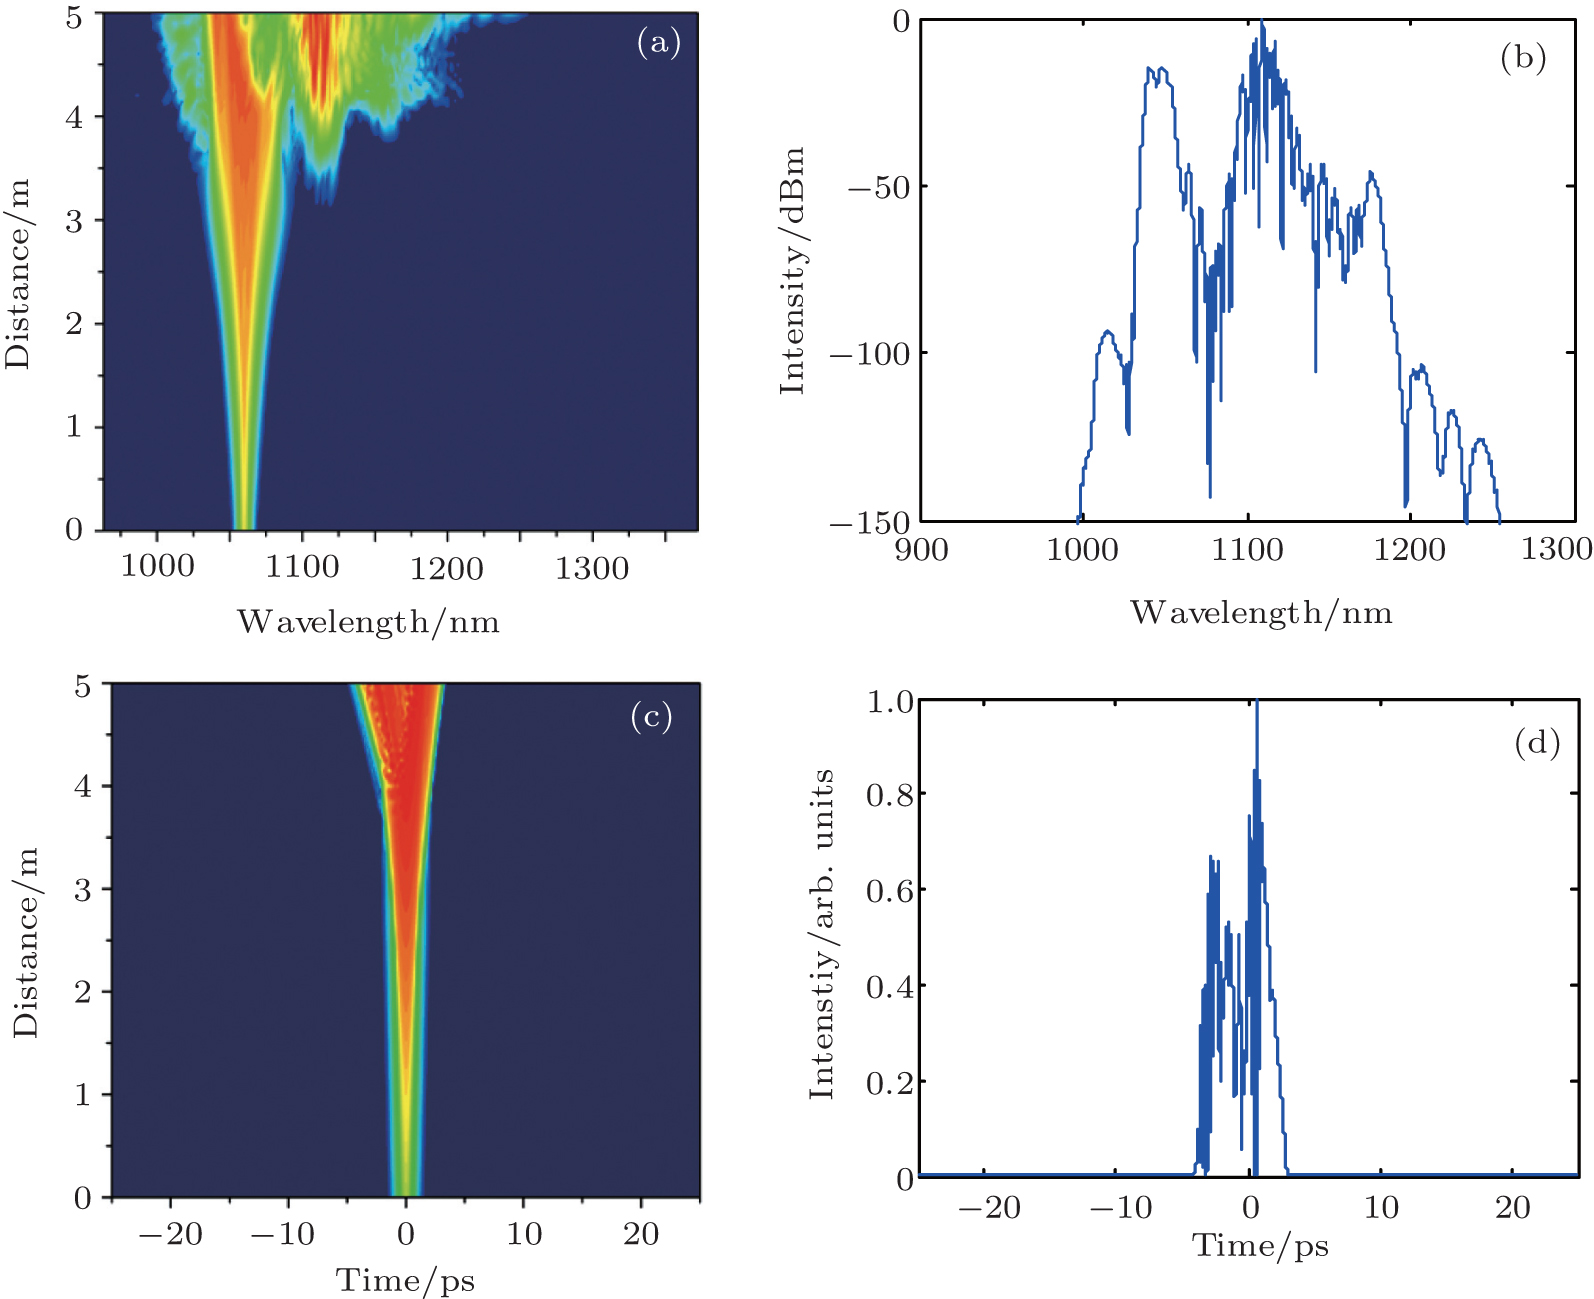
Figure 1 shows the simulation results under 10-ps input pump pulse. The peak power and shape of the input pump pulse are 10 kW and Gaussian distribution respectively. The gain fiber used in the simulation is 30 μ m/250μ m with a length of 5 m and the small signal gain coefficient g = 3.6/ m. It can be seen from Fig. 1(a) that the first-order and second-order Stokes occur when the pulse propagates at z = 2.2 m and z = 3 m respectively. The generated four-wave mixing (FWM) effect between the 1064-nm signal and the first-order Stokes light produces some weak spectra near 1000 nm when the pulse arrives at the position z = 2.8 m. Dramatic broadening phenomenon occurs at z = 4.7 m, and around 400 nm, new frequencies in the long wavelength direction are generated. Figure 1(b) shows the final output spectrum which covers a range from 1000 nm to 1800 nm. However, the spectral flatness is not good because soliton-related nonlinear effects like soliton fission and soliton self-frequency shift (SSFS) are not strong enough, which result from the weak spectral intensity above the zero-dispersion wavelength (ZDW) of the gain fiber (around 1.3 μ m). The time-domain propagation of the pulse in the fiber amplifier and the final output pulse shape are described in Figs. 1(c) and 1(d) respectively. The combined effects of dispersion and nonlinearity keep the width of the pulse increasing on the whole. Multi-peaks occurring at z = 2 m and a series of femtosecond ultra-short pulses are formed by modulation instability at z = 4 m. The femtosecond ultra-short pulses are kept within the envelope of the picosecond pulse, most of which lie in front part of the envelope. The reason is that the pulse propagates in the normal dispersion region of the gain fiber, which means the longer wavelength has a faster propagation speed and it lies in the front part (left part) of the pulse in the time domain, and almost all the new frequencies generated are in the long wavelength direction so the most femtosecond ultra-short pulses lie in front part of the envelop.
 | Fig. 1. Simulation results under 10-ps input pump pulse, showing (a) frequency-domain propagation of the pulse in the fiber amplifier, (b) final output of the spectrum, (c) time-domain propagation of the pulse in the fiber amplifier, and (d) final output of the pulse. |
Figure 2 shows the simulation results under 500-fs pump pulse while other parameters keep unchanged. It can be seen from Fig. 2(a) that the first-order and second-order Stokes occur when the pulse propagates at z = 3.3 m and z = 3.8 m respectively. However, the generated FWM and dramatic broadening phenomenon disappear compared with the scenario in Fig. 1(a). This is because the narrow input pulse width results in a bigger broadening factor for the pulse width under the same small signal gain, which slows down the increase of the peak power and undermines the nonlinear effects. The 500-fs pump pulse needs to propagates further in the fiber amplifier to generate wider near-infrared SC. As a result, the long-wavelength edge of the final output spectrum in Fig. 2(b) extends only to around 1250 nm, which is about 550-nm shorter than that in Fig. 1(b) and does not exceed the ZDW of the gain fiber. Figures 2(c) and 2(d) show the time-domain propagation of the pulse in the fiber amplifier and the final output pulse shape, respectively. Multi-peaks occur when the pulse propagates at z = 4 m which is about 2-m later than that in Fig. 1(c). The distribution of the femtosecond ultra-short pulses is relatively uniform compared with that in Fig. 1(d) because multi-peak structure happens near the end of the gain fiber.
 | Fig. 2. Simulation results under 500-fs pump pulse showing (a) frequency-domain propagation of the pulse in the fiber amplifier, (b) final output of the spectrum, (c) time-domain propagation of the pulse in the fiber amplifier, and (d) final output of the pulse. |
In a word, longer pulses generate wider near-infrared SC under the same small signal gain in the fiber amplifier. This is because, for one thing, longer pulses have smaller broadening factor for the pulse width, which accelerates the increase of the peak power. For another thing, the soliton collisions and energy exchange under long pump pulse are more effective and fierce which can generate more new frequencies in the long wavelength direction. The simulation results are in accordance with the theoretical results in Ref. [17].
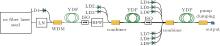
Some relevant experiments are carried out in order to verify the above simulation results, and the experimental setup is shown in Fig. 3, which consists of a four-stage master oscillator power amplifier (MOPA) configuration. The nanosecond fiber laser seed and the setup of the line width narrowing system have been reported in Refs. [23] and [24] respectively. The repetition rate and the pump power of the nanosecond pulse are 563 kHz and 310 mW respectively. The second stage is a single mode ytterbium-doped fiber amplifier (YDFA) with a 480-mW fiber pigtailed 976-nm laser diode pump, and both the third stage and the fourth stage are double clad YDFAs which have been described in detail in Ref. [13], and the 976-nm pump for the third and fourth stage are 18 W and 300 W respectively. An angle-polished fiber end cap is spliced to the output fiber to reduce back reflection and prevent end facet from being damaged. A multimode fiber (50 μ m/125 μ m) couples some output light into an oscilloscope (Tektronix, TDS7154) with 20-GHz sampling rate and a high speed photo detector (Thorlabs DET01CFC) to analyze the time-domain output of the system. Two optical spectrum analyzers (600 nm∼ 1700 nm, Agilent 86142B-E02; 1700 nm∼ 2000 nm, Princeton SP2300) are used to analyze the frequency-domain output of the system.
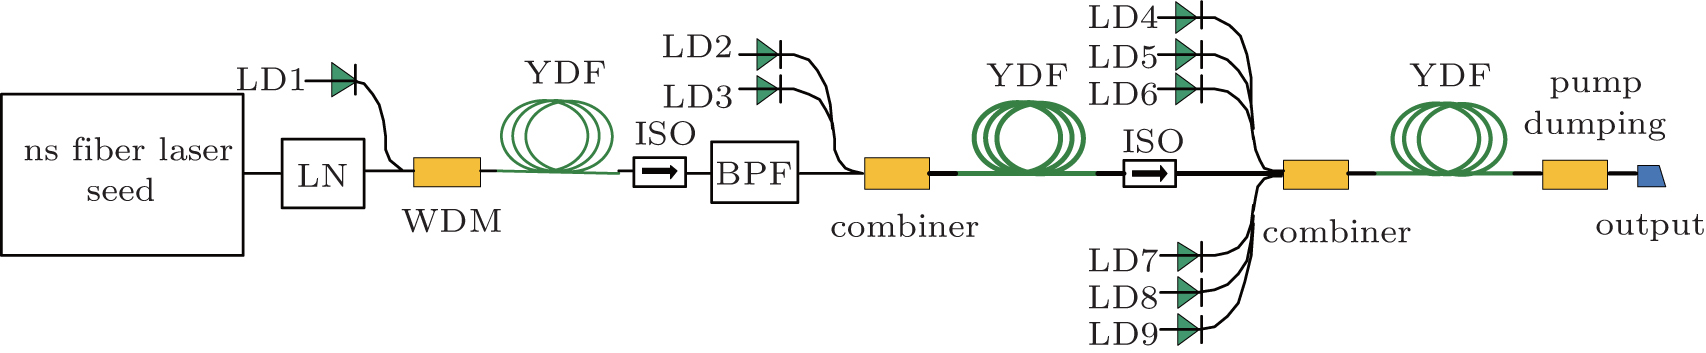 | Fig. 3. High power SC generation from fiber amplifier in MOPA configuration, LN: line width narrowing system, YDF: ytterbium-doped fiber, ISO: isolator, BPF: bandpass filter, and LD: laser diode. |
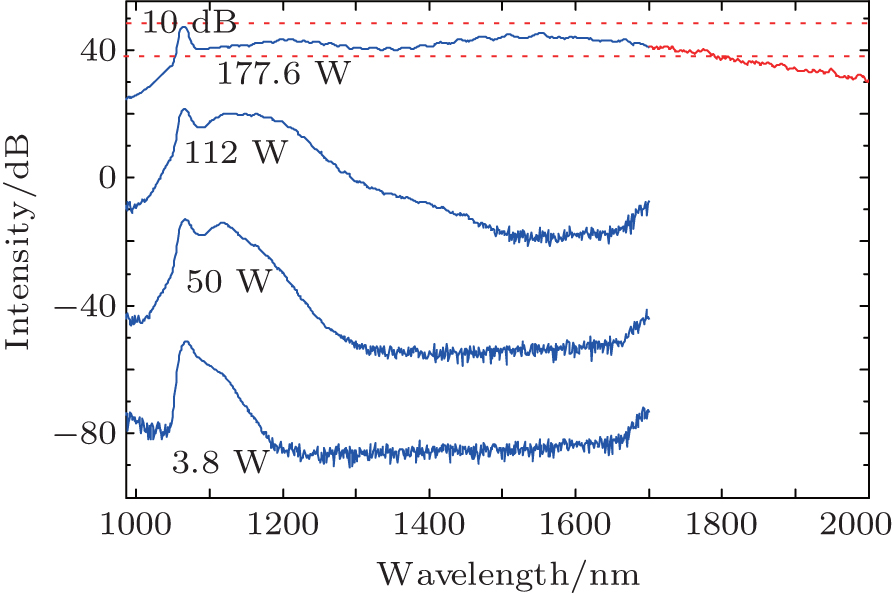
Figure 4 shows the output spectra at different output powers under nanosecond input pulse with pulse width T0 = 3 ns. The spectrum broadening process and nonlinear effects involved have been analyzed in detail in Ref. [13], which will not be discussed here any more.
In order to distinguish the role of the pulse width played in SC generation, the nanosecond fiber laser seed and linewidth narrowing system in Fig. 3 are replaced by a picosecond fiber laser seed and repetition increasing system, respectively, as shown in Fig. 5. The details of the picosecond fiber laser seed and the self-made repetition increasing system have been described in Ref. [25], and the setup of the three-stages fiber amplifiers keeps unchanged.
 | Fig. 4. Output spectra at different output powers under nanosecond input pulse. |
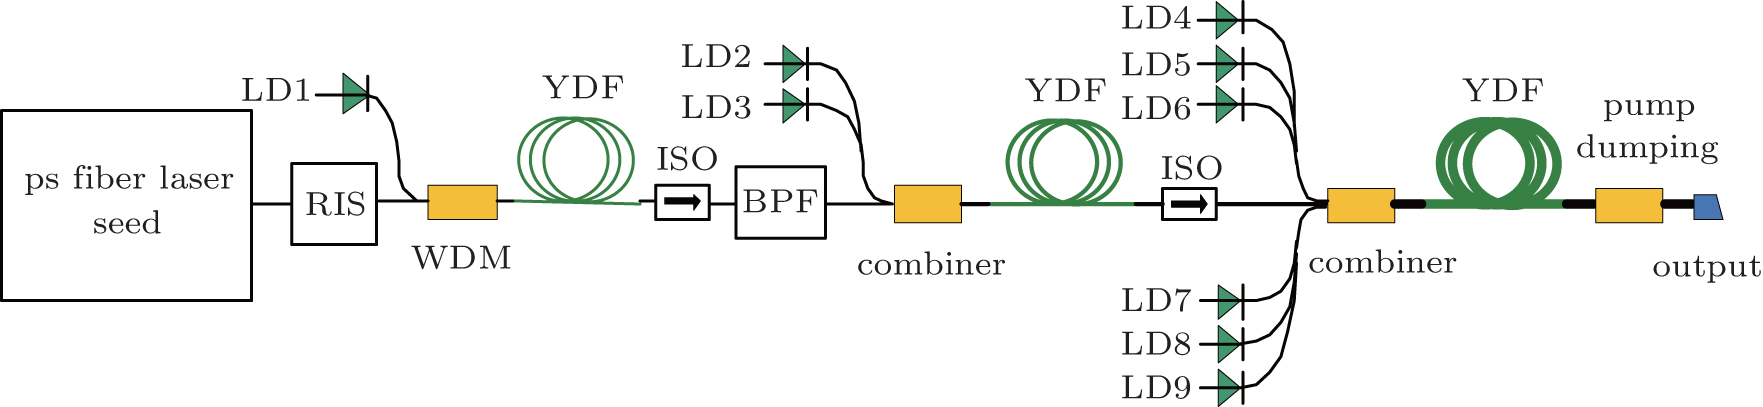 | Fig. 5. High power SC generation from fiber amplifier under picosecond input pulse. RIS: repetition increasing system. |
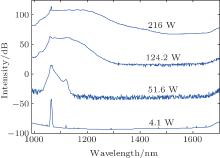
Figure 6 shows the output spectra at different output powers under picosecond input pulse. The repetition rate and the pulse width of the input picosecond pulse are 120 MHz and 18 ps respectively. These four output spectra are under the same pump power as that in Fig. 5. However, the average output powers are much higher, and the flatness of each of the spectra is less good. When the 976-nm pump power in the last stage fiber amplifier is turned off, the average output power of the pump laser is 4.1 W and some very weak optical components near 1118 nm are generated. With the increase of the 976-nm pump power, the first-order Stokes becomes more and more obvious and the shape of the output spectrum becomes unsymmetrical, owing to the stimulated Raman scattering (SRS) effect, as shown when the average output power is 51.6 W. Further increasing the 976-nm pump power until the average output power reaches 124.2 W, cascaded SRS effect keeps the spectrum broadening in the long wavelength direction. When the pump power reaches its maximum, the average output power is 216W which is much bigger than that in Fig. 4. However, from the output spectrum we can see that the width of the SC is much narrower and much of 976-nm pump power is changed into 1064-nm laser, resulting in a higher average output power. The intensity of the spectrum in the abnormal dispersion region of the gain fiber is weak and the wavelength edge in the long wavelength direction is around 1450 nm, which means a longer pump pulse is more profitable in near-infrared SC generation.
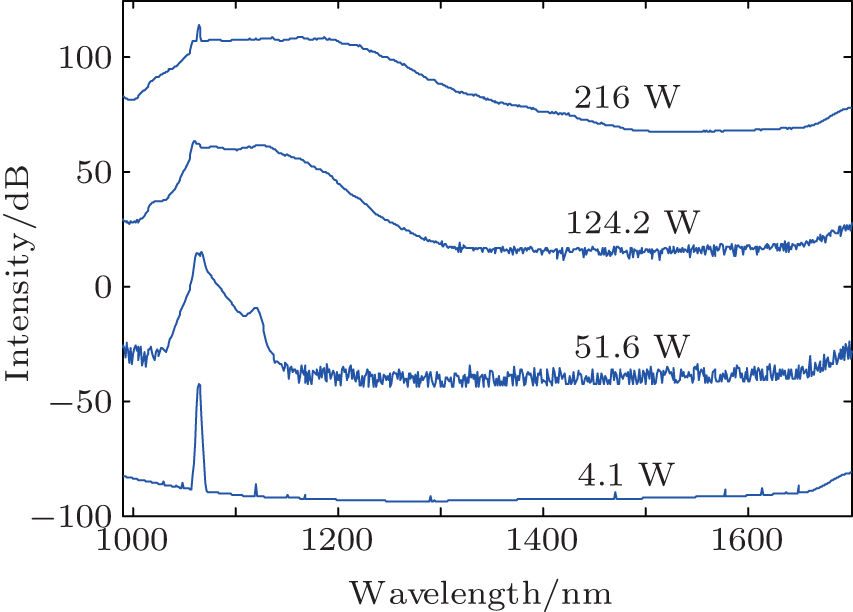 | Fig. 6. Output spectrums at different output powers under picosecond input pump pulse. |
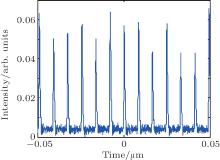
Figure 7 shows the time-domain final output of the picosecond pulse train. The fluctuation of the pulse amplitude results from two aspects: (i) The repetition increasing system creates some fluctuations owing to the variance of the fiber components, which are amplified in the fiber amplifier. (ii) The nonlinear effects also aggravate the fluctuation.
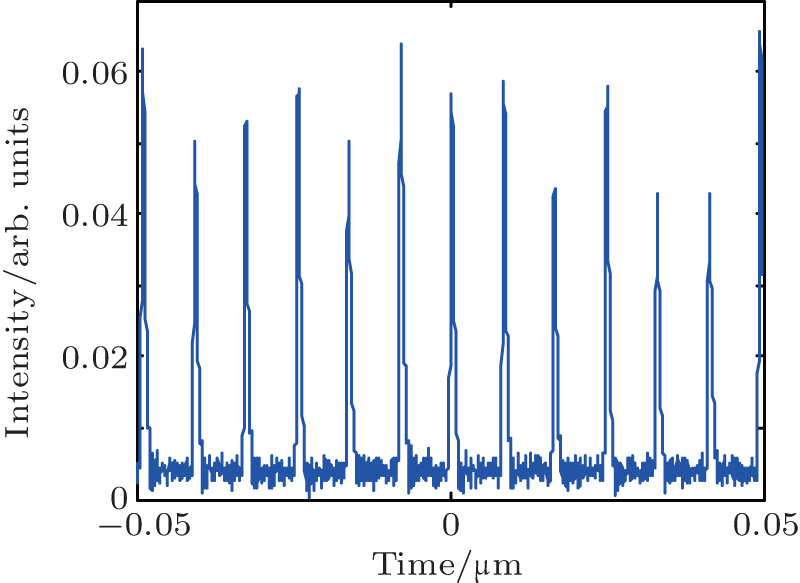 | Fig. 7. Time-domain output at maximum output power. |
The effects of pulse width on near-infrared SC generation in a nonlinear fiber amplifier are studied both theoretically and experimentally. The complex Ginzburg– Landau equation is used to simulate the propagation of the pulse in the fiber amplifier, and the results show that a longer pulse width is more profitable in near-infrared SC generation. A four-stage MOPA configuration is adopted to produce high power near-infrared SC, and the experimental results between nanosecond input pulse and picosecond input pump pulse are compared with each other, which are in good agreement with simulations.
| 1 |
|
| 2 |
|
| 3 |
|
| 4 |
|
| 5 |
|
| 6 |
|
| 7 |
|
| 8 |
|
| 9 |
|
| 10 |
|
| 11 |
|
| 12 |
|
| 13 |
|
| 14 |
|
| 15 |
|
| 16 |
|
| 17 |
|
| 18 |
|
| 19 |
|
| 20 |
|
| 21 |
|
| 22 |
|
| 23 |
|
| 24 |
|
| 25 |
|