Zhang Shu, Li Wen-Jun, Ling Shi-Gang, Li Hong†, Zhou Zhi-Bin, Chen Li-Quan. Instability of lithium bis(fluorosulfonyl)imide (LiFSI)–potassium bis(fluorosulfonyl)imide (KFSI) system with LiCoO2 at high voltage . Chinese Physics B, 24(7): 078201
Permissions
Instability of lithium bis(fluorosulfonyl)imide (LiFSI)–potassium bis(fluorosulfonyl)imide (KFSI) system with LiCoO2 at high voltage
Zhang Shua), Li Wen-Juna), Ling Shi-Ganga), Li Hong†a), Zhou Zhi-Binb), Chen Li-Quana)
Beijing National Laboratory for Condensed Matter Physics, Institute of Physics, Chinese Academy of Sciences, Beijing 100190, China
Key Laboratory for Large-Format Battery Materials and System (Ministry of Education), School of Chemistry and Chemical Engineering, Huazhong University of Science and Technology, Wuhan 430074, China
*Project supported by the Beijing S&T Project, China (Grant No. Z13111000340000), the National Basic Research Program of China (Grant No. 2012CB932900), and the National Natural Science Foundation of China (Grants Nos. 51325206 and 51421002).
Abstract
The cycling performance, impedance variation, and cathode surface evolution of the Li/LiCoO2 cell using LiFSI–KFSI molten salt electrolyte are reported. It is found that this battery shows poor cycling performance, with capacity retention of only about 67% after 20 cycles. It is essential to understand the origin of the instability. It is noticed that the polarization voltage and the impedance of the cell both increase slowly upon cycling. The structure and the properties of the pristine and the cycled LiCoO2 cathodes are investigated by x-ray diffraction (XRD), scanning electron microscopy (SEM), Raman spectroscopy, x-ray photoelectron spectroscopy (XPS), and transmission electron microscopy (TEM). It is found that the LiCoO2 particles are corroded by this molten salt electrolyte, and the decomposition by-product covers the surface of the LiCoO2 cathode after 20 cycles. Therefore, the surface side reaction explains the instability of the molten salt electrolyte with LiCoO2.
PACS:
82.47.Aa; 65.40.gk; 82.45.Fk
Keyword:
lithium ion battery; molten salt electrolyte; lithium bis(fluorosulfonyl)imide; potassium bis(fluorosulfonyl)imide
Rechargeable lithium batteries have been widely used in portable electronic devices, electric vehicles (EVs), hybrid electric vehicles (HEVs), and storage of surplus electricity. They are favored for their high voltage, high specific energy density, and long cycling life. However, the current rechargeable lithium batteries have safety issues caused by the organic liquid electrolyte. In order to solve the safety issues, recently, molten salt is selected as one of the potential electrolytes for rechargeable lithium batteries due to its nonflammability, nonvolatility, high chemical and electrochemical stability, and especially stability at moderate temperature.[1– 13] Three advantages of molten salt electrolyte over traditional organic liquid electrolyte are the nonflammability, nonvolatility, and high operating temperature above 55 ° C.[14]
The molten salt alkali bis(trifluoromethanesulfonyl)imide MTFSI (M = Li, Na, K, Cs) system was first investigated by Hagiwara et al. in 2008.[1, 2] Most of the systems have an eutectic point that shows a lower melting point compared to the single composition. The molten salt system of MTFSI (χ LiTFSI : χ KTFSI : χ CsTFSI = 0.2 : 0.1 : 0.7 by mole) shows high ionic conductivity (14.2 mS · cm − 1 at 150 ° C) and moderate viscosity (87.2 cP at 150 ° C). A Li/LiFePO4 cell with this molten salt mixture electrolyte has been demonstrated to have a good cycling performance when operated at 150 ° C and to retain 95% of the initial discharge capacity after 50 cycles.[4] The properties of some other molten salt systems, including bis(fluorosulfonyl)imide (FSI− ), [3, 6, 9, 12, 13] bis(pentafluoroethanesulfonyl)imide (BETI− ), [5] and fluorosulfonyl (trifluoromethylsulfonyl) imid (FTFSI− )[10, 11] have also been investigated.
For the MFSI (M = Li, Na, K) system, Kubota et al. investigated the phase diagram and electrochemical window of the binary system of LiFSI and KFSI. The mixture of LiFSI and KFSI (χ LiTFSI : χ KTFSI = 0.45 : 0.55) has a eutectic temperature of about 65 ° C, and shows a wide electrochemical window of about 6.0 V at the eutectic point of 75 ° C when Ni and glassy carbon are used as the working electrodes.[3] Li et al. studied the electrochemical behaviors of MCMB and Li4Ti5O12 anodes, and LiCoO2 and LiFePO4 cathodes in the molten salt electrolyte of LiFSI– KFSI (χ LiFSI : χ KFSI = 0.4 : 0.6) systematically.[12] In Li’ s results, LiFePO4 was proven to have excellent compatibility with the molten salt electrolyte while MCMB and Li4Ti5O12 were not. No detailed information on LiCoO2 about the compatibility with the molten salt electrolyte was shown except for a cyclic voltammetry curve using a three-electrode cell. Zhou et al. investigated the cycling performance of Li/natural graphite, Li/LiFePO4, and natural graphite/LiFePO4 cells using LiFSI– KFSI (χ LiFSI : χ KFSI = 0.41 : 0.59) as the electrolyte at 80 ° C.[13] Both the Li/natural graphite and Li/LiFePO4 cells showed good cycling performance. The coulombic efficiency of Li/LiFePO4 was 92.3%, and the specific capacity was 146.4 mAh· g− 1 for the first cycle. Both the capacity and the coulombic efficiency increased slightly during charging and discharging and finally a capacity of 150 mAh· g− 1 and 100% coulombic efficiency were achieved after 100 cycles, which indicates good compatibility with the molten salt electrolyte for the Li/LiFePO4 cells.
As described above, the LiFSI– KFSI molten salt seems to have a wide electrochemical window[3, 12] and shows good performance in a Li/LiFePO4 cell.[12, 13] Thus far, however, little attention has been paid to the cycling performance of the LiCoO2 or other materials with higher operating voltage using LiFSI– KFSI molten salt electrolyte. This is obviously an essential topic. In this paper, the cycling performance, impedance variation, and cathode surface evolution of the Li/LiCoO2 cell using LiFSI– KFSI molten salt electrolyte are reported.
2. Experiment
High purity LiFSI (purity > 99.95) and KFSI (purity > 99.99%) (H2O < 50 ppm, Suzhou Fluolyte Co., China) were used as received. The LiFSI and KFSI were mixed with the mole ratio 41:59 in a mortar in an argon-filled glove box. Its eutectic point is 69 ° C.[13] The mixture of LiFSI– KFSI (χ LiFSI : χ KFSI = 0.41 : 0.59) was used as the electrolyte for battery testing. The cathode was a commercial product with a composition of LiCoO2 or LiFePO4, acetylene black, and PVDF (KynarFlex 2801, Atochem) at the weight ratio of 93:4:3 (Amperex Technology Limited). An aluminum foil was used as the current collector. The area of the cathode was 8 mm × 8 mm. The organic liquid electrolyte of 1-M LiPF6 in ethylene carbonate (EC) and dimethyl carbonate (DMC) (1:1) was also used for comparison.
The cyclic voltammetry (CV) was tested on a CHI627D electrochemical analyzer using a CR2032 cell. In the Li/LiCoO2 cell, the eutectic mixture of LiFSI and KFSI was used as the electrolyte, and metallic lithium was used as the anode. The cutting-off voltage range was 3– 4.2 V. The testing temperature was 80 ° C and the scanning rate was 0.1 mV/s.
Four different cells were assembled and labeled as (i) Li/1 M LiPF6– EC:DMC (1:1)/LiCoO2, (ii) Li/LiFSI– KFSI/LiCoO2, (iii) Li/1 M LiPF6– EC:DMC (1:1)/LiFePO4, and (iv) Li/LiFSI– KFSI/LiFePO4. All the cells were charged and discharged at the constant current mode with a charge-discharge rate of 0.2/0.2 C by using an automatic Land battery testing system. Cells (i) and (iii) were tested at ambient temperature, while cells (ii) and (iv) were tested at 80 ° C. The charge-discharge voltage range was 3– 4.2 V for cells (i) and (ii) and 2.8– 4.2 V for cells (iii) and (iv). Cells (ii) and (iv) were kept at 80 ° C for 24 h using a thermostatically controlled oven before the electrochemical tests.
The impedance spectra of the Li/LiFSI– KFSI/LiCoO2 cell were recorded on the Zahner IM6 electrochemical analyzer with an ac oscillation voltage of 5 mV over the frequencies from 10 mHz to 8 MHz at 80 ° C. The impedance spectra were measured at the fully charged state.
The Li/LiFSI– KFSI/LiCoO2 cells were disassembled in the argon filled glove box after 20 charge-discharge cycles at a charge/discharge rate of 0.2/0.2 C at 80 ° C. The cathode was taken out of the cell and washed with anhydrous dimethyl carbonate (DMC). The washed electrode was dried in the vacuum chamber of the glove box for 10 h before the x-ray diffraction (XRD), scanning electron microscopy (SEM), energy dispersive spectroscopy (EDS), Raman, x-ray photoelectron spectroscopy (XPS), and transmission electron microscopy (TEM) measurements.
The crystal structure of the LiCoO2 cathode was measured using a Bruker D8 Advance diffractometer with Cu Kα radiation at a scanning rate of 0.5 ° /min in the 2θ range of 10° – 80° . The surface and cross-section morphologies and EDS mapping of the LiCoO2 cathode were imaged on the SEM microscope (HITACHI S4800). The particles of LiCoO2 and LiFePO4 were investigated by an FEG-TEM microscope (TecnaiF20) operated at 200 kV. Raman spectra were acquired on the HR800 spectrometer with a 532 nm excitation wave. XPS data were obtained using an ESCALab250 electron spectrometer with monochromatic Mg Kα radiation, and specific correction was conducted by using C 1s binding energy of 284.6 eV.
3. Results and discussion
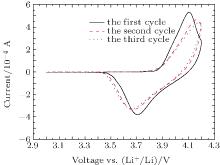
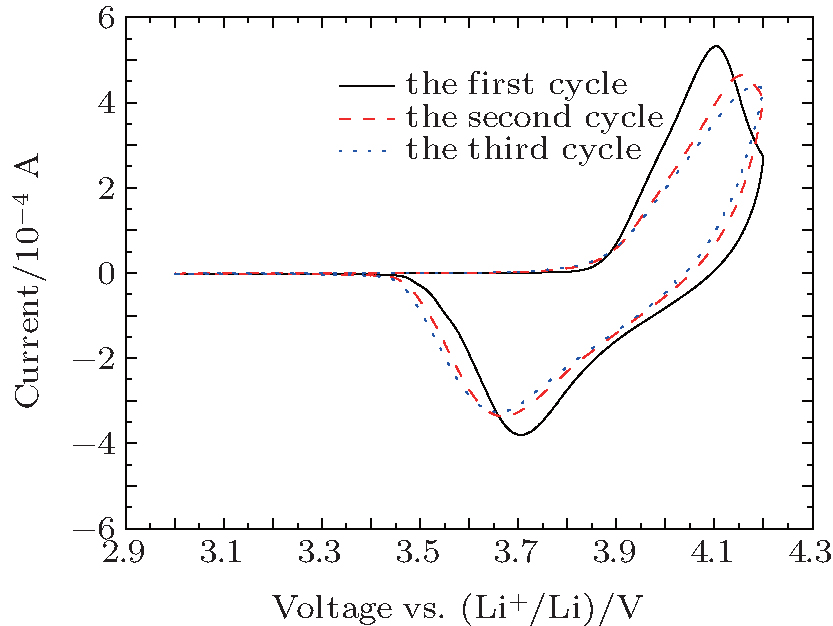
The cyclic voltammetry curve of the Li/LiFSI– KFSI/LiCoO2 cell is shown in Fig. 1. A pair of oxidation and reduction current peaks corresponding to the deintercalation and intercalation of Li + by the LiCoO2 cathode is observed. This is in accordance with Li’ s report.[12] The polarization voltage between the reduction peak and the oxidation peak is about 0.4 V, and the polarization increases gradually with the cycle number.
Fig. 1. Cyclic voltammetry curve of LiFSI– KFSI (χ LiFSI: χ KFSI = 0.41: 0.59) molten salt on LiCoO2 at a scan rate of 0.1 mV· s− 1 at 80 ° C. The area of the cathode is 8 mm× 8 mm.
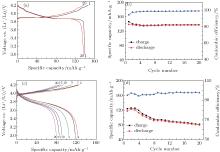
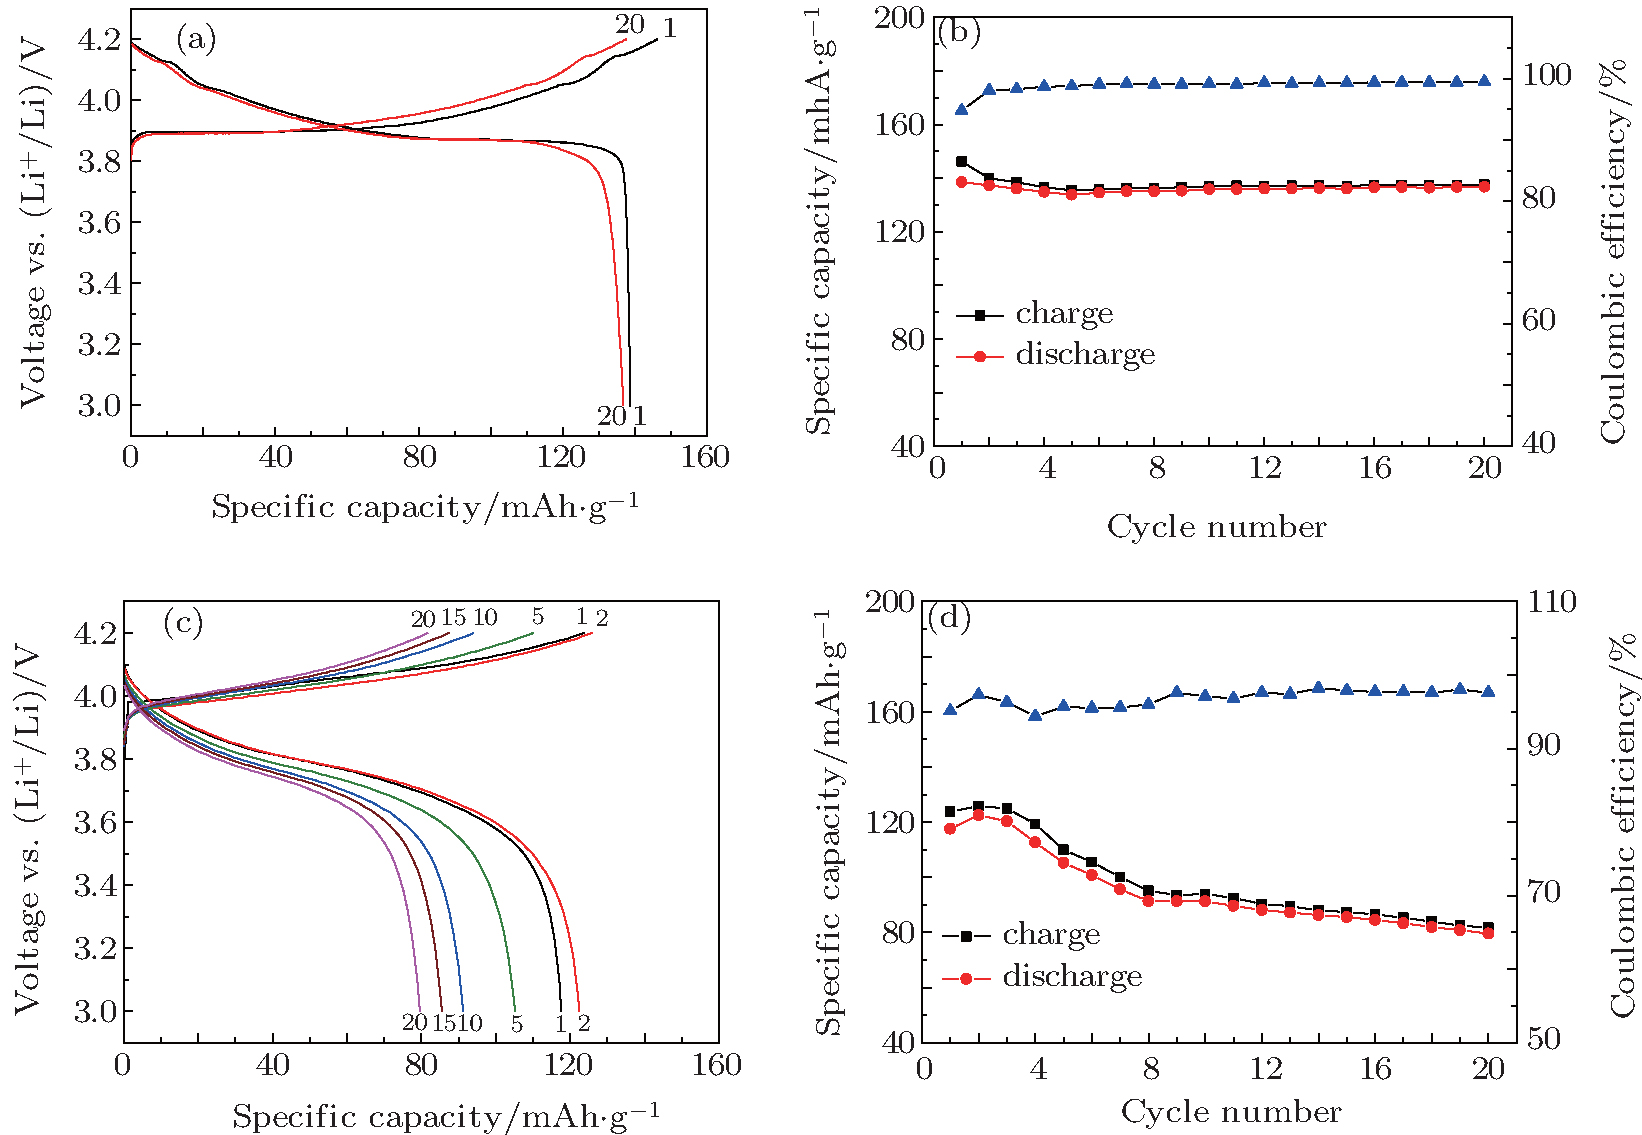
Figures 2(a) and 2(b) show the charge/discharge curves and the specific capacity and Coulombic efficiency vs. cycle number for the Li/LiPF6-EC: DMC (1:1)/LiCoO2 cell at a charge/discharge rate of 0.2/0.2 C at room temperature. The charge/discharge capacities for the cell in the first and the twentieth cycles are 146.2/138.6 mAh· g− 1 and 137.6/136.8 mAh· g− 1, respectively, and the corresponding Coulombic efficiencies are 94.8% and 99.5%. It is observed that LiCoO2 shows a good cycling performance in the traditional organic liquid electrolyte. Figure 2(c) shows the representative charge/discharge curves of the Li/LiFSI– KFSI/LiCoO2 cell at the 1st, 2nd, 5th, 10th, 15th, and 20th cycles at a charge/discharge rate of 0.2/0.2 C at 80 ° C. The charge/discharge capacities for the cell in the first and the twentieth cycles are 123.7/117.6 mAh· g− 1 and 81.6/79.6 mAh· g− 1, respectively, and the corresponding coulombic efficiencies are 95.1% and 97.6%. Figure 2(d) displays the specific capacity and coulombic efficiency of the Li/LiCoO2 cell using the LiFSI– KFSI molten salt electrolyte vs. cycle number. The charge-discharge capacity of the Li/LiFSI– KFSI/LiCoO2 cell decreases and the polarization increases gradually along with the cycle number, and the coulombic efficiency is low in the first 20 cycles.
Fig. 2. (a) Charge/discharge curves and (b) specific capacity and Coulombic efficiency vs. cycle number for the Li/LiPF6-EC:DMC (1:1)/LiCoO2 cell at a charge/discharge rate of 0.2/0.2 C at room temperature; and (c) charge/discharge curves and (d) specific capacity and Coulombic efficiency vs. cycle number for the Li/LiFSI– KFSI (χ LiFSI : χ KFSI = 0.41: 0.59)/LiCoO2 cell at a charge/discharge rate of 0.2/0.2 C at 80 ° C.
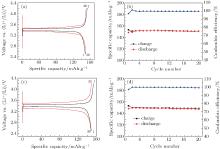
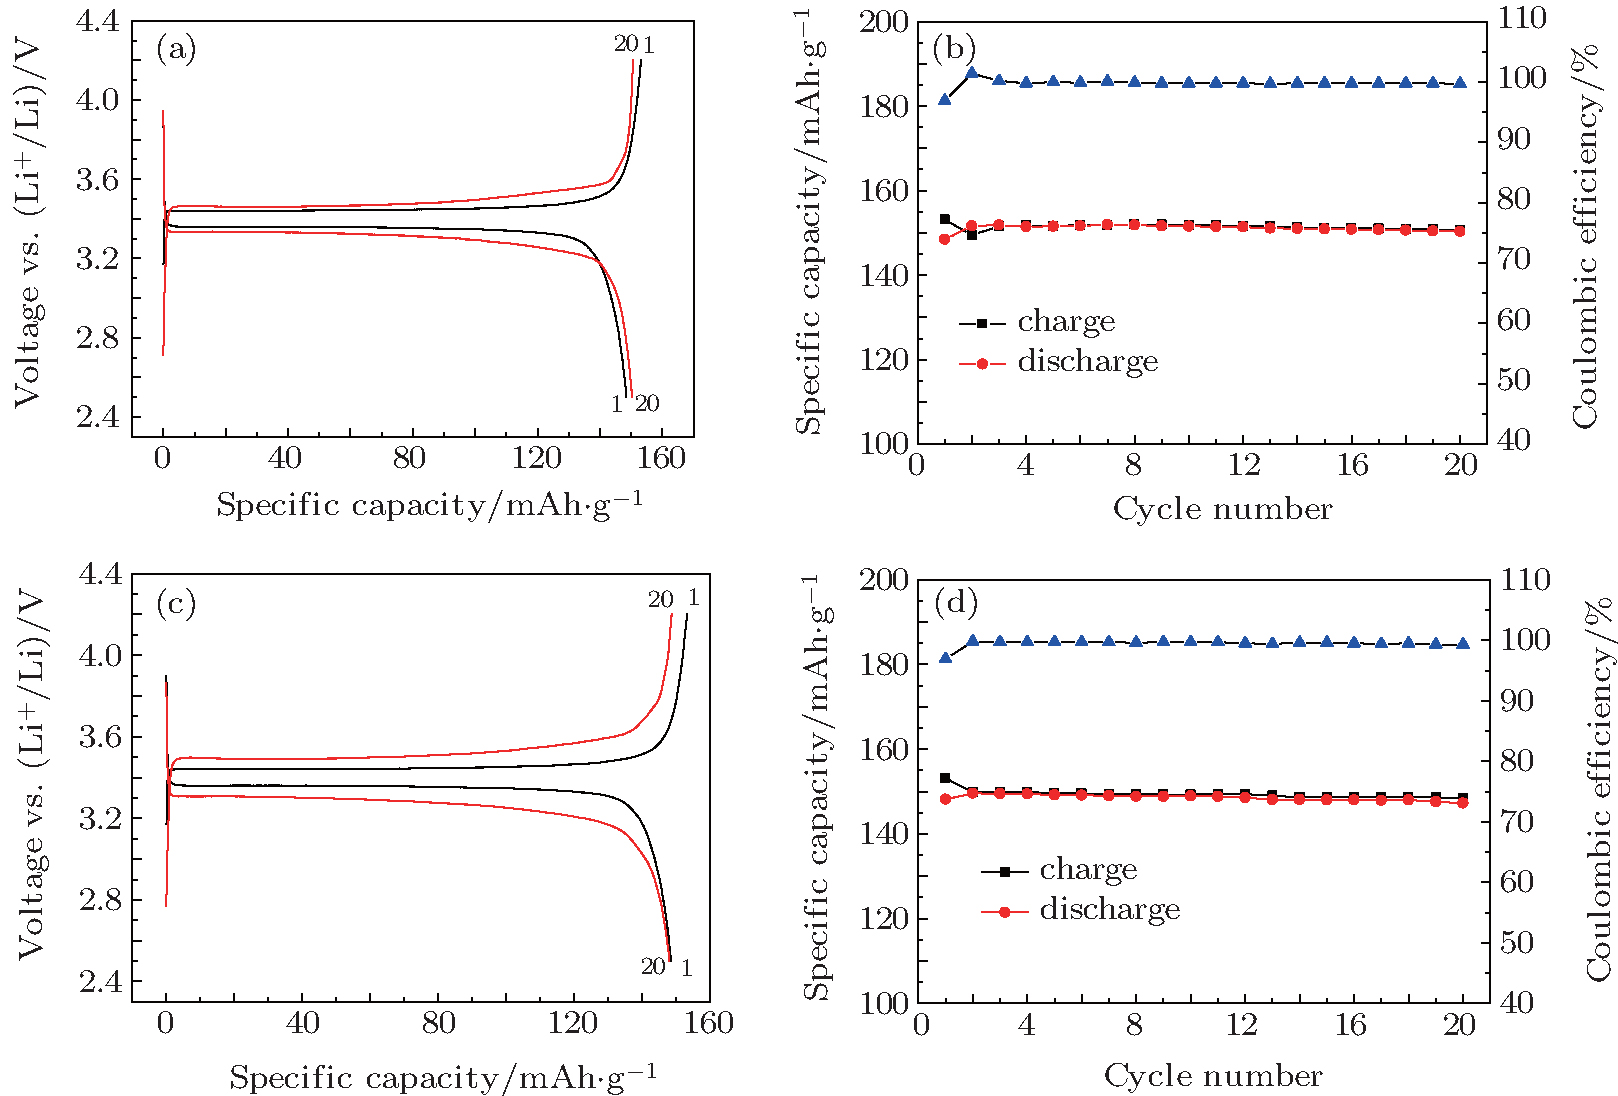
Figures 3(a) and 3(b) show the charge/discharge curves and the specific capacity and Coulombic efficiency vs. cycle number for the Li/LiPF6-EC:DMC (1:1)/LiFePO4 cell at a charge/discharge rate of 0.2/0.2 C at room temperature, and figures 3(c) and 3(d) show the same information for the Li/LiFSI– KFSI/LiFePO4 cell at 80 ° C. Both kinds of Li/LiFePO4 cells show good cycling performances. The charge/discharge capacities for the Li/LiFSI– KFSI/LiFePO4 cell using LiFSI– KFSI molten salt electrolyte in the first and the twentieth cycles are 153.1/148.1 mAh· g− 1 and 148.3/147.2 mAh· g− 1, respectively, and the corresponding Coulombic efficiencies are 96.9% and 99.3%. This is in accordance with Zhou’ s report.[13] The Li/LiFSI– KFSI/LiFePO4 cell was charged until 4.2 V as in the Li/LiFSI– KFSI/LiCoO2 cell, which means that the LiFSI– KFSI molten salt can keep stability in the Li/LiFSI– KFSI/LiFePO4 cell until 4.2 V. Comparing the electrochemical properties of the four types of cells, it is inferred that the poor cycling performance of the Li/LiFSI– KFSI/LiCoO2 cell at 80 ° C is attributed to the incompatibility of the LiCoO2 and LiFSI– KFSI molten salt.
Fig. 3. (a) Charge/discharge curves and (b) specific capacity and Coulombic efficiency vs. cycle number for the Li/LiPF6– EC:DMC (1:1)/LiFePO4 cell at a charge/discharge rate of 0.2/0.2 C at room temperature; and (c) charge/discharge curves and (d) specific capacity and Coulombic efficiency vs. cycle number for the Li/LiFSI– KFSI (χ LiFSI : χ KFSI = 0.41 : 0.59)/LiFePO4 cell at a charge/discharge rate of 0.2/0.2 C at 80 ° C.
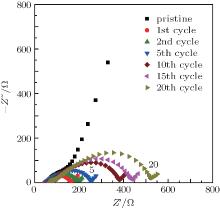
Figure 4 shows the representative impedance spectra of the Li/LiFSI– KFSI/LiCoO2 cell at the fully charged (lithiation) state at various cycles in Fig. 2(c). The impedance of the cell increases along with the cycle number; this is in good agreement with the increasing polarization and the fading capacity of the cell during cycling.
Fig. 4. Impedance spectra obtained at various cycles for Li/LiFSI– KFSI (χ LiFSI: χ KFSI = 0.41: 0.59)/LiCoO2 cell at a charge/discharge rate of 0.2/0.2 C at 80 ° C. They were measured at the fully charged state.
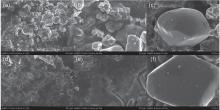
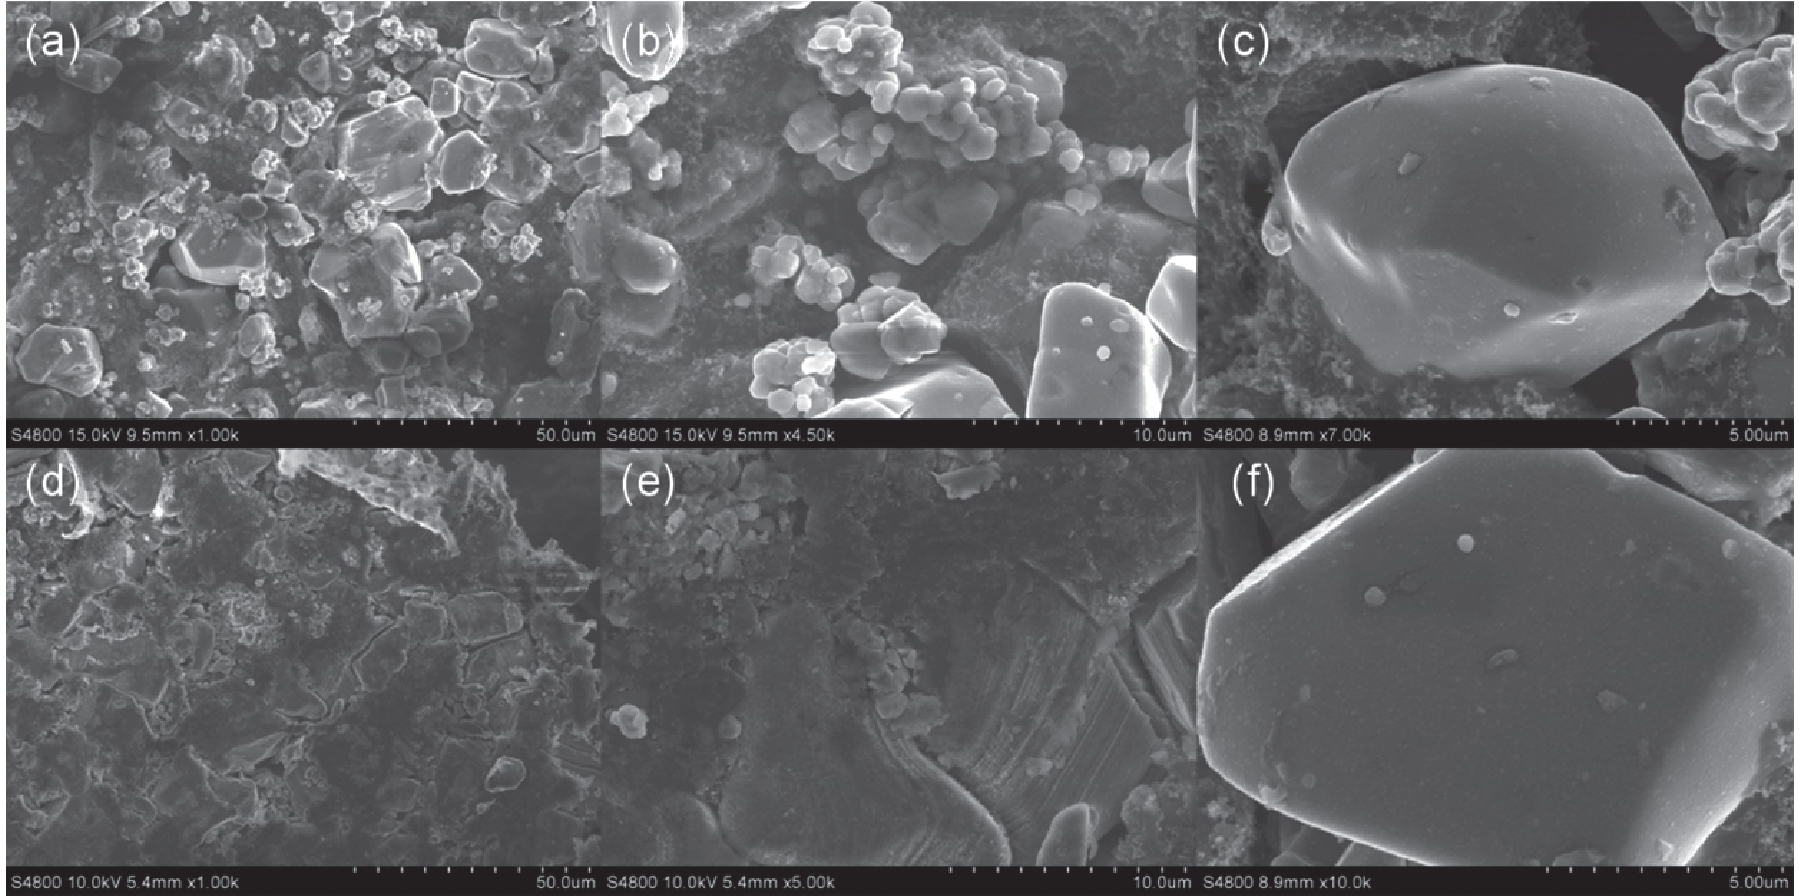
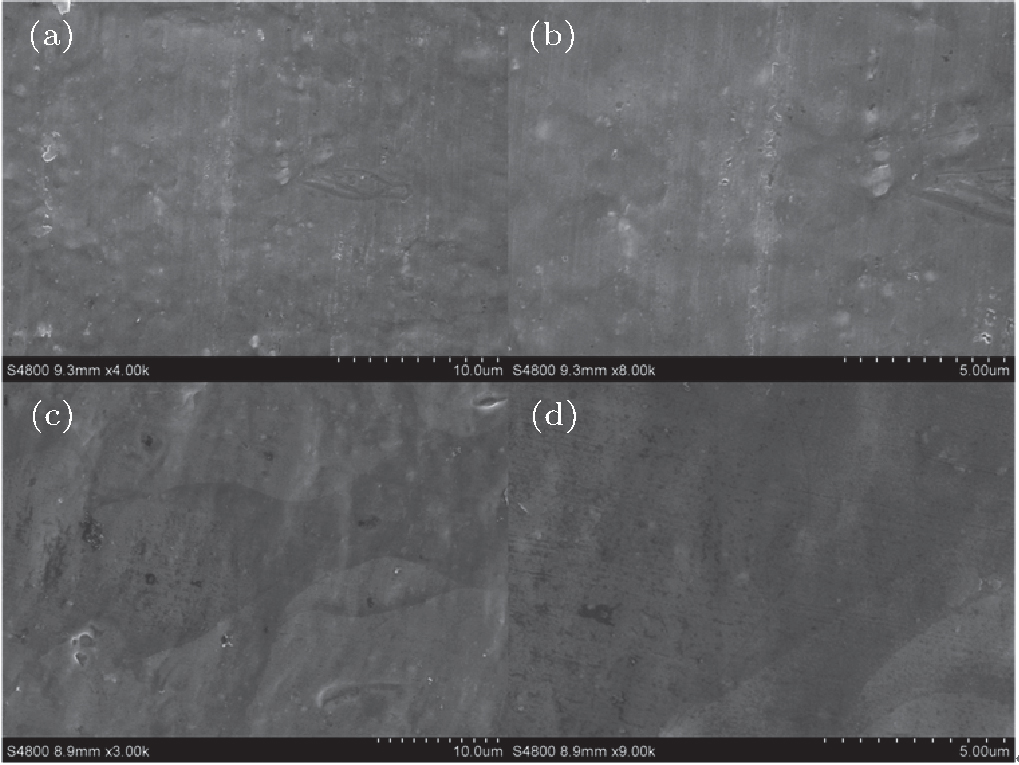
Figure 5 shows the surface morphologies of pristine and cycled LiCoO2 cathodes for the Li/LiFSI– KFSI/LiCoO2 cell. The surface morphology of LiCoO2 has changed after 20 cycles, seeming to be covered by a thin film − say, a solid electrolyte interface (SEI) film. For the LiCoO2 particles, however, no obvious morphology variation occurs in the pristine and cycled LiCoO2 samples.
Fig. 5. SEM micrographs of (a)– (c) pristine LiCoO2 and (d)– (f) LiCoO2 electrode surfaces after 20 charge-discharge cycles for Li/LiFSI– KFSI (χ LiFSI: χ KFSI = 0.41: 0.59)/LiCoO2 cell at a charge/discharge rate of 0.2/0.2 C at 80 ° C.
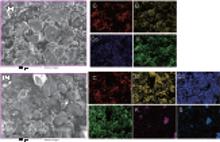
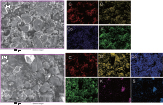
EDS mapping was performed to check the type and uniformity of elements on the LiCoO2 surface. Figure 6 displays the surface element distribution of the LiCoO2 cathode for the Li/LiFSI– KFSI/LiCoO2 cell, including the pristine and the cycled samples. On the pristine LiCoO2 cathode surface four elements C, Co, O, and F are detected, which is consistent with the presence of LiCoO2, acetylene black, and PVDF in the composite electrode. In the cycled sample, another two elements K and S are detected, which is likely induced by an unwanted side reaction happening on the interface of LiCoO2 and LiFSI– KFSI molten salt electrolyte during charging and discharging. From the EDS mapping images, it is inferred that the elemental distribution of the surface is not uniform and the molten salt electrolyte cannot form a dense and homogenous SEI film on the surface of the LiCoO2 cathode to prevent the reaction of LiCoO2 with the LiFSI– KFSI molten salt.
Fig. 6. EDS mapping of (a) pristine LiCoO2 electrode surface and (b) LiCoO2 electrode surface after 20 charge-discharge cycles for Li/LiFSI– KFSI (χ LiFSI: χ KFSI = 0.41: 0.59)/LiCoO2 cell at a charge/discharge rate of 0.2/0.2 C at 80 ° C.
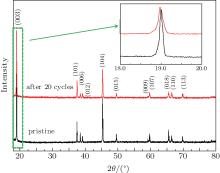
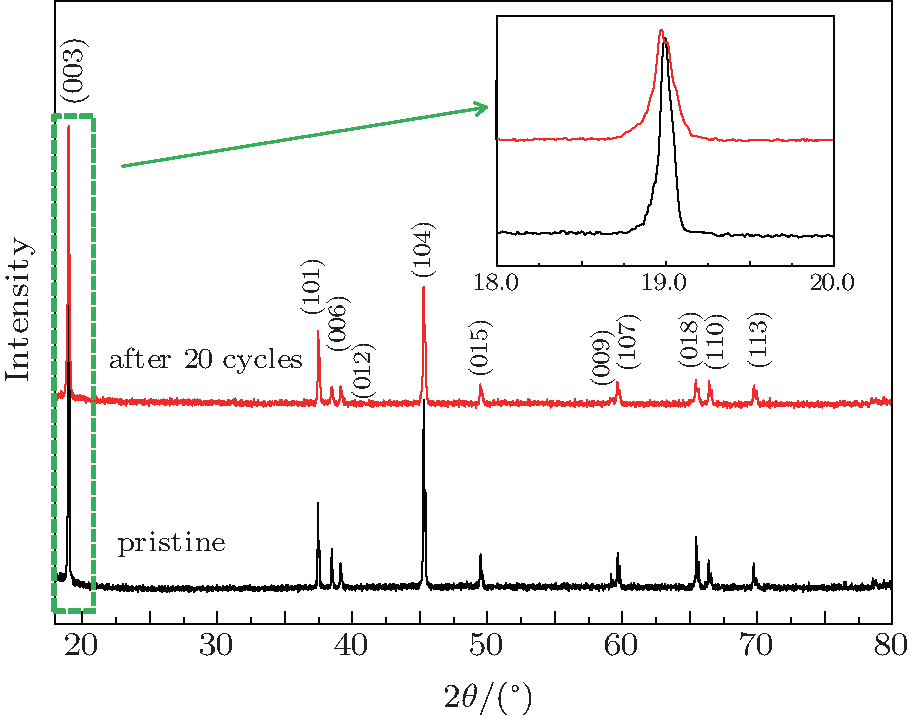
Figure 7 shows the XRD patterns of pristine and cycled LiCoO2 cathodes for the Li/LiFSI– KFSI/LiCoO2 cell. The intensities of the peaks of cycled LiCoO2 are suppressed because of the decomposition by-product of LiFSI– KFSI molten salt on the cathode surface. No new peaks are detected in the XRD pattern of the LiCoO2 cathode after 20 cycles, which is attributed to the limited amount of by-product. However, in the inset of Fig. 7, an obvious broadened trend of the peak appears, which means that increasing disorder exists in the cycled LiCoO2.
Fig. 7. XRD patterns of pristine LiCoO2 electrode (black line) and LiCoO2 electrode after 20 charge-discharge cycles for Li/LiFSI– KFSI (χ LiFSI: χ KFSI = 0.41: 0.59)/LiCoO2 cell at a charge/discharge rate of 0.2/0.2 C at 80 ° C (red line). Inset shows the amplification of the (003) peak.
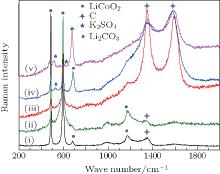
Raman spectra of pristine and cycled LiCoO2 for the Li/LiFSI– KFSI/LiCoO2 cell are shown in Fig. 8. Due to the non-uniform distribution of the by-product caused by the decomposition of the molten salt on the surface of LiCoO2, four areas of the cycled LiCoO2 cathode were chosen to carry out the Raman test. Curve (i) corresponds to the pristine sample, curves (ii)– (v) are for the cycled sample. The peaks of 486 cm − 1, 596 cm − 1, 682 cm − 1, and 1169 cm − 1 are from LiCoO2, [15] the peaks of 1338 cm − 1 and 1583 cm − 1 are from the acetylene black, [15] those of 518 cm − 1 and 526 cm − 1 are from Li2CO3, [16] and those of 610 cm − 1 and 675 cm − 1 are from K2SO4.
Fig. 8. Raman spectra of (i) pristine LiCoO2 electrode surface and (ii)– (v) LiCoO2 electrode surface after 20 charge-discharge cycles for Li/LiFSI– KFSI (χ LiFSI: χ KFSI = 0.41: 0.59)/LiCoO2 cell at a charge/discharge rate of 0.2/0.2 C at 80 ° C.
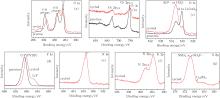
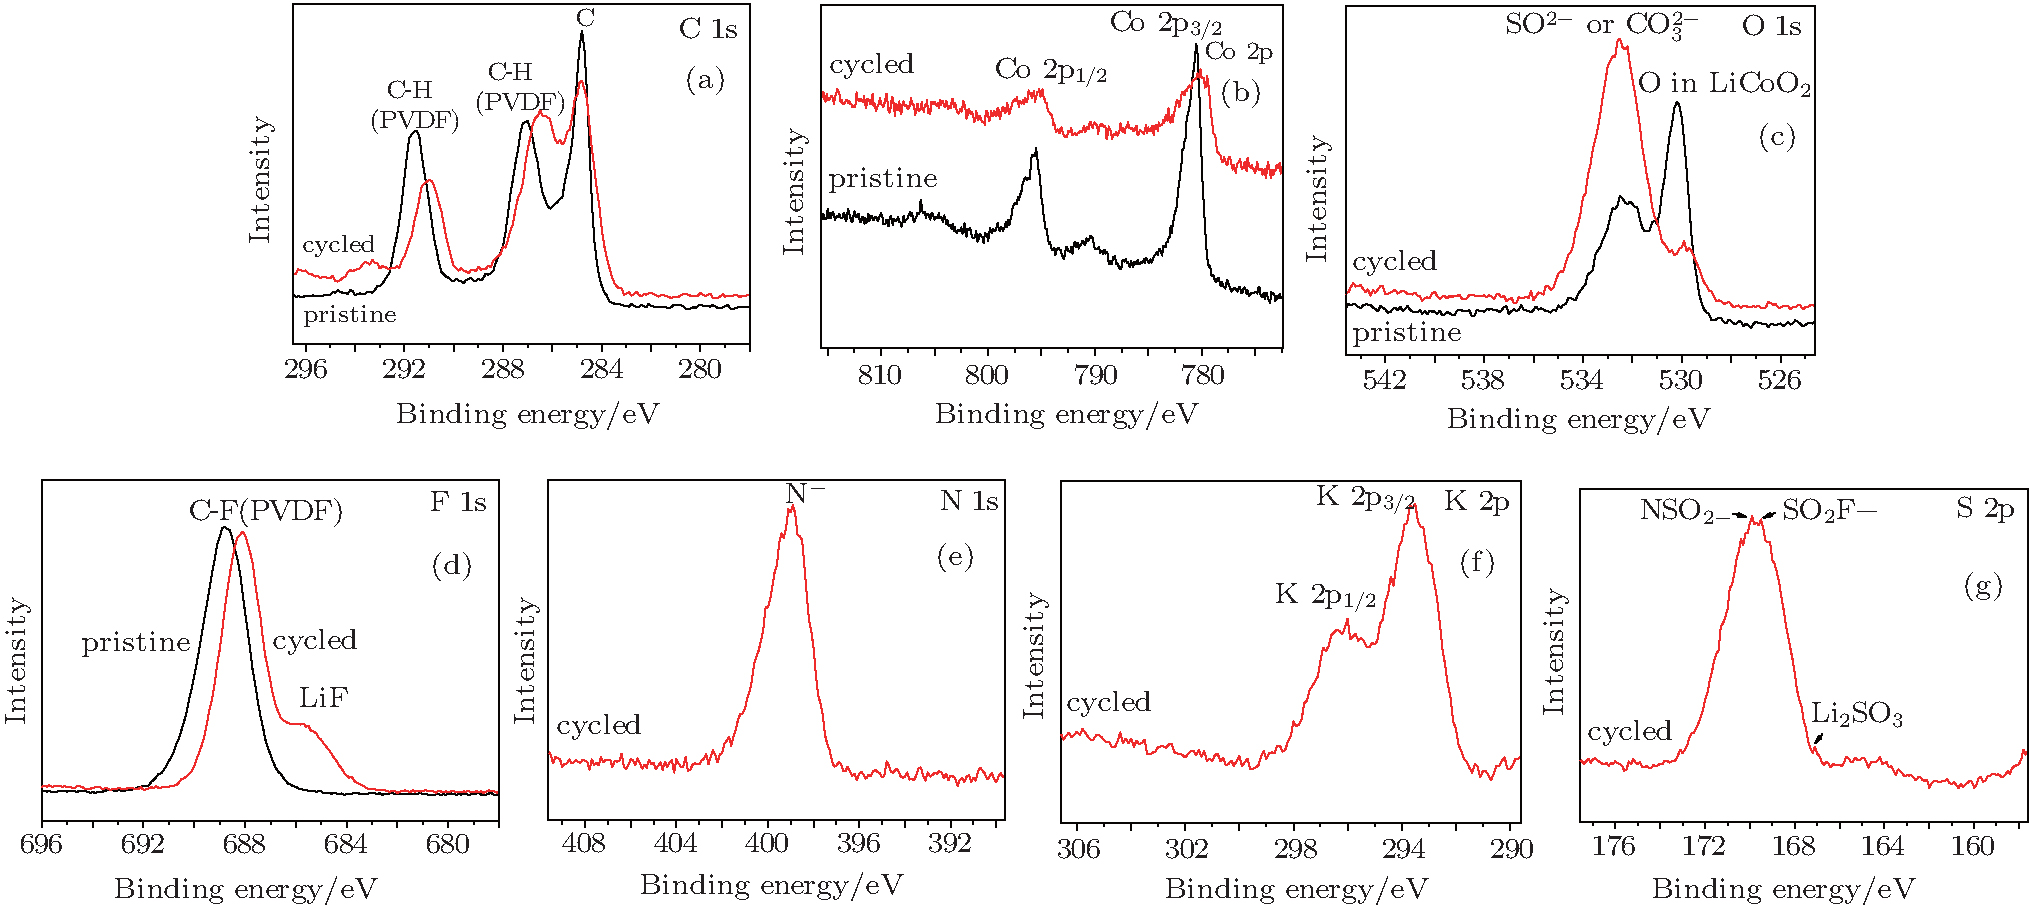
The surface compositions of pristine and cycled LiCoO2 cathodes for the Li/LiFSI– KFSI/LiCoO2 cell were further investigated by using XPS spectra, as shown in Fig. 9. Four elements of C, Co, O, and F are detected on the pristine LiCoO2 cathode surface, which is consistent with the presence of LiCoO2, acetylene black, and PVDF in the composite electrode. Three new additional elements K, N, and S are detected on the cycled LiCoO2 surface. We suppose that the K, N, and S come from the decomposition product of LiFSI– KFSI molten salt electrolyte on the LiCoO2 cathode surface, which is consistent with the result of EDS mapping. The data obtained for XPS binding energies for C 1s, Co 2p, O 1s, F 1 s, N 1s, K 2p, and S 2p, and the proposed assignments are summarized in Table 1. For the C 1s peaks of pristine and cycled LiCoO2 cathode surfaces, the 284.6 eV peak would be assigned to acetylene black, [17] the 286.5 eV and 290.9 eV peaks to C– H in PVDF.[18] The Co 2p peaks of pristine and cycled LiCoO2 cathode surfaces are 780 eV, 795 eV for Co 2p3/2 and Co 2p1/2, respectively.[19] The 529.2 eV peak of O 1s of the pristine and cycled LiCoO2 cathode surfaces is characteristic of O2 − anions of the crystalline network.[19] The O 1s peak of 532.5 eV is assigned to or .[20, 21] The peak around 688 eV of F 1s is assigned to the CF2 in PVDF[22] and the 684.8 eV peak to LiF.[22, 23] The N 1s peak at 398.7 eV is assigned to N − .[21, 23] The S 2p has three peaks at 167.5 eV, 168.9 eV, and 169.9 eV, which could be assigned to Li2SO3, [24] SO2F− , [25] and NSO2-, [26] respectively.
Fig. 9. XPS spectra of pristine LiCoO2 electrode surface (black line) and LiCoO2 electrode surface after 20 charge-discharge cycles for Li/LiFSI– KFSI (χ LiFSI: χ KFSI = 0.41: 0.59)/LiCoO2 cell at a charge/discharge rate of 0.2/0.2 C at 80 ° C (red line): (a) C 1s, (b) Co 2p, (c) O 1s, (d) F 1s, (e) N 1s, (f) K 2p, (g) S 2p.
Table 1.
Table 1.
Table 1. Summary of XPS binding energies and assignments for the pristine LiCoO2 cathode surface and LiCoO2 cathode surface after 20 charge-discharge cycles for Li/LiFSI– KFSI (χ LiFSI: χ KFSI = 0.41: 0.59)/LiCoO2 cell at a charge/discharge rate of 0.2/0.2 C at 80 ° C.
Element
Peak position/eV
Assignment
pristine
cycled
pristine
cycled
C(1s)
284.6 286.5, 290.9
284.6 286.5, 290.9
C C– H in PVDF
C C– H in PVDF
Co(2p)
780 795
780 795
Co 2p3/2 Co 2p1/2
Co 2p3/2 Co 2p1/2
O(1s)
529.2 532.5
529.2 532.5
or
or
F(1s)
689
688 684.8
CF2 in PVDF
CF2 in PVDF LiF
N(1s)
–
398.6
–
N−
K(2p)
–
293.4 296
–
K 2p3/2 K 2p1/2
S(2p)
–
167.5 168.9 169.9
–
Li2SO3 SO2F- NSO2-
Table 1. Summary of XPS binding energies and assignments for the pristine LiCoO2 cathode surface and LiCoO2 cathode surface after 20 charge-discharge cycles for Li/LiFSI– KFSI (χ LiFSI: χ KFSI = 0.41: 0.59)/LiCoO2 cell at a charge/discharge rate of 0.2/0.2 C at 80 ° C.
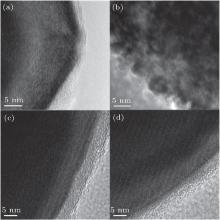
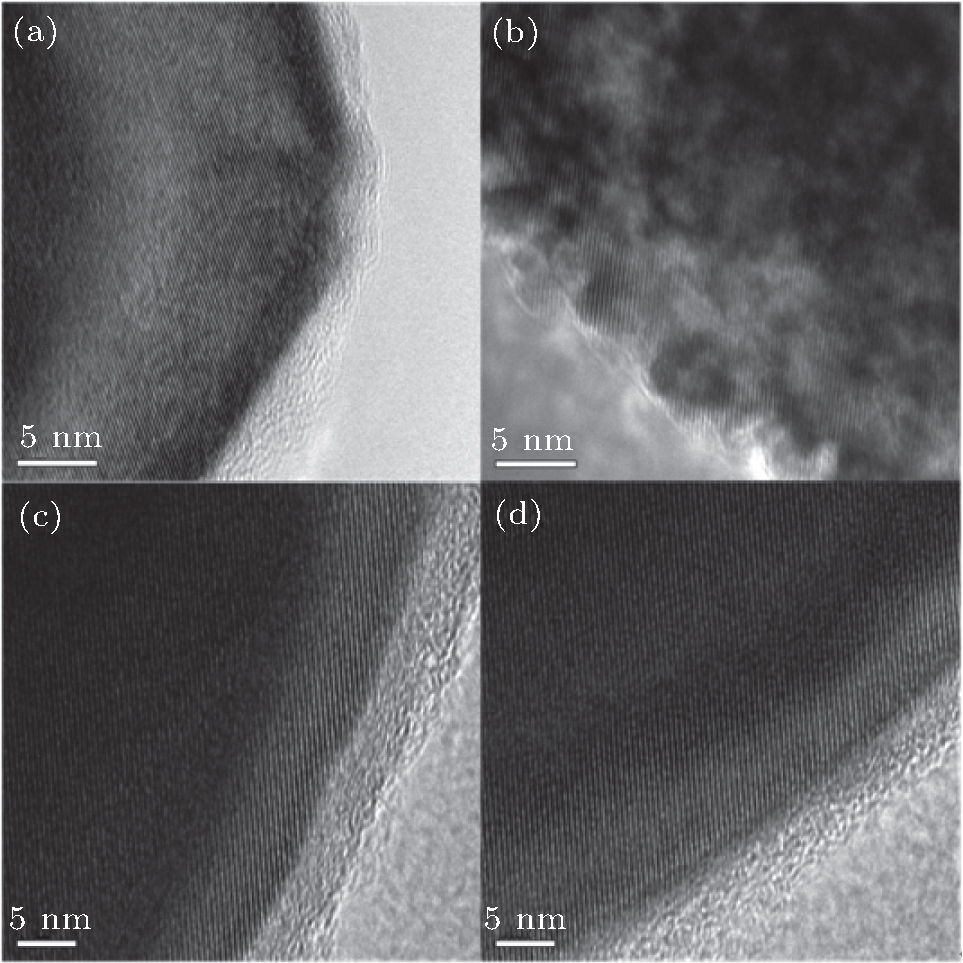
Figure 10 shows the TEM images of pristine and cycled LiCoO2 and LiFePO4 particles for Li/LiFSI– KFSI/LiCoO2 and Li/LiFSI– KFSI/LiFePO4 cells, respectively. Compared with the smooth surface of the LiCoO2 particle before cycling, the LiCoO2 particle is corroded after cycling due to the reaction of LiFSI– KFSI molten salt electrolyte and LiCoO2 on the cathode surface. The LiFePO4 particle is hardly changed by cycling. In the Li/LiPF6-EC:DMC (1:1)/LiCoO2 cell, the corrosion of the LiCoO2 particle was not observed.[27] So the corrosion of the LiCoO2 particle after cycling when using LiFSI– KFSI molten salt electrolyte could be attributed to the reaction of LiCoO2 and LiFSI– KFSI molten salt during cycling.
Fig. 10. TEM images of (a) pristine LiCoO2 particle, (b) LiCoO2 particle after 20 charge-discharge cycles for Li/LiFSI– KFSI (χ LiFSI: χ KFSI = 0.41: 0.59)/LiCoO2 cell at a charge/discharge rate of 0.2/0.2 C at 80 ° C, (c) pristine LiFePO4 particle, and (d) LiFePO4 particle after 20 charge-discharge cycles for Li/LiFSI– KFSI (χ LiFSI: χ KFSI = 0.41: 0.59)/LiFePO4 cell at a charge/discharge rate of 0.2/0.2 C at 80 ° C.
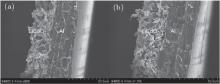
Figure 11 shows the cross-section SEM images of the pristine and cycled LiCoO2 cathodes for Li/LiFSI– KFSI/LiCoO2 cell. It is observed that the active material combines compactly with the Al current collector without any detachment in both of the cathodes.
Fig. 11. Cross-section SEM images of (a) pristine LiCoO2 cathode and (b) LiCoO2 cathode after 20 charge-discharge cycles for Li/LiFSI– KFSI (χ LiFSI: χ KFSI = 0.41: 0.59)/LiCoO2 cell at a charge/discharge rate of 0.2/0.2 C at 80 ° C.
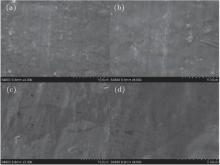
Anhydrous DMC was used to soak and wash away the LiCoO2 active material on the cathode to investigate the surface of the Al current collector. Figure 12 shows the surface morphology of the Al foil before and after 20 cycles in the Li/LiFSI– KFSI/LiCoO2. The surfaces of Al before and after cycling are smooth, without any corrosion, which is different from LiTFSI and LiFSI in organic solvent.[8]
Fig. 12. SEM micrographs of (a), (b) pristine Al foil surface and (c), (d) Al foil surface after 20 charge-discharge cycles for Li/LiFSI– KFSI (χ LiFSI: χ KFSI = 0.41: 0.59)/LiCoO2 cell at a charge/discharge rate of 0.2/0.2 C at 80 ° C.
4. Conclusion
LiCoO2 can charge and discharge in the LiFSI– KFSI (χ LiFSI: χ KFSI = 0.41: 0.59) molten salt electrolyte. But the Li/LiCoO2 cell using this molten salt electrolyte has poor cycling performance at 80 ° C. Its capacity decreases rapidly while its impedance increases along with the cycle number. After cycling, no detachment of active material from Al current collector is observed, and the corrosion of the Al current collector does not appear. It is observed that the LiCoO2 particle is corroded after cycling and the crystallinity is decreased. Some decomposition products of LiFSI– KFSI molten salt are detected on the cycled cathode surface. These results indicate that the reaction of LiFSI– KFSI molten salt electrolyte and LiCoO2 on the cathode surface during cycling is the main origin for the capacity fading.
... KFSI molten salt seems to have a wide electrochemical window[3,12] and shows good performance in a Li/LiFePO4 cell ...
... [12,13] Thus far, however, little attention has been paid to the cycling performance of the LiCoO2 or other materials with higher operating voltage using LiFSI#cod#x2013 ...
... [12] The polarization voltage between the reduction peak and the oxidation peak is about 0 ...
6
2014
0.0
0.0
... 13] Three advantages of molten salt electrolyte over traditional organic liquid electrolyte are the nonflammability, nonvolatility, and high operating temperature above 55#cod#x00A0 ...
... [13] Both the Li/natural graphite and Li/LiFePO4 cells showed good cycling performance ...
... [12,13] Thus far, however, little attention has been paid to the cycling performance of the LiCoO2 or other materials with higher operating voltage using LiFSI#cod#x2013 ...
... [13] The mixture of LiFSI#cod#x2013 ...
... [13] The Li/LiFSI#cod#x2013 ...
1
2004
0.0
0.0
... [14] ...
2
2014
0.0
0.0
... 1 are from LiCoO2,[15] the peaks of 1338#cod#x00A0 ...
... 1 are from the acetylene black,[15] those of 518#cod#x00A0 ...
1
1971
0.0
0.0
... 1 are from Li2CO3,[16] and those of 610#cod#x00A0 ...
1
2007
0.0
0.0
... eV peak would be assigned to acetylene black,[17] the 286 ...
1
2013
0.0
0.0
... [18] The Co 2p peaks of pristine and cycled LiCoO2 cathode surfaces are 780#cod#x00A0 ...
2
2008
0.0
0.0
... [19] The 529 ...
... [19] The O 1s peak of 532 ...
1
2008
0.0
0.0
... [20,21] The peak around 688 eV of F 1s is assigned to the CF2 in PVDF[22] and the 684 ...
2
2006
0.0
0.0
... [20,21] The peak around 688 eV of F 1s is assigned to the CF2 in PVDF[22] and the 684 ...
... [21,23] The S 2p has three peaks at 167 ...
2
2002
0.0
0.0
... [20,21] The peak around 688 eV of F 1s is assigned to the CF2 in PVDF[22] and the 684 ...
... [22,23] The N 1s peak at 398 ...
2
2012
0.0
0.0
... [22,23] The N 1s peak at 398 ...
... [21,23] The S 2p has three peaks at 167 ...
1
2004
0.0
0.0
... eV, which could be assigned to Li2SO3,[24] SO2F#cod#x2212 ...
1
2004
0.0
0.0
... ,[25] and NSO2-,[26] respectively ...
1
2007
0.0
0.0
... ,[25] and NSO2-,[26] respectively ...
1
2012
0.0
0.0
... [27] So the corrosion of the LiCoO2 particle after cycling when using LiFSI#cod#x2013 ...
Instability of lithium bis(fluorosulfonyl)imide (LiFSI)–potassium bis(fluorosulfonyl)imide (KFSI) system with LiCoO2 at high voltage
[Zhang Shua), Li Wen-Juna), Ling Shi-Ganga), Li Hong†a), Zhou Zhi-Binb), Chen Li-Quana)]


 , Zhou Zhi-Bin