Tip-splitting instability in directional solidification based on bias field method
[You Jia-Xue, Wang Zhi-Jun, Li Jun-Jie, Wang Jin-Cheng† ]
]
]
|
|


†Corresponding author. E-mail: jchwang@nwpu.edu.cn
*Project supported by the National Basic Research Program of China (Grant No. 2011CB610401), the National Natural Science Foundation of China (Grant No. 51371151), and the Free Research Fund of State Key Laboratory of Solidification Processing, China (Grant No. 100-QP-2014).
Tip splitting instability of cellular interface morphology in directional solidification is analyzed based on the bias field method proposed recently by Glicksman. The physical mechanism of tip instability is explained by analyzing the interface potential, the tangential energy flux, and the normal energy flux. A rigorous criterion for tip-splitting instability is established analytically, i.e., the ratio of the cellular tip radius to the cellular width
Material properties of casting alloys not only depend on their macroscopic shapes and compositions, but are also strongly influenced by their microscopic patterns.[1] Cellular pattern formation during directional solidification, as one of the important patterns appearing at the solid– liquid interface during solidification, is of both practical and scientific interest in materials science.[2] The characterization and control of such patterns and their transitions evolving during solidification are of considerable significance, since the material properties and the quality of the solidified sample are closely connected with them. Cellular patterns grow under conditions close to the limit of constitutional undercooling of the corresponding planar interface.[3] Before the steady state is achieved, cellular spacings usually adjust through cell elimination and tip-splitting.[4] On the low velocity side, low amplitude cells tend to have flat tips that are prone to tip splitting.
As a kind of interface instability, tip splitting is a quite widespread growth mode in non-equilibrium systems, especially in those with small surface tension/kinetic anisotropy, such as electrochemical deposition, precipitation from a supersaturated solution, solidification from undercooled melts, amorphous annealing, and spherulitic growth.[5] For the physical mechanism of tip splitting in directional solidification, it is believed that if side-branches form too close to the tip, the tip will split.[6] So, quite similar to that of side-branching, the physical mechanism of tip splitting in directional solidification has two main different explanations, i.e. noise-induced instability[1, 7– 12] and deterministic dynamics.[13– 21] The former advocates that noise may be strong enough not only to trigger side-branches but also to destroy the tips growing in a preferred direction of high interface energy and marked anisotropy, i.e., strong noise will result in ineffective smoothing of the surface energy plot, which will enable tip splitting and a transition to seaweed patterns.[12] The ability of a sufficiently strong random noise in the melt to cause tip-splitting also has received some experimental and simulation supports. Both experiments and simulations have shown that strong random noise can trigger tip-splitting.[8] However, both theoretical and simulation works have also demonstrated that side-branching and tip-splitting can happen with very weak noise, and even without noise.[17– 19] Moreover, for noise-induced instability, tip-splitting structures in experiments could not be observed for longer periods of time.[8] The most criticized aspect of the proposed noise-induced mechanism is that such a noise-induced instability mechanism does not really clarify the origin and essence of the side branching, as pointed out by Xu et al.[17] Glicksman also pointed out that noise might affect patterns in nature, but it is neither causal nor essential for their formation.[18] Karma also admitted that there exist additional purely deterministic solutions to the steady-state growth equations, even in the absence of noise. In addition, he suggested that no theory of noise-induced tip splitting that includes non-equilibrium effects is under discussion.[6] According to the deterministic mechanisms of side-branching of dendritic growth discussed by Glicksman et al.[18] and Xu et al.[17], as well as a phase field simulation by Wang et al.[19] it is quite reasonable to propose that tip-splitting in directional solidification should be deterministic, due to the similarity of tip-splitting and side-branching. With an asymptotic method, Xu et al.[17] investigated the global instability mechanisms of arrayed-cellular growth and found that the instability of cellular morphology is connected to a so-called global trapped wave mechanism instead of being noise-related. Using phase field simulations, Wang et al.[13] suggested that the cellular tip splitting instability belongs to the internal mechanism of certainty considering non-monotonic curvature distribution from the cellular tip to grooves when the ratio of the cellular tip radius to the cellular width exceeds a critical value. However, the deterministic mechanism still needs more evidence in theory and experiments, compared with the noise-induced instability mechanism. Very few analytical models have been proposed to study tip splitting due to its complex intrinsic essence of nonlinearity. Therefore, further research is still required to solve the problem of tip splitting instability.
Recently, to elucidate melting kinetics phenomena in microgravity experiments, Glicksman proposed a bias field method based upon considering the Gibbs– Thomson temperature distribution as an active independent interface energy field with gradients and fluxes.[14] Using this method, Glicksman successfully explained the melting kinetics phenomena and also proved the deterministic mechanism of dendritic branching.[15, 16] Compared with the previous dendritic growth theories, the mechanism of dendritic branching based on this new method is in good agreement with the best quantitative experiments on model solidification systems.[15] Based on the great success of this method on the mechanism of dendritic branching, we believe that this new method could also be successful in the analysis of tip-splitting instability. Therefore, in this study, we adopt this method to accurately explore the tip-splitting instability with the aim to expose the deterministic dynamic mechanism of tip-splitting instability of cellular interface morphology in directional solidification.
The main idea of the bias field method is outlined below. Readers can also find more detail in Refs. [15] and [16]. In this method, Glicksman suggested that the Gibbs– Thomson equilibrium temperature is much more than a boundary condition on the transport field; it acts as an independent energy field during crystal growth and produces profound effects not recognized heretofore. Those responses initiate rotation of the interface at specific locations determined by the surface energy and the shape. Interface rotations with proper chirality, or rotation sense, couple to the external transport field and amplify locally as side-branches. In the dendrite side-branching analysis, he approximated the dimensionless dendrite shape by a semi-ellipse function, i.e.,

where a is the semimajor axis, b is the semiminor axis, while η = y/a and μ = x/a define the dimensionless coordinate axes for the starting shape. Meanwhile, the interface potential satisfies

where 


where ∇ σ is the tangential vector gradient operator, and σ denotes a dimensionless unit vector that is parallel to the interface and pointing toward the tip.
As mentioned above, Glicksman used a semi-ellipse function as a prescribed dendritic interface; however, this shape assumption is not suitable for steady cellular growth. To quantitatively describe the steady cellular morphology, previous studies have found that within a certain range, steady cellular growth is very similar to the growth of a viscous finger, and the analytical solution of the viscous finger can be used to accurately describe cellular morphologies from tip to root. So far, the viscous finger function is the most accurate description of steady cellular shapes. This is why so many researchers describe steady cell shapes by using the three-dimensional Saffmann– Taylor function.[13, 22] Here we also adopt the viscous finger function to describe the initial cellular morphology, i.e.,

where z0 is the tip position, and R and b represent the cellular tip radius and the cellular width, respectively. The shape that is non-relevant to z0 is determined by R and b. Thus making z0 = 0 simplifies the function and transforms it into a dimensionless form

where η = x/b, μ = z/b, and α = R/b. According to Eq. (6), the cell shape depends only on the dimensionless number α , which is defined as the shape factor.
Although equation (6) is not an explicit function of anisotropic interfacial energy, the shape itself from Eq. (6) implies a certain anisotropy strength of interfacial energy. The initial shapes depend on both kinetic growth conditions, such as the pulling velocity, thermal gradient, and cellular spacing, and thermodynamic conditions, such as the anisotropy strength of interfacial energy, which is a vital intrinsic property of materials. When the kinetic growth conditions remain constant, the anisotropy strength of interfacial energy solely determines the initial shape. Thus, there is a one-to-one correspondence between the initial shape and the anisotropy strength in this case. Moreover, the solid– liquid interface cannot develop into cells or dendrites if the anisotropic interfacial energy does not exist. Therefore, the shape itself from Eq. (6) implies a certain anisotropy strength of interfacial energy.
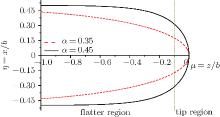
Figure 1 shows the interfacial configuration from the flatter region to the tip region of a cell according to Eq. (6). With a decrease of shape factor α , the cell shapes change from blunt finger to needle-like and these morphological differences for initial shapes imply some important information of morphological evolution, which will be discussed later. Here we choose the dimensionless length μ from − 1 (the flatter region) to 0 (the tip region), considering that the Gibbs– Thomson temperature distribution on a curved interface consists only of an extremely weak variation from the curved tip region to the flatter region and has almost no effect on the flatter region that is far away from the tip, i.e., the groove of the cell. Moreover, the unit of dimensionless length μ is several times the tip radius. To conveniently describe Fig. 2, we define the tip region as 0 ≥ μ ≥ − 0.1 and the flatter region as − 0.1 ≥ μ ≥ − 1.
 | Fig. 1. Cellular shapes from flatter region to tip region with different shape factors α . For the convenience of description of Fig. 2, we define the tip region as 0 ≥ μ ≥ − 0.1 and the flatter region as − 0.1≥ μ ≥ − 1. |
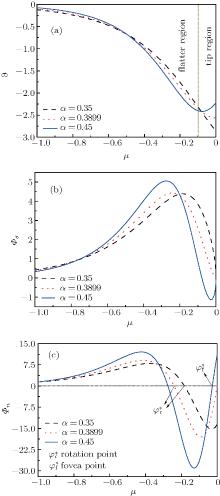
 | Fig. 2. (a) Distribution of the Gibbs– Thomson interface potential versus μ = z/b for viscous finger cellular growth. (b) Tangential energy flux magnitude driven by the tangential gradients of the interface potential. (c) Normal energy flux magnitude associated with energy conservation on the interface. Energy accumulation on the interface is the (negative) divergence of the tangential capillary flux vector. |
Using Glicksman’ s bias field method, together with the viscous finger morphology approximation, we obtain different initial shapes by changing the shape factor α from 0.35 to 0.45, as shown in Fig. 1. In the following, we will first describe the obtained results, and then discuss the physical mechanism of tip-splitting. Finally, we will compare our results with other results.
According to Eqs. (2)– (4) and (6), the interface potential ϑ , the tangential energy flux Ф σ , and the normal energy flux Ф n can be obtained, as shown in Figs. 2(a)– 2(c), respectively. From Fig. 2(a), it can be found that within the interesting range of μ , the interface potential is always negative, which indicates that the interface remains below its thermodynamic melting temperature (ϑ = 0) everywhere. Figure 2(a) also shows that, with the increase of α , the variation of the interface potential with dimensionless length μ decreases monotonously along the interface from the flatter region to the tip region until α exceeds a certain value α * . To determine α * , we solve the equation dϑ /dμ = 0(μ → 0). The exact value of 


From Figs. 1 and 2, it can be found that, when α ≥ α * , the state of the cellular tip is like a blunt finger shape. In this case, both the interface potential and the tangential energy flux decrease toward an extreme point of minimum with the increase of μ in the tip region. Meanwhile, the normal energy flux changes from negative to positive and goes across the 0 line with a unique intersection point 
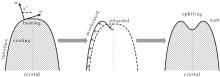
As shown in the left panel of Fig. 3, the change of the normal energy flux in the tip region means that the weak Gibbs– Thomson energy will cool (negative normal energy flux) or heat (positive normal energy flux) the interface slightly, separated by the fovea point where the surface Laplacians of potential vanish. Simultaneous opposing tendencies — of accelerating from cooling and retarding from heating — combine, and induce a wave-like ripple or fovea of the interface, as shown in the middle panel of Fig. 3. Once the tip fovea is formed, it will couple to the strong external transport field in the adjacent melt and eventually develop into a cellular tip splitting mode, as illustrated in the right panel of Fig. 3. So, the fovea point implies cellular tip splitting instability. It follows that cellular tip splitting, free of any noise, is generated deterministically. This idea is further validated by Fig. 4, as will be illustrated in the following. Moreover, comparing the case of α = 0.3899 (red line) with that of α = 0.45 (blue line) in Fig. 2(c), it can be found that, with the increase of α , the fovea point is further and further away from the tip, though never too far.
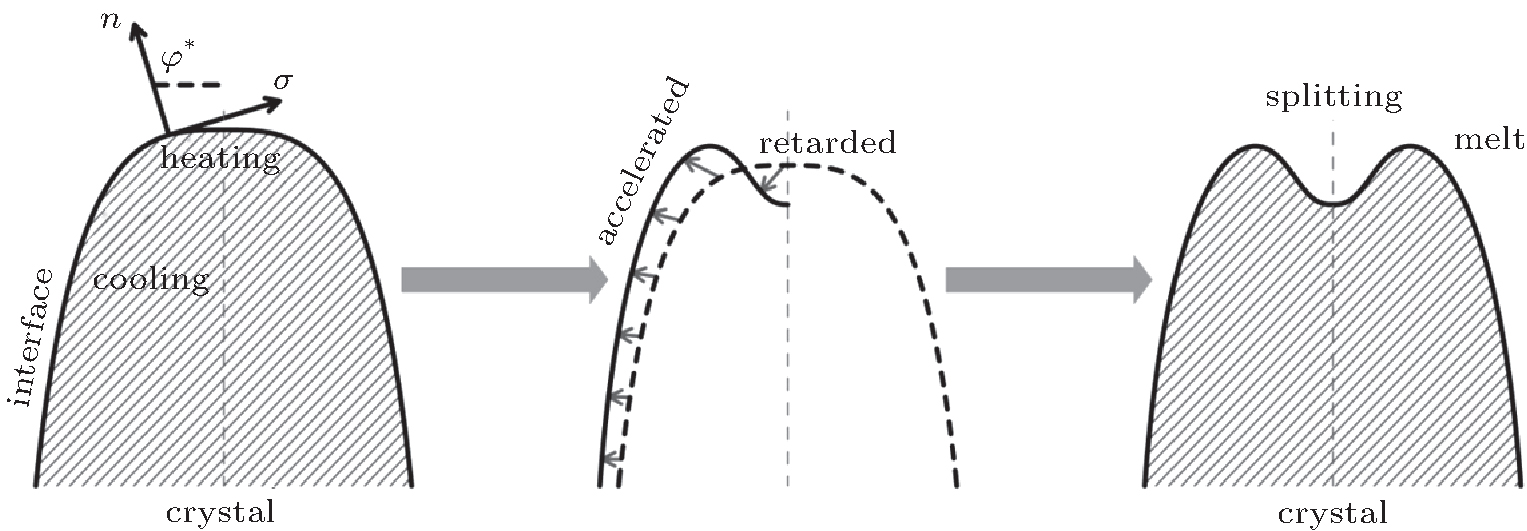 | Fig. 3. Schematics of cellular tip splitting. Influence of a zero in the time rate of change of freezing at location φ * ; where the surface Laplacians of the potential, or curvature, vanish, i.e., Ф n = 0. |
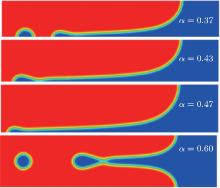
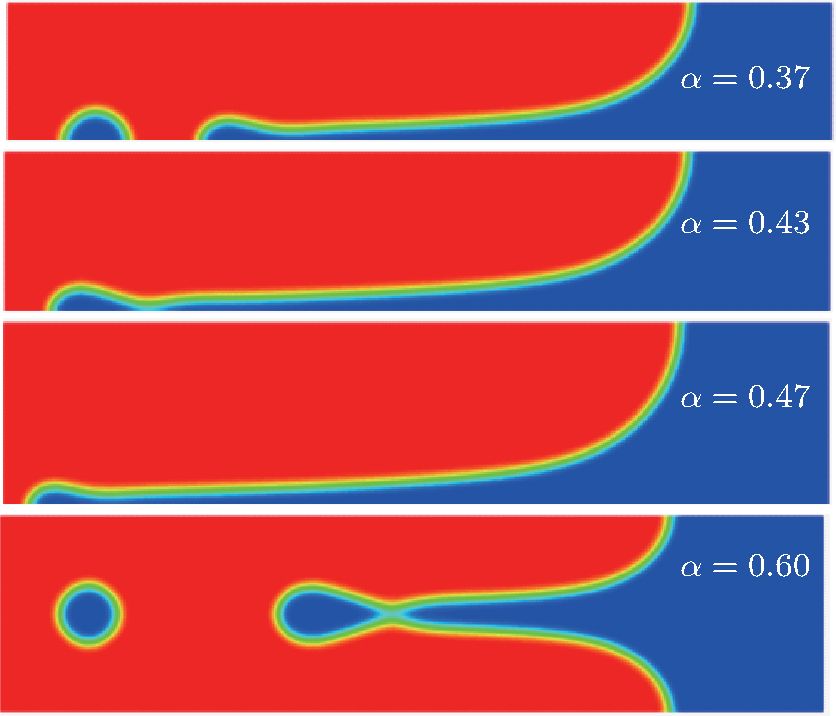 | Fig. 4. Steady cellular morphologies with different values of α from phase field simulations. |
Nevertheless, how the tip fovea couples to the strong external transport field in the adjacent melt and eventually develops into a cellular tip splitting mode has not been exposed clearly at all. Here we try to explain it clearly from the viewpoint of solute diffusion and tip undercooling. With the increase of α , the cellular shape is more like a blunt finger, and thus a wider tip appears, which will increase the solute diffusion length at the tip region. Solute aggregates in the tip region, which causes the increase of solutal undercooling Δ Tc in the phase diagram. Meanwhile, the increase of α will increase the tip radius R, which results in a decrease of curvature undercooling Δ TR due to Δ TR= 2Γ /R. This tendency corresponds to Δ T = Δ Tc+ Δ TR= constant. With the increase of the solute concentration, solutal undercooling Δ Tc increases continuously. When Δ Tc > Δ T, the value of Δ TR turns negative, which means that the radius of curvature R changes from positive to negative and the tip changes from convex to concave, i.e., the tip fovea is formed. In the meantime, the fovea receives a smaller flux than other regions close to it from the liquid because of a longer diffusion length, which starves its growth, as shown in Fig. 7 of Ref. [6]. So tip-splitting occurs.
When the shape factor α is less than α * , the cell shape changes into a needle shape. As is well known, the change of cell shape from a blunt finger shape into a needle or parabolic shape brings the possibility of side-branching.[23, 24] In this case, the interface potential changes from a non-monotonic distribution to a monotonic one, which will cause a similar variation of the tangential energy flux in the tip region. In the meantime, the normal energy flux remains negative in the tip region, which indicates that the fovea point disappears and the cellular tip keeps stable. In the flatter region, the normal energy flux changes from positive to negative and goes across the 0 line with a unique intersection point 

To further validate the obtained criterion of cellular tip-splitting instability, the comparison with the simulated result is also illustrated. Using the quantitative phase field model, we repeat the work of Wang et al.[13] one of the authors in the present paper, and acquire similar results, as shown in Fig. 4. The phase-field simulation is performed with dilute alloy SCN-0.05 mol% ACE, in which the chemical diffusion coefficient in the liquid phase is D = 1.27 × 10− 9 m2/s, the partition coefficient is K = 0.1, the Gibbs– Thomson coefficient is Γ = 6.48 × 10− 8 K· m, and the slope of the liquidus line is m = − 222 K/mol. The surface tension anisotropy strength is set as 0.01. The temperature gradient is chosen as 100 K/cm, and the pulling velocity is V = 50 μ m/s; these values put the system in the cellular growth regime. The simulation is performed in two dimensions with explicit time stepping. The diffuse interface thickness in the phase field model is W = 0.5 μ m with the grid size dx = 0.4 W, which has been tested for simulation convergence. Figure 4 shows the phase field simulation results of steady cellular morphologies with different values of shape factor α . Different cellular spacings are given as initial conditions before cellular morphologies evolve into a steady state. The simulation results show that, with the increase of cellular spacings, the shape factor α increases, and when α reaches a certain critical value, the curvature distribution along the cellular interface becomes non-monotonic so that the tip curvature is minimized and the bilateral curvature is maximized. The increasing bilateral maximum curvature indicates more rapid solutal diffusion, which enhances the propagation of the bilateral interface. Therefore, eventually, the fastest-growing region will be around the bilateral shoulders and no longer at the cellular tip, and thus cellular tip splitting will occur. So the curvature distribution along the cellular interface implies that competition between the cellular tip and the bilateral shoulders is the deterministic mechanism of cellular tip splitting in directional solidification.[13] Our analytical results also show that the non-monotonic curvature distribution leads to a non-monotonic distribution of the tangential energy flux at the tip region, which in turn results in the normal energy flux changing from negative to positive in the tip region. Therefore, simultaneous opposing tendencies induce a wave-like ripple or fovea of the interface. Once the tip fovea is formed, it will couple to the strong external transport field in the adjacent melt and eventually develop into a cellular tip splitting mode. So our analytical results are in total agreement with the phase field simulation results. Nevertheless, the simulated results of Fig. 4 show that observable tip-splitting will occur when α ≥ 0.6, while our analytical result shows that, when 

Using the bias field method proposed by Glicksman, together with the viscous finger morphology approximation, we explore the cellular tip splitting instability in cellular growth during directional solidification. By solving the interface potential, the tangential energy flux, and the normal energy flux, the physical intrinsic mechanism of cellular tip splitting is explained. Based on a trend analysis of the three physical variables, a rigorous criterion for the instability of tip-splitting is established analytically, i.e., 
We thank Prof. Martin Glicksman, at the Florida Institute of Technology, Melbourne, Florida, USA, for helping us ascertain the critical bias field condition for tip splitting more precisely.
| 1 |
|
| 2 |
|
| 3 |
|
| 4 |
|
| 5 |
|
| 6 |
|
| 7 |
|
| 8 |
|
| 9 |
|
| 10 |
|
| 11 |
|
| 12 |
|
| 13 |
|
| 14 |
|
| 15 |
|
| 16 |
|
| 17 |
|
| 18 |
|
| 19 |
|
| 20 |
|
| 21 |
|
| 22 |
|
| 23 |
|
| 24 |
|
| 25 |
|
| 26 |
|
| 27 |
|