Characterizing silicon intercalated graphene grown epitaxially on Ir films by atomic force microscopy
Zhang Yonga) , Wang Ye-Liang†a), b)  , Que Yan-De
a) , Gao Hong-Juna), b)
, Que Yan-De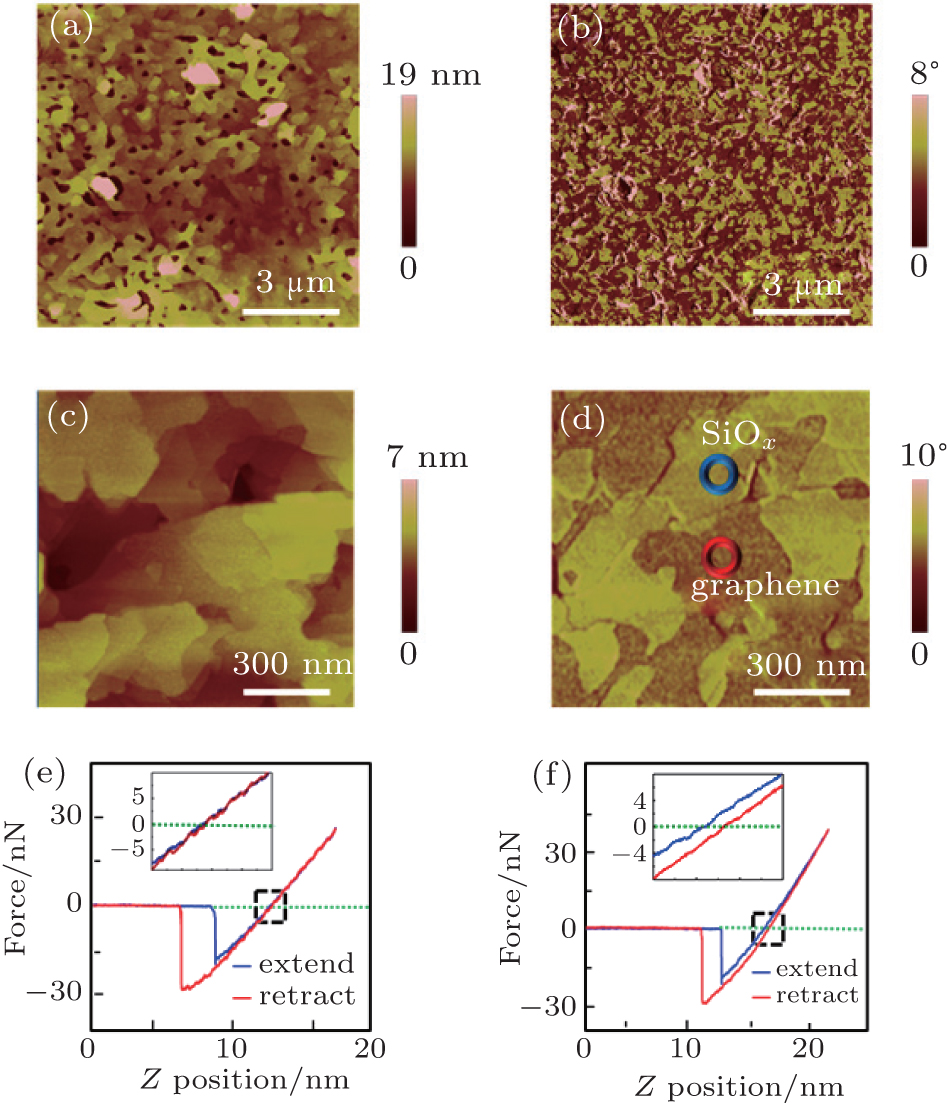
Characterizing silicon intercalated graphene grown epitaxially on Ir films by atomic force microscopy |
|
Zhang Yong
, Que Yan-De |
| AFM characterization of Si intercalated graphene. (a) Representative topographic image of the Si intercalated graphene on Ir thin film. (b) The corresponding phase image with two distinct types of color contrasts (yellow and brown), indicating the locations of silicon oxide and graphene, respectively. (c) A zoomed-in image of panel (a). (d) The corresponding phase image of panel (c). All the above four images were acquired by tapping mode with a scanning rate of 1 Hz. (e) and (f) Force curves acquired at the locations marked by red and blue circles in panel(d), respectively. The red and blue curves correspond to retracting and extending modes, respectively. The cross points of the green dashed-line and the force curves indicate that the tip reaches a balance status of repulsive and attractive forces. The insets are the zoomed-in force curves from the black dashed squares shown in panels (e) and (f). |
| |