Department of Physics, Southeast University, Nanjing 211189, China
†Corresponding author. E-mail: yktang@seu.edu.cn
*Project supported by the National Natural Science Foundation of China (Grant Nos. 10904013 and 11274060), the Natural Science Foundation of JiangsuProvince, China (Grant Nos. BK2009260 and BK20141329), and the Scientific Research Staring Foundation for the Returned Overseas Chinese Scholars,Ministry of Education of China.
1. IntroductionNarrow gap semiconductor Bi2Te3 alloys with Sb2Te3 and Bi2Se3, as classic room temperature thermoelectric materials[1– 4] have been widely studied for many years. They have excellent thermoelectric performance which is attributed to their special near-gap electronic structure combined with low lattice thermal conductivity.[5] In 2009, Bi2Te3, Sb2Te3, and Bi2Se3 are theoretically predicted to be the simplest three-dimensional (3D) topological insulators (TIs) by Zhang et al.[6] These 3D TIs have a new state of quantum matter, which is distinct from simple metal or an insulator in the sense that its bulk is insulating (with a bulk band gap), while its surface (or edge) is metallic due to the presence of gapless surface (edge) states. A spin-orbit interaction induced band inversion leads to the existence of a metallic topological surface state.[7]
Until now, plenty of experimental work exists concerning high-quality samples being produced in many groups, [8– 10] and the Bi2Te3 samples have been synthesized via various methods, such as molecular beam epitaxy (MBE), [11, 12] metal-organic chemical vapor deposition (MOCVD), [13, 14] electrochemical deposition, [15– 18] a modified Bridgman method, [19, 20] and other wet chemical methods.[21– 23] Since bismuth and tellurium are susceptible to oxidation at high temperature, a vacuum is a necessary part of the experiment for the different methods. However, the reality is that experiments could not be performed under an absolute vacuum. The level of oxygen component is an issue that cannot be ignored in experiments. To the best of our knowledge, the influence of oxygen on the crystal growth has not been investigated and little work has been performed on the growth conditions for Bi2Te3 under different air pressures. To explore these problems, in this work the Bi2Te3 crystal growth has been studied using the solid-state reaction method through controlling the air pressure in the silica tube.
2. ExperimentsSingle crystals of Bi2Te3 were grown by the solid-state reaction method. High purity Bi (99.999%) and Te (99.999%) powders were mixed, placed in alumina crucibles of 12 mm in diameter and then sealed in evacuated quartz tubes with air pressure kept to be 1.0 × 10− 3 Pa, 1.0 × 10− 2 Pa, and 1.0 × 10− 1 Pa respectively. The crystal growth for Bi2Te3 involved heating to 800 ° C and holding for 12 h, then cooling from 800 ° C to 550 ° C over a period of 6 days. The crystalline sample was maintained at this temperature for 24 h. The crystals were then furnace cooled to room temperature.
The structures of the prepared samples were determined from x-ray diffraction (XRD) pattern analysis. The data were collected on a Smart lab diffractometer with Cu Kα radiation (λ = 1.5406 Å ) using the continuous scanning mode. The scanning range was 10– 90 (2θ ) degree with a step size of 0.02 degree. Surface morphology was examined by a scanning electron microscope (SEM) FEI Inspection F 50, and the chemical composition was obtained using x-ray energy dispersive analysis (EDS).
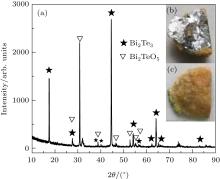
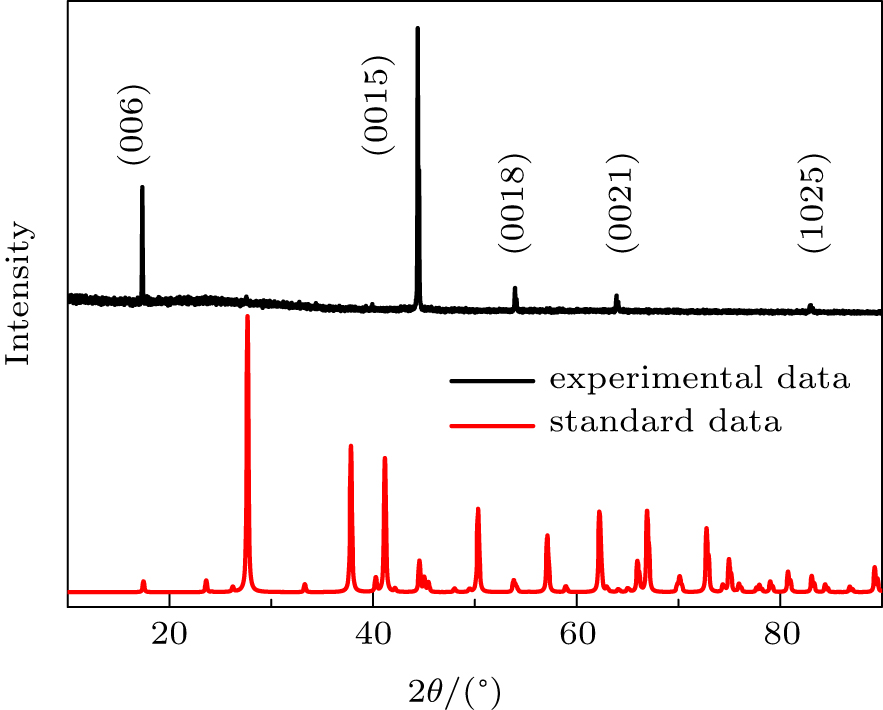
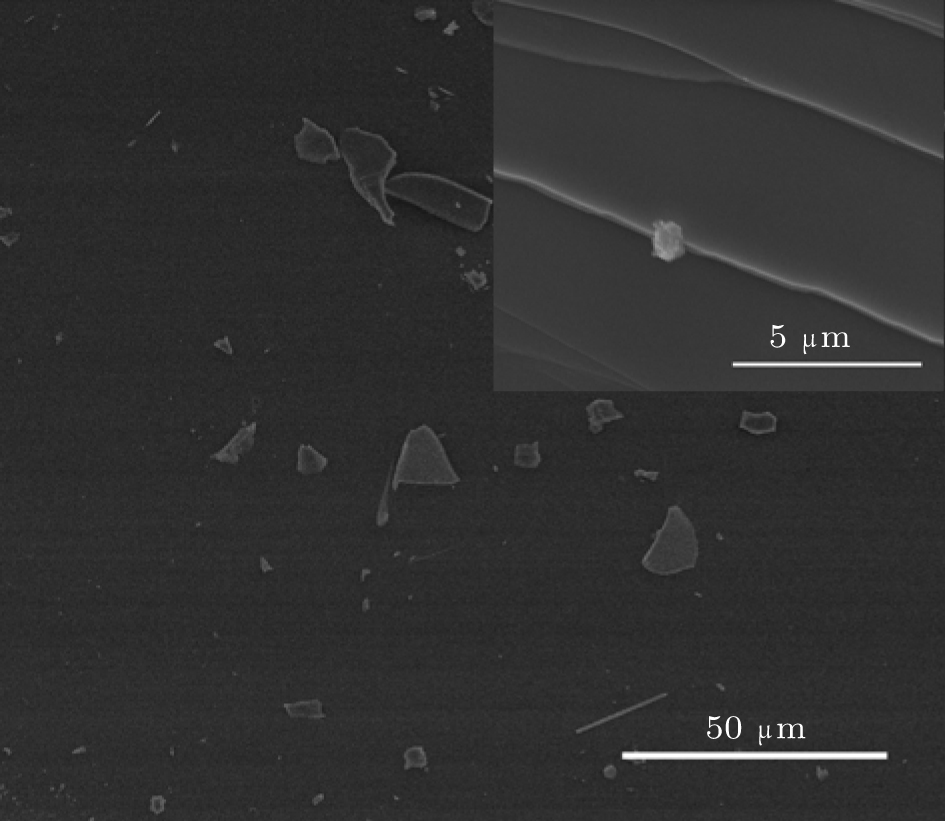
3. Results and discussionFirstly, the crystal structure and morphologies were studied for the sample synthesized inside a silica tube with an air pressure of 1.0× 10− 3 Pa. The x-ray diffraction patterns have been shown in Fig. 1. It is noted that only five peaks are observed. These XRD spectra of the sample can be indexed according to the tetradymite crystal structure with space group  .[6] These peaks can be indexed as (006), (0015), (0018), (0021), and (1025) peaks. Through comparing the standard patterns of Bi2Te3 rooted in the ICSD database[24] as seen in Fig. 1, no secondary phases were detected for the sample. In addition, these peaks are very strong and narrow, which means that a single crystal of good quality was synthesized. The sample is further characterized by the SEM measurements on the surface of a rectangle crystal with a size of 3 mm× 5 mm. The SEM images in Fig. 2 show the morphologies of the Bi2Te3 single crystal. Most obviously, the sample has a very smooth surface over 200 μ m [in Fig. 2] with a strongly layered shape on the edges, as seen in the inset of Fig. 2. It can be concluded that high quality single crystals of Bi2Te3 were synthesized in a high vacuum environment. The growth of single crystal is too little influenced by the extremely small amount of oxygen.
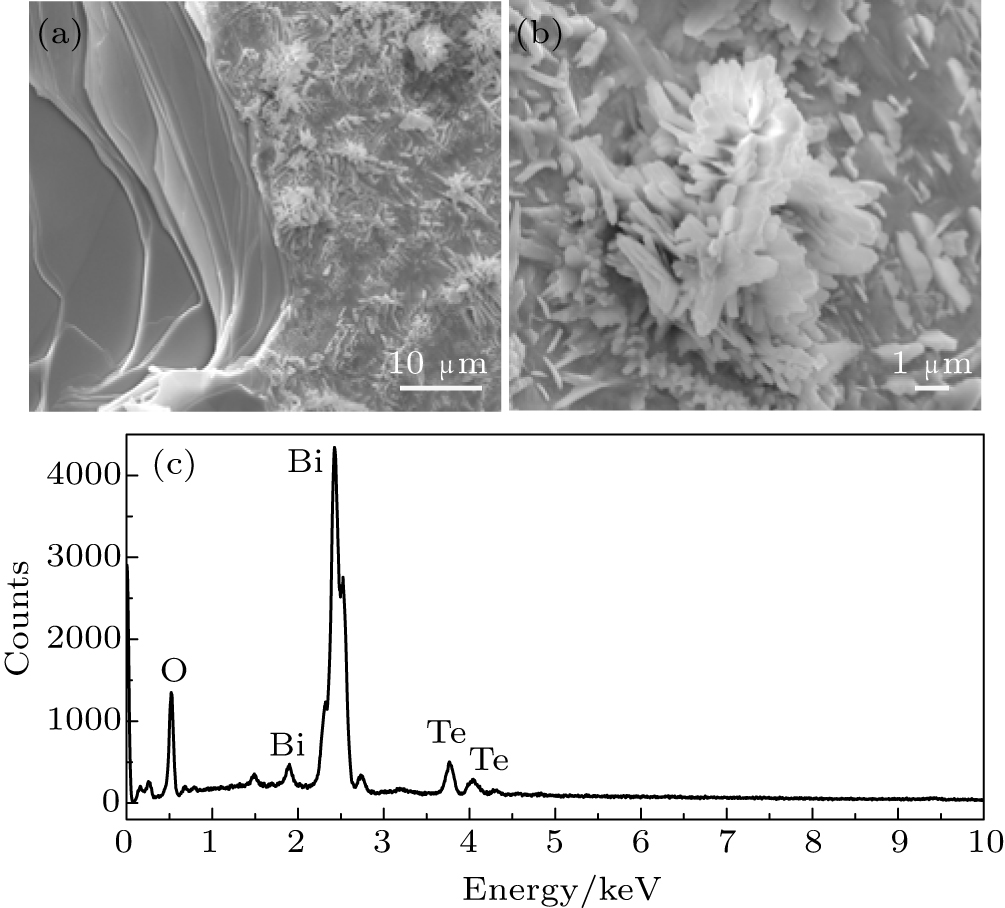
The XRD patterns for samples prepared at 1.0 × 10− 2 Pa (not shown) are similar to the patterns for samples prepared at 1.0× 10− 3 Pa, which can also be indexed by sharp (00L) reflections. The layer structure with a plate-like morphology can be observed using SEM in Fig. 3(a) when the surface layer of the samples was stripped. It indicates that the samples prepared at 1.0× 10− 2 Pa are single crystals of Bi2Te3 with good quality. However, the obvious difference of surface morphology is exhibited through SEM images for samples prepared at 1.0 × 10− 2 Pa, comparing the smooth surface for samples prepared at 1.0 × 10− 3 Pa. Figure 3(a) shows that the surface of the samples prepared at 1.0 × 10− 2 Pa consists of micron-sized nanorods and flower-like clusters. The flower-like clusters are amplified as shown in Fig. 3(b). Each micron-sized flower-like cluster is composed of irregular flakes of several hundred nanometers in size. EDS spectroscopy analysis shown in Fig. 3(c) indicates that the flower-like clusters are composed of bismuth, tellurium and oxygen. Considering the lowered vacuum, there is more oxygen in the evacuated quartz tube. It is reasonable that the oxide of bismuth and tellurium can be synthesized at high temperature. The exact oxide cannot be decided through XRD data because of the small amount of component of the oxide. However, it is clear that oxygen only impacts on the upper surface of the sample and a single crystal of good quality was still synthesized in the internal of the products.
As the air pressure continues to rise, it was found that different phases are obtained. As shown in Fig. 4(b), from the macroscopic view the bottom morphology of the obtained product is similar to silver-colored Bi2Te3 single crystal, while on the upper surface the product covers uneven yellow substances in Fig. 4(c). The different positions of the products’ bottom were characterized using x-ray diffraction analysis. It was found that the XRD patterns of the silver-colored part are similar to the patterns of Bi2Te3 single crystal as shown in Fig. 1. Figure 4(a) shows the XRD patterns of the part near the edge of the bottom which included the yellow substances. The patterns revealed that there are two major phases. One is Bi2Te3 single crystal on the inner side shown in silver gray. The other is Bi2TeO5 on the outside shown in yellow. Using Bi2O3 and TeO2 as raw materials, the Bi2TeO5 compound can be synthesized by a solid state reaction at 690 ° C for 36 h in a sealed tube reported by Kang et al.[25] This preparation condition is almost similar to the one in this study. Considering the oxidation of bismuth and tellurium, as it is more likely that Bi2O3 and TeO2 are formed firstly. Then Bi2TeO5 is produced finally at high temperature in this study. It is interesting that the oxide still grows on the surface and the single crystal is located inside as the air pressure is 1.0× 10− 1 Pa.
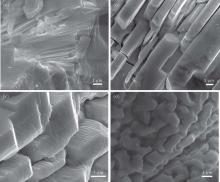
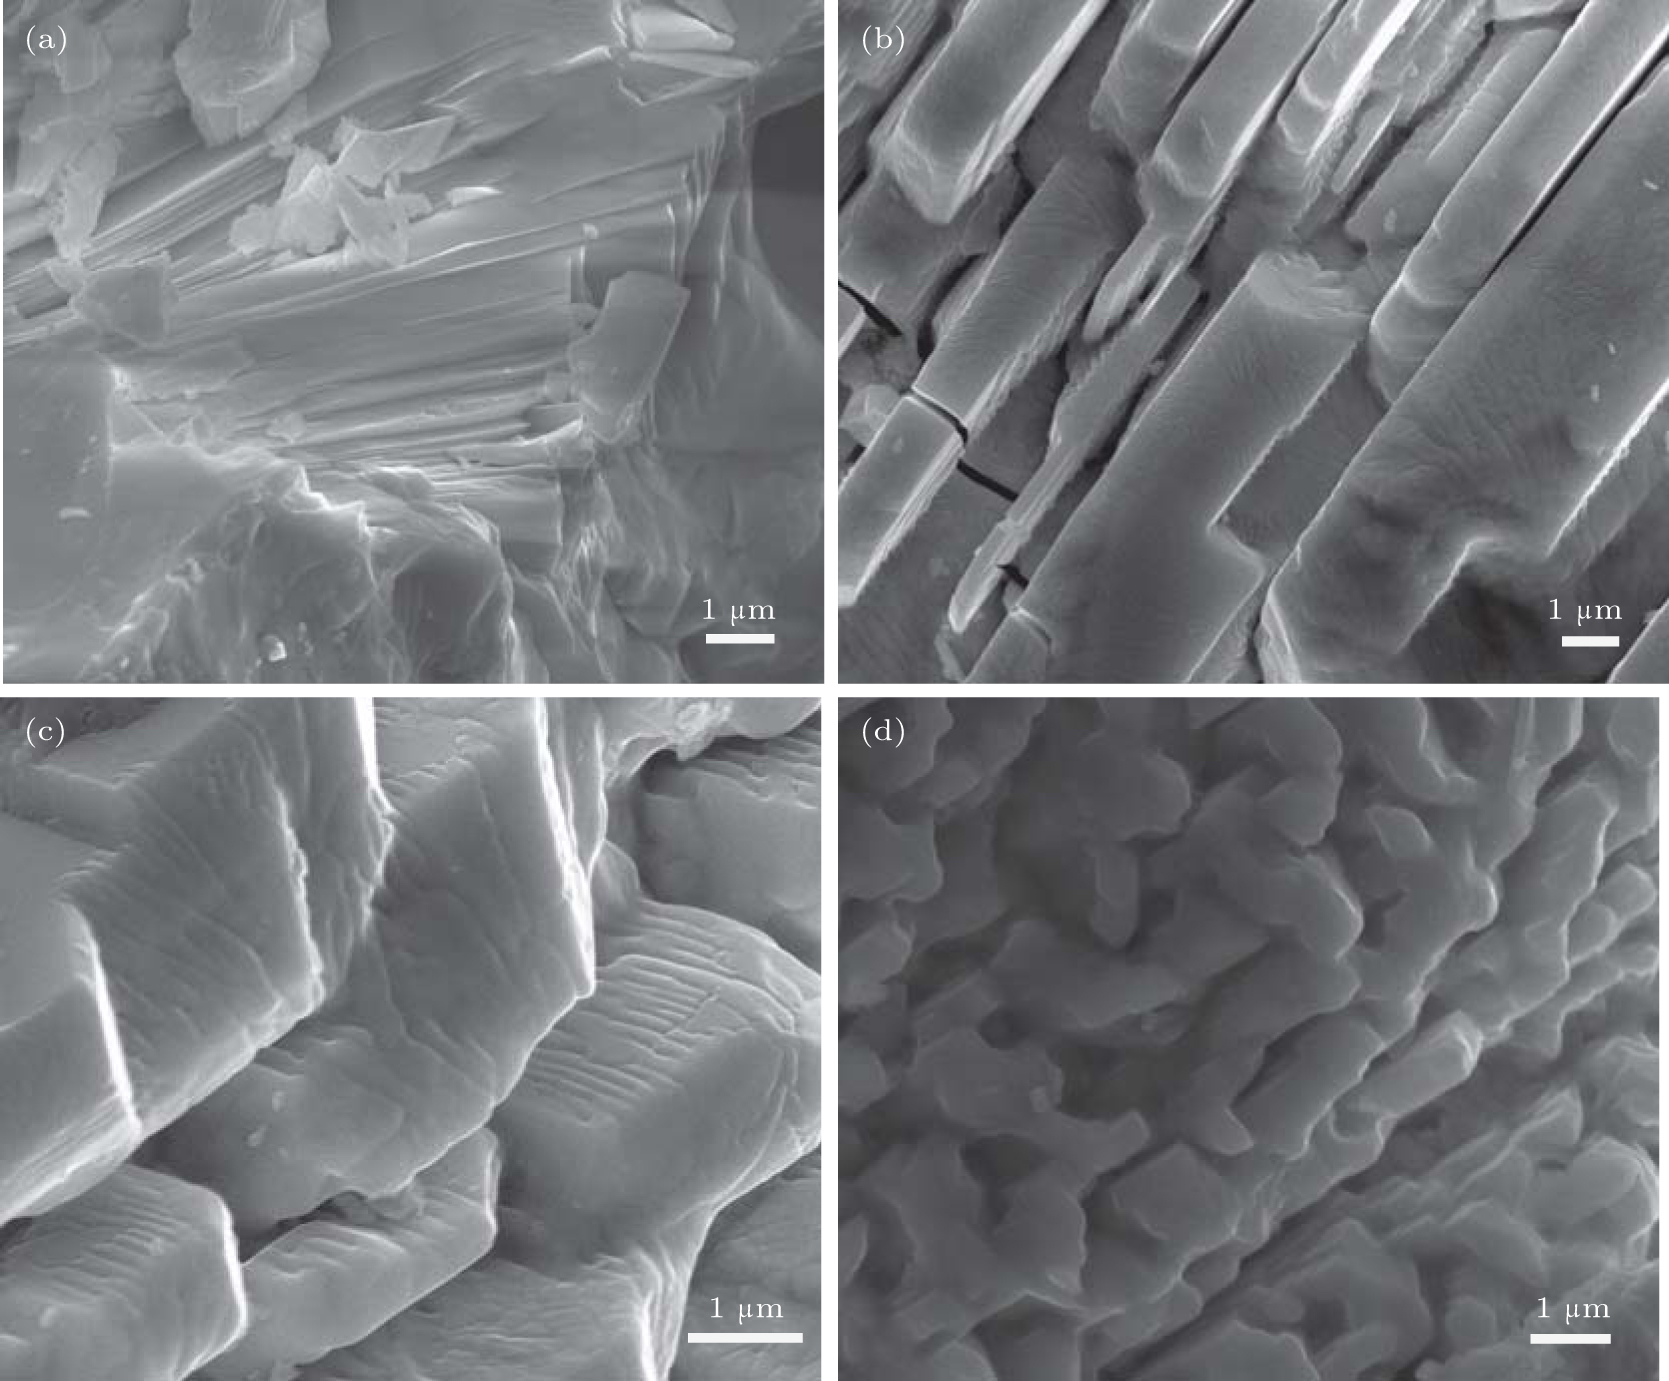
To further investigate the influence of oxygen on the crystal growth, the morphologies of the single crystal part prepared at 1.0× 10− 1 Pa were examined in detail by SEM. Figure 5 shows the morphologies of the single crystal at different positions around the boundary between Bi2Te3 and Bi2TeO5.
In general, there are three types of morphologies from inner to external, including a stair-step shape, irregular strip-shaped structure, and cuboid-like blocks. The single crystal with the size of several hundred μ m is still observed at the bottom of the sample. However, the crystal becomes smaller as the position lies near the boundary. There are a lot of flaky crystals stacked together which show a stair-step shape and different directions of crystal growth, as shown in Fig. 5(a). When the position is closer to the boundary, the irregular strip-shaped structure can be observed, as shown in Fig. 5(b). The crystals are roughly 10– 20 μ m long and 1– 3 μ m wide. In addition, there exist gaps around several μ m between the different crystals. For the nearest part of the boundary, figures 5(c) and 5(d) show the block-like Bi2Te3 crystals. The crystal size of a few μ m varies randomly near boundary region. The biggest block in Fig. 5(c) is about 3 μ m long and 1 μ m wide. The smallest block in Fig. 5(d) is about 1 μ m long and 0.5 μ m wide. In addition, streaks are observed on the surface of the big blocks.
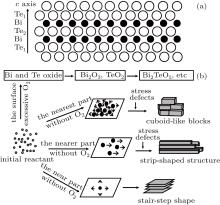
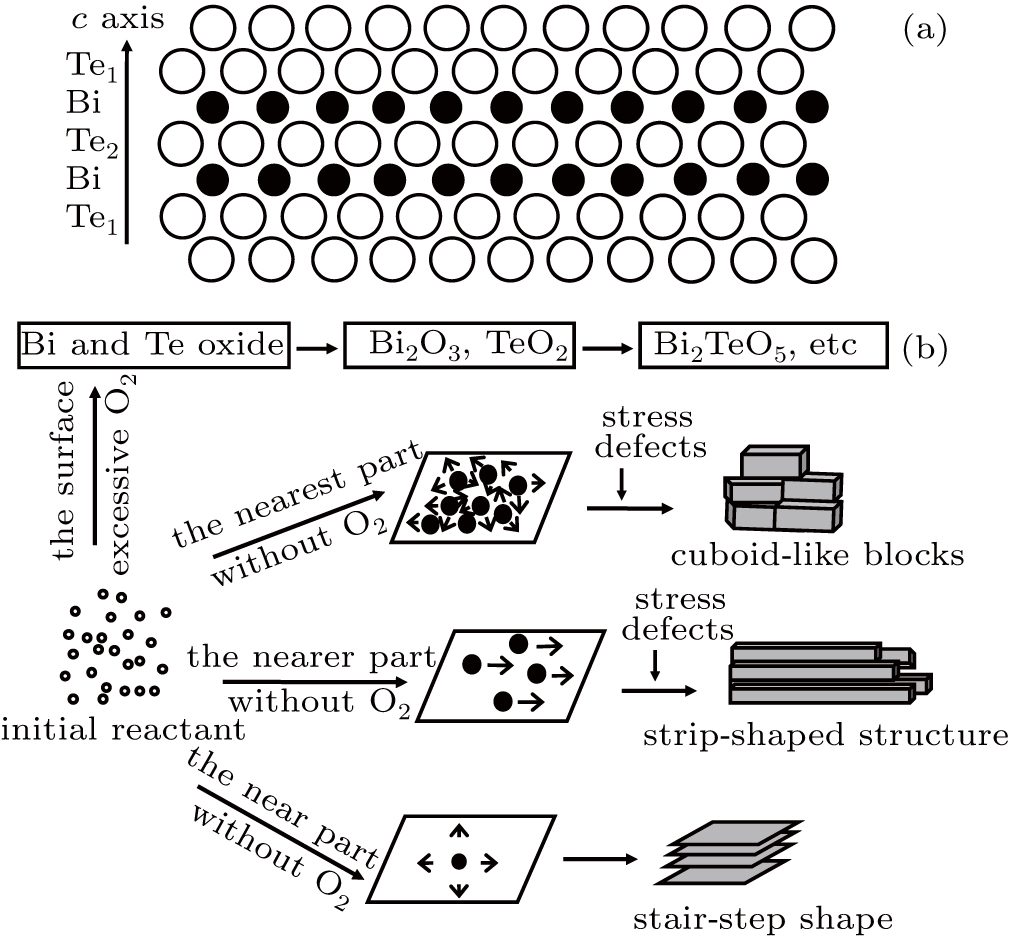
The structure of Bi2Te3 shows layered anisotropy in Fig. 6(a). Each arranged atomic planes consist of only one type of atom. There are two different types of Te layers named Te1 and Te2. The unit cell is packed with two Bi layers and three Te layers following the pattern: Te1– Bi– Te2– Bi– Te1.[5] The Bi and Te layers are joined together by ionic-covalent bonds. There are only van der Walls bonds between the neighboring Te1 planes. The covalent bond is strong and stable. The van der Waals bond is weak and fragile, so this combination is unstable.
According to the periodic bond chain (PBC) theory model, [26] a Bi2Te3 crystal will grow faster in the a or b axis direction than in the c direction, [27] leading to forming a large smooth surface morphology primarily, finally stretching long along the c axis. For samples prepared at 1.0 × 10− 3 Pa, there is almost no oxygen to affect the growth of the crystal. On the basis of the PBC theory and diffusion controlled mechanism, [28] the growth of Bi2Te3 crystal changes from 2D-growth behavior to 3D-growth behavior as the free atoms and ions concentration decrease because of the restricted container. The approximately ideal condition for growth induces big layered high quality crystals, as shown in Fig. 2. With the increase of air pressure inside a silica tube for 1.0 × 10− 2 Pa, the flower-like oxides are synthesized on the surface of the Bi2Te3 crystal. Since the air pressure is still very low, the component of oxide is small. The millimeter-size Bi2Te3 crystal is obtained with no influence of the oxide attached on its surface. However, the air pressure of 1.0 × 10− 1 Pa largely changes the condition for crystal growth, under which Bi2Te3 is covered by the oxide shell of Bi2 TeO5. This shell induces strain, holes and defects for the growing environment of Bi2Te3 crystal, especially for the part near the boundary between Bi2Te3 and Bi2TeO5, as shown in Fig. 6(b). The Bi2Te3 part is more near Bi2TeO5, the influence of these external factors on the growth is stronger, and there exists more unordered crystal nuclei. Thus, these factors might change the growth rates along the different axis directions and play a negative role in the growth of Bi2Te3 single crystal with big size and good quality.
4. ConclusionIn this study, we have shown the influence of the vacuum on the growth of Bi2Te3 crystals. The millimeter-size Bi2Te3 single crystals with good quality were obtained by the solid-state reaction method as the air pressure is 1.0 × 10− 3 Pa in the silica tube. The air pressure of 1.0 × 10− 2 Pa brings on a small amount of Bi– Te oxide on the surface of Bi2Te3 crystal. It is noted that major phase Bi2Te3 is covered by a thick Bi2TeO5 yellow shell for the air pressure of 1.0 × 10− 1 Pa. Bi2Te3 exhibits several morphologies near the boundary between Bi2Te3 and Bi2TeO5, such as cuboid-like blocks, strip-shaped structure, and stair-step shape. Therefore, we may safely draw the conclusion that the synthesis of pure Bi2Te3 bulk single crystals with a large size and high quality demand a high vacuum of less than 1.0 × 10− 3 Pa.


 , Zhao Wen-Juan, Zhu Hua-Qiang, Huang Yong-Chao, Cao Wei-Wei, Yang Qian, Yao Xiao-Yan, Zhai Ya, Dong Shuai]