

Equivalent circuit model including magnetic and thermo sources for the thermo–magneto–electric coupling effect in magnetoelectric laminates
[Cui Xiao-Le, Zhou Hao-Miao† ]
]
]
|
|


†Corresponding author. E-mail: zhouhm@cjlu.edu.cn
*Project supported by the National Natural Science Foundation of China (Grant Nos. 11172285 and 11472259) and the Natural Science Foundation of Zhejiang Province, China (Grant No. LR13A020002).
The nonlinear thermo–magneto–mechanical magnetostrictive constitutive and the linear thermo–mechanical-electric piezoelectric constitutive are adopted in this paper. The bias magnetic field and ambient temperature are equivalent to a magnetic source and a thermo source, respectively. An equivalent circuit, which contains a magnetic source and a thermo source at the input, for the thermo–magneto–electric coupling effect in magnetoelectric (ME) laminates, is established. The theoretical models of the output voltage and static ME coefficient for ME laminates can be derived from this equivalent circuit model. The predicted static ME coefficient versus temperature curves are in excellent agreement with the experimental data available both qualitatively and quantitatively. It confirms the validity of the proposed model. Then the models are adopted to predict variations in the output voltages and ME coefficients in the laminates under different ambient temperatures, bias magnetic fields, and the volume ratios of magnetostrictive phases. This shows that the output voltage increases with both increasing temperature and increasing volume ratio of magnetostrictive phases; the ME coefficient decreases with increasing temperature; the ME coefficient shows an initial sharp increase and then decreases slowly with the increase in the bias magnetic field, and there is an optimum volume ratio of magnetostrictive phases that maximize the ME coefficient. This paper can not only provide a new idea for the study of the thermo–magneto–electric coupling characteristics of ME laminates, but also provide a theoretical basis for the design and application of ME laminates, operating under different sensors.
The magnetoelectric (ME) effect is defined as a polarization response to an applied magnetic field (i.e., the direct ME effect), or a magnetization response to an applied electric field (i.e., the converse ME effect). The ME effect of the ME laminates, which are composed of the giant magnetostrictive materials and the piezoelectric materials, is a “ multiplication effect” of the magnetostrictive effect and the piezoelectric effect.[1– 3] The ME laminates have drawn attention for use in ME sensors, current– voltage converters, voltage transformers, energy harvesters, and other multi-functional devices, owing to their strong ME coupling effect.[4– 10]
Currently, in the theoretical studies on the magneto– mechanical– electric coupling effect in ME laminates, typical methods include Green’ s function method, [11, 12] the elastic mechanics method, [13– 16] the finite element method, [17, 18] and the equivalent circuit method.[19– 26] The equivalent circuit models, especially the models[23– 25] considering the mechanical– magneto coupling in giant magnetostrictive materials have been widely applied, since they are not only simple and intuitive, but also can reflect the nonlinear ME coupling effect. Experimental studies have shown that, the magnetostrictive strain curve and material constants of giant magnetostrictive materials and the material constants of piezoelectric materials change greatly under different temperatures.[27– 34] This leads to different characteristics of the ME coupling effect in the ME laminate which is composed of giant magnetostrictive materials and piezoelectric under different temperature conditions.[35– 37] Zhang et al.[35] measured a transverse ME coefficient in bulk polycrystalline bilayers of La0.7Sr0.3MnO3/PZT in the range from − 193 ° C to 27 ° C and found that the ME coefficient decreases with increasing temperature, when the temperature was above 0 ° C. Van et al.[36] reported the ME coupling in PZT/La0.8Sr0.2MnO3 in the low-temperature regime. Fang et al.[37] measured the ME coefficients in the range of 25– 80 ° C and found that the ME coefficients decrease with increasing temperature. However, theoretical model considering the influence of temperature on the ME coupling effect was relatively few. Only authors[38] recently took the material constants of the giant magnetostrictive materials as the functions of temperature in the equivalent circuit model for the ME laminates, and analyzed the influence of temperature on the mechanical– magneto coupling effect in the giant magnetostrictive materials and the farther effect on the magneto– mechanical– electric coupling effect. In fact, the influences of temperature on ME laminates were not only reflected in the change of material constants of the giant magnetostrictive materials. The temperature also directly affects the strain characteristics of the giant magnetostrictive materials and piezoelectric materials. Therefore, it is necessary to regard the temperature as a thermo source, and then to create an equivalent circuit model which contains both magnetic source and thermo source for ME laminates, in order to describe the influence of temperature field on the ME coupling effect more completely.
For the L– T mode (magnetized along the longitudinal direction and polarized along the direction of its thickness) tri-layer with symmetric ME laminates used in this paper, we combine the nonlinear thermo– magneto– mechanical magnetostrictive constitutive and the linear thermo– mechanical– electric piezoelectric constitutive and built an equivalent circuit model. The equivalent circuit model contains a magnetic source and a thermo source at the input, and reflects the influences of ambient temperature and magnetic field on the output voltage at the same time. Then this equivalent circuit model is used to obtain the explicit expressions of output voltage and ME coefficient. These expressions have two parts, one part is the output voltage and ME coefficient caused by the temperature, the other is the output voltage and ME coefficient caused by the magnetic field. Therefore, the equivalent circuit model can describe the thermo– magneto– mechanical– electric coupling characteristics completely. The experimental results for the influence of temperature on the ME effect are compared with the predictions under the same conditions to confirm the validity of the model. After that, the qualitative variations in the ME coefficients versus temperatures, magnetic fields, and the volume ratios of magnetostrictive phase curves for the Terfenol-D/PZT/Terfenol-D laminates are analyzed in detail.
The L– T mode of Terfenol-D/PZT/Terfenol-D laminates is showed in Fig. 1. The Terfenol-D and PZT layers have the same length (l) and width (w), but their thicknesses are tm and tp, and their cross-sectional areas are Am and Ap, respectively.
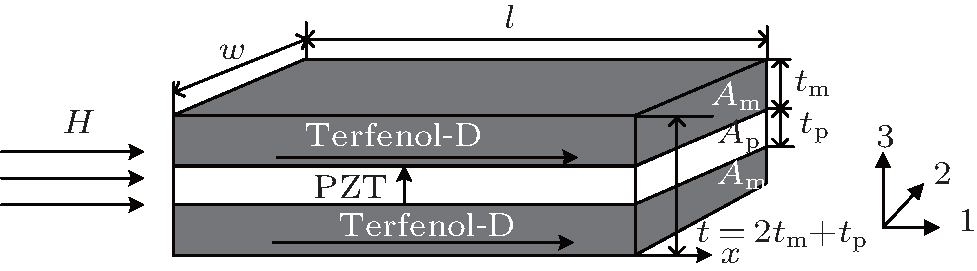 | Fig. 1. Configuration of the L– T mode magnetoelectric laminate. |
The piezoelectric layer is sandwiched between two magnetostrictive layers. When the external magnetic field (H) is parallel to the longitudinal direction, the Terfenol-D layers are magnetized along the longitudinal direction and generate a stress. This stress is transferred to the piezoelectric layer by the bonding effect, but the stress is relatively small. In this case, the piezoelectric effect on the piezoelectric layer is approximated as a linear relationship. The nonlinear ME effect of the ME laminated composite is mainly determined by the nonlinear characteristics, which are caused by temperature and stress in the Terfenol-D layers.
However, for the giant magnetostrictive material Terfenol-D, the form of the constitutive model, which takes the nonlinear thermo– magneto– mechanical coupling characteristics into consideration, is usually complex. Thus, it is inconvenient to build an equivalent circuit model. For this reason, we adopt the magnetostrictive constitutive with variable coefficients. This does not only reflect the nonlinear thermo– magneto– mechanical coupling characteristics, but also facilitate the equivalent circuit modeling

The quantities with superscript m represent the physical quantities in the magnetostrictive phase. The quantities with the subscript 1 represent the physical quantities along direction 1 in Fig. 1. 


The piezoelectric characteristics of the piezoelectric layer are easily influenced by temperature, so the constitutives of the piezoelectric layer which polarizes in the thickness direction are as follows:


where 


In our study, we assume the ME laminate is isotropic and the laminate is uniform stress everywhere. We choose a small mass unit along the x direction in the ME laminated composites. The magnetostrictive and piezoelectric layers have the same displacement (u(x)) and strain (ε (x)), where 

where Δ mm = ρ mΔ AmΔ z and Δ mp = ρ pΔ ApΔ z. The ρ m and ρ p are the densities of the magnetostrictive and piezoelectric layers, respectively. For the laminated composites shown in Fig. 1, equation (5) can be rewritten as

where 

Substituting them into Eq. (6), we can obtain

where 
We assume that the input alternating magnetic field Hac is a sine wave, so is the vibration in laminate. Then equation (7) can be simplified as 

where 

Aided by Eq. (8), equation (9) can be further simplified as
where 


Under the ME coupling, the output current of the piezoelectric layer is

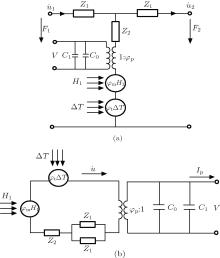
where C0 = lwε 33/tp is the static capacitance of the piezoelectric layer, and C1 = pplwΔ T/V is defined as the thermo-sensitive capacitance. Then by combining with Eq. (10), we can obtain the equivalent circuit model for the ME laminates. The surface forces, F1 and F2, are equivalent to the circuit voltages, 

 | Fig. 2. (a) Magneto– thermo– mechanical– electric equivalent circuit for ME laminates. (b) Simplified equivalent circuit under free– free boundary condition. |
At this point, we have obtained an equivalent circuit for the ME laminates. From Figs. 2(a) and 2(b) we can know, the input contains magnetic source and thermo source, the output contains a thermo-sensitive capacitance of piezoelectric layer, it directly reflects the influences of temperature and bias magnetic field on ME laminates.
Based on Fig. 2(b), the expression of ME coefficient at low frequency can be obtained. The voltage drop in Fig. 2(b) is
where

and

The value of tanh(kl/2) is ∼ kl/2 at low frequency, so the mechanical impedance is 

Substituting these parameters into Eq. (13), we can obtain
The definition of ME effect is a polarization response to an applied magnetic field. As we know, the output field[39] of ME laminate is 
At this point, we have obtained an expression of the ME field coefficient at low frequency (usually, the amplitudes of AC magnetic fields are selected as 1– 10 Oe, the frequency is 1 kHz), which is based on the constitutive relations of the magnetostrictive and piezoelectric materials and the equivalent circuit method. However, the compliance coefficient
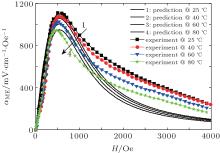
First, experimental results of Fang et al.[37] for the ME coefficient under different temperatures were chosen to verify the validity of the established nonlinear ME effect model (Eq. (15)). We set the conditions and the basic material parameters as the same as Fang et al.[37] For Tr = 0 ° C, Δ T = T for Terfenol-D. The comparisons of the ME coefficient between the measured and the predicted results are shown in Fig. 3. It could be seen that, all the curves have an initial sharp increase and then decrease slowly with the increase in bias magnetic field, and the ME coefficient decreases with the increase in the temperature. In addition, the predicted ME coefficients coincide with the experimental results quantitatively, under low and moderate magnetic fields. The predictions are in a good agreement with the experimental results both qualitatively and quantitatively. Therefore, the validity of the proposed ME coefficient could be proved.
 | Fig. 3. Comparison of ME coefficients between experimental measurements and predictions. |
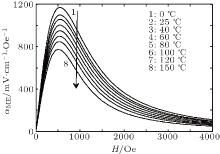
Without considering the influence of stress, and within the Curie temperatures of the magnetostrictive and piezoelectric materials, we obtain the predicted ME coefficient versus temperature curves in Fig. 4. We can see that all the curves of ME coefficients versus bias magnetic field first increase and then decrease, no matter what the temperature is, and there is an optimum bias magnetic field which could maximize the ME coefficient. The higher the temperature is, the smaller the ME coefficient is. The maximum ME coefficient decreases fastest as the temperature increases. When the temperature increases from 0 to 150 ° C, the maximum ME coefficient decreases by nearly 33.86% from 1169 to 773.2 mV/cm· Oe. Hence, to keep the ME laminates at 0 ° C will contribute to achieve a larger ME coupling. In practical applications, a semiconductor refrigeration tablet can be stuck on the surface of Terfenol-D with silica gel, which can conduct heat, so that it can effectively maintain the temperature of the magnetostrictive materials at 0 ° C to optimize the performance of ME sensors.
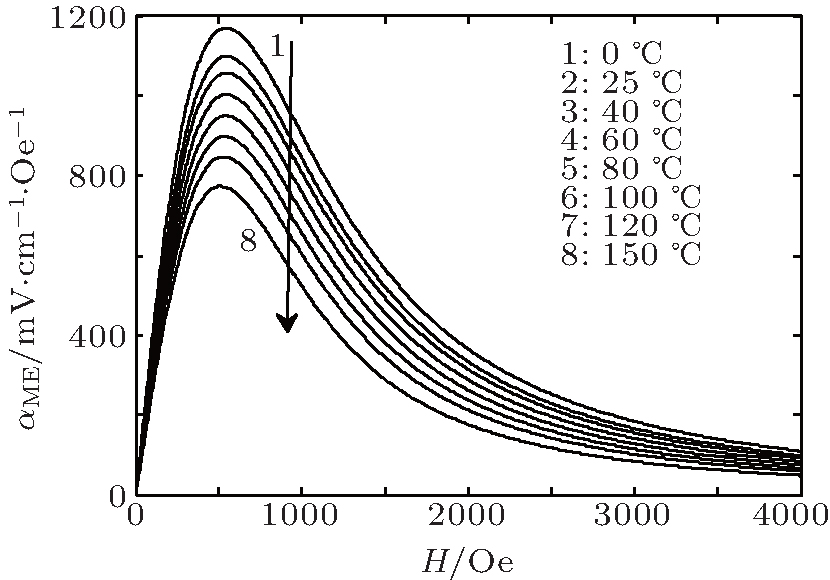 | Fig. 4. Predicted ME coefficients under different temperatures. |
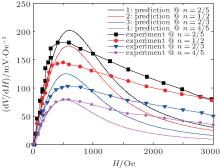
Next, the influence of the volume ratio of Terfenol-D layers on the ME coefficient is discussed. Dong et al.[22] reported some experimental results of the different volume ratios about the ME voltage coefficient (i.e., α MV = ∂ V/∂ H). Therefore, we degenerate the ME coefficient (i.e., ME electric field coefficient, α ME = ∂ E3/∂ H1) into the ME voltage coefficients, which is consistent with the experimental results in Ref. [22], and set the basic material parameters the same as their experiment. Thus, we can compare the predicted results and the experimental results. As shown in Fig. 5, the predicted results and the experimental results have a qualitative agreement, and both of them decrease with the increasing volume ratio of the magnetostriction materials. Compared with Fang’ s test results in Fig. 3, Dong’ s experimental results are more flatter under high magnetic fields. Thus the predicted ME coefficients versus bias magnetic fields curves in this paper are closer to Fang’ s experimental results.
 | Fig. 5. Comparison of ME voltage coefficients between experimental measurements and predictions under different volume ratios of Terfenol-D layers. |
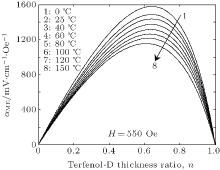
Figure 6 shows the influence of the different volume ratios of the Terfenol-D on the ME electric field coefficient when the ambient temperature is 30 ° C. From Fig. 5, the varied volume ratio does not affect the qualitative trends of the ME coefficient with the bias magnetic fields. However, from quantitative view, the ME coefficient increases firstly and then decreases with the increasing volume ratios. There exists an optimum volume ratio which could maximize the ME coefficient. In the figure, the ME coefficient reaches the maximum when the volume ratio is 5/7. Therefore, we should select an appropriate volume ratio to achieve the maximum ME coefficient during the preparation of ME sensors. In order to reflect the situation more clearly that the ME electric filed coefficient changes with the volume ratio of the magnetostrictive materials, we predict the ME electric field coefficient versus the volume ratios under different temperatures (see Fig. 7). All of the ME coefficients reach the maximum when the volume ratios are approximately equal to 0.65 under different temperatures. Combining Figs. 4, 6, and 7, when the ME laminates were used to prepare ME sensors, we should select the laminates which have an appropriate volume ratio of the magnetostrictive materials and keep the ambient temperature of the laminate at 0 ° C to achieve a large ME coupling.
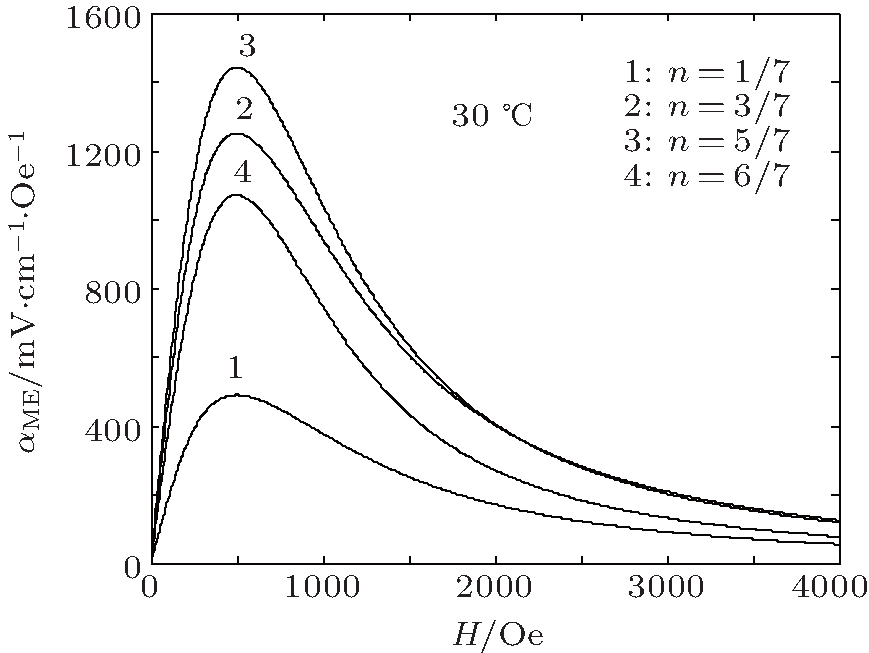 | Fig. 6. Predicted ME coefficients under different volume ratios of Terfenol-D layers. |
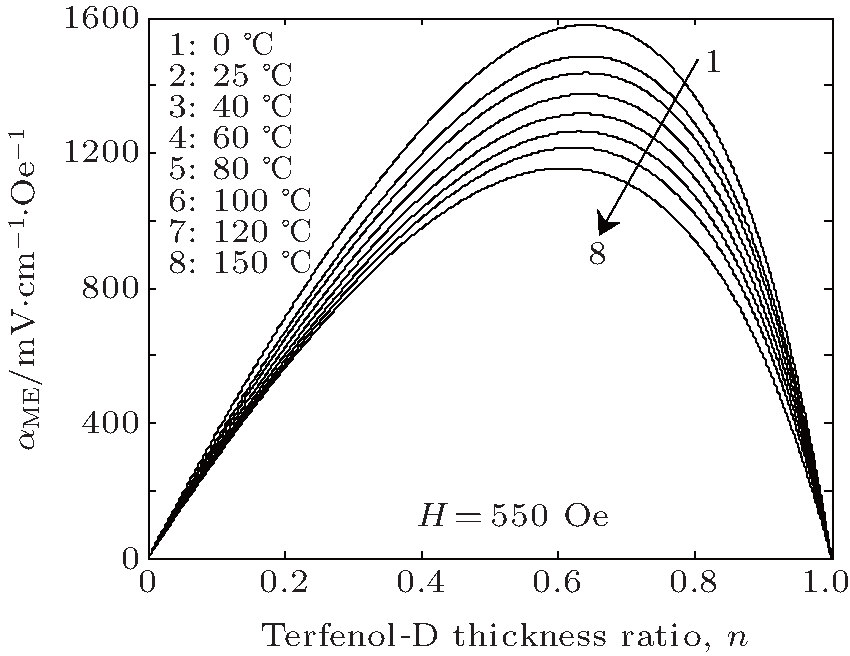 | Fig. 7. Predicted ME coefficients versus the volume ratio of Terfenol-D layers under different temperatures. |
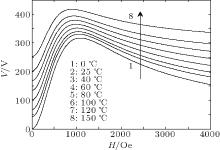
Without considering the influence of stress, the output voltages versus bias magnetic field curves under different temperatures are shown in Fig. 8. The output voltage first increases and then decreases with the increase in the bias magnetic field, and there is an optimum bias magnetic field which could maximize the output voltage. Meanwhile, the output voltage increases with increasing temperature. When the input bias magnetic field is 0 Oe, the ME laminates also could generate an output voltage when the ambient temperature is above 0 ° C. For example, the output voltage is 42 V when the temperature is 25 ° C, and the output voltage is 168.4 V when the temperature is 100 ° C. Therefore, we can find that the ME laminates could generate output voltage when the ME laminates are set in variable temperature environments or are applied some bias magnetic fields. That is to say, the ME laminates can achieve the characteristics that both the temperature sensors and the magnetic field sensors have. Increasing ambient temperature and applying a certain bias magnetic field will help to improve the amplitude of the output voltage.
 | Fig. 8. Output voltage under different temperatures. |
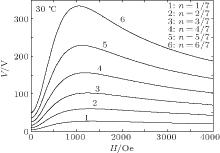
The influences of the volume ratio of Terfenol-D layers on the output voltage at the temperature of 30 ° C are shown in Fig. 9. We could see that temperature variations do not affect the qualitative trends of the output voltage curves. However, from a quantitative point of view, the output voltage increases with the increase in the volume ratio, and there is an optimum volume ratio which could maximize the output voltage. When the ratio increases from 1/7 to 6/7, the maximum output voltage increases nearly 307.33 V from 26.64 V to 334 V. While the bias magnetic field is 0 Oe, the output voltage is only influenced by the temperature, and the output voltage increases 47.36 V from 3.9 V to 51.26 V. Hence, we could increase the volume ratio of Terfenol-D layers to increase the output voltage. From the above analysis of Figs. 8 and 9, when the ambient temperature is above 0 ° C, the temperature could affect the output voltage, and applying an appropriate bias magnetic field could reach the maximum output voltage. We also find that, the bigger the volume ratio of the giant magnetostrictive materials, the bigger the output voltage. Therefore, when the ME laminates are used to prepare temperature sensors or magnetic sensors, we can apply a certain bias magnetic field or increase the temperature to achieve a large output voltage.
 | Fig. 9. Output voltage under different volume ratios of Terfenol-D layers. |
In this paper, we adopted the linear thermo– mechanical– electric piezoelectric constitutive and the nonlinear thermo– magneto– mechanical magnetostrictive constitutive to build an equivalent circuit model which has both magnetic source and thermo source at the input for the L– T mode ME laminates. Then based on the equivalent circuit model, we obtain the expressions of the output voltage and the ME coefficient. The predictions with this model show that, when the ME laminates are used to prepare temperature sensors, increasing the temperature or the volume ratio of Terfenol-D layers and applying an appropriate bias magnetic field would increase the output voltage; when the ME laminates are used to prepare magnetic sensors, there is an optimum magnetic field which could maximize the output voltage, and increasing the temperature or the volume ratio of Terfenol-D layers would make the output voltage further increase; when the ME laminates are used in ME sensors, we care about the value of the ME coefficient, so lowering the temperature and choosing an appropriate volume ratio would contribute to maximize the ME coupling. The equivalent circuit model proposed in this paper could show the influence of temperature on the output voltage and the ME coefficient simply and intuitively. It could not only provide a new idea for the study of the thermo– magneto– electric coupling effect in ME laminates, but also provide a theoretical basis for the applications of ME devices.
| 1 |
|
| 2 |
|
| 3 |
|
| 4 |
|
| 5 |
|
| 6 |
|
| 7 |
|
| 8 |
|
| 9 |
|
| 10 |
|
| 11 |
|
| 12 |
|
| 13 |
|
| 14 |
|
| 15 |
|
| 16 |
|
| 17 |
|
| 18 |
|
| 19 |
|
| 20 |
|
| 21 |
|
| 22 |
|
| 23 |
|
| 24 |
|
| 25 |
|
| 26 |
|
| 27 |
|
| 28 |
|
| 29 |
|
| 30 |
|
| 31 |
|
| 32 |
|
| 33 |
|
| 34 |
|
| 35 |
|
| 36 |
|
| 37 |
|
| 38 |
|
| 39 |
|