Optimal migration path of Ag in HfO2: A first-principles study*
[Dai Yue-Hua†a)  , Chen Zhen
a) , Jin Boa) , Li Ninga) , Li Xiao-Fengb) ]
, Chen Zhen|
|


†Corresponding author. E-mail: daiyuehua2013@163.com
*Project supported by the National Natural Science Foundation of China (Grant No. 61376106).
First-principles calculations are used to investigate the migration path of Ag in the HfO2-based resistive random access memory (ReRAM). The formation energy calculation suggests that there are two different sites (site 1 and site 3) for the incorporation of Ag atoms into the HfO2 unit cell. Thermodynamic analysis shows that the motion of Ag atom in the HfO2 supercell appears to be anisotropic, which is due to the fact that the Ag atom at site 3 moves along the
Solid-electrolyte-based resistive random switching memory (ReRAM) based on transition metal oxides (TMOs), also known as electrochemical metallization (ECM) cells, is a very attractive candidate to replace flash memory due to its simple metal– insulator– metal (MIM) sandwich structure, [1] high density, long retention time, excellent scalability, low power consumption, [2– 5] and compatibility with CMOS technology. Among a wide variety of TMOs[6– 19] (HfO2, ZrO2, SiO2, TiO2, Ta2O5, etc.) that have been proposed thus far, HfO2 is particularly attractive due to its possible role in replacing silicon dioxide as the gate dielectric in a CMOS logic transistor and also due to its good resistive switching (RS) capability.[7– 9] Generally, the ECM device consists of a thin film of solid electrolyte (‘ I’ ), an active electrode(such as Ag, Cu, or Ni), and an inert electrode(such as Pt, W, or Au). When a positive voltage is applied to the active electrode (e.g., Ag), Ag+ ions are generated and will migrate onto the inert electrode, and then they will be reduced into Ag atoms on the surface of the inert electrode. CFs will grow from the cathode toward the anode. Vice versa, the CF will be dissolved due to oxidation when a voltage of opposite polarity is applied.[10] It is widely accepted that electrochemical metallization is the main mechanism that is responsible for the formation and rupture of conducting filaments (CFs).[11– 13] However, the ReRAM devices often show a large fluctuation in switching voltages due to the random growth or rupture of the CFs.[14] More recently, the study of defect migration path has aroused the considerable interest of researchers. Knowledge of the migration orientation in advance is an effective way to improve characteristics of ReRAM. For example, the operation voltage can be lowered along the optimized orientation and reduce power consumption. Wang et al.[15] have investigated the optimal migration pathway of oxygen vacancies in TiO2 by using the nudged elastic band method. Zhu et al.[16] have studied the diffusion path of oxygen vacancies in TiO2 by using the nudged elastic band method. As described by Tingkun Gu’ s model, the conductive path in Cu-based Ta2O5 along [001] orientation has been observed by studying the isosurface plot of the partial charge density.[17] Lu et al.[18] discussed the optimal migration path of Cu in HfO2 along the [001] direction, which is helpful for reducing power consumption in HfO2 based ReRAM. Liu et al.[19] have observed a conductive filament in Ag-based SiO2 within the (111) plane by using transmission electron microscopy (TEM). At the same time, most experiments have confirmed that metal conductive filaments form by the Ag atom.[20, 21] However, there is no thorough understanding of the optimal filament direction of Ag-related metal dopants in the resistive switching material.
In reality, considering the experimental limitations such as producing cost and manufacturing time, software simulation and different methods for theoretical analysis are used to explore the performance parameters such as oscillating orientation and migrating direction of Ag atoms in HfO2-based ReRAM on a nanoscale. In this paper, we theoretically investigate the migration path of Ag in HfO2-based ReRAM device by employing first-principles theory. Firstly, with three analytical tools (molecular dynamic simulations, migration barriers and population analysis), the dominant motion of the Ag atom (at sites 1 and 3) in HfO2 supercells is studied. Subsequently, the optimal long-arrange migration path of Ag in HfO2 supercells is also investigated.
The CASTEP code[22] with Vanderbilt ultrasoft pseudopotentials is used to perform all the calculations apart from those determining migration barriers. The Perdew Burke Ernzerhof generalized gradient approximation (GGA-PBE)[23] is used to describe the electronic exchange-correlation potential. After the energy convergence test, the plane-wave cutoff energy is set to be 400 eV, and a grid of 2× 2× 2 Monkhorst– Pack k-piont is used for Brillouin zone integrations. The valence electrons are assumed to have 2s22p4configuration (O), 5d26s2 configuration (Hf), and 4d105s1 configuration (Ag). Monoclinic HfO2[24] is used with the lattice parameters of a = 5.117 Å , b = 5.1754 Å , and c = 5.2915 Å . The supercell geometries are fully relaxed until atomic forces are smaller than 0.03 eV/Å , while the lattice vectors of supercells are fixed during geometry optimization. The molecular dynamics calculations[25, 26] are performed with a simulation at room temperature of 300 K. A Nosé thermostat and no pressure are adopted. The total simulation time is 5 ps in time steps of 1 fs, leading to a total number of steps of 5000. The first 2.5-ps time is used in order to reach system balance, and the following 2.5-ps time is used to obtain statistical position coordinates of the Ag atom. The model in this work utilizes periodic boundary condition (PBC) in order to ensure that the system does not have an abrupt border with a vacuum. In order to consider the influences of temperature and pressure on ion diffusion, the NPT ensemble is used, and the periodic Ag images are over 5 Å away from each other. This reduces the Coulomb interaction between images of the Ag in different periodic cells.
The DMol3 code[27, 28] with a complete-LST/QST search protocol is used in order to calculate migration barrier of the Ag atom in supercell. The position corresponding to the highest point of energy (i.e., the transition site) can be obtained by calculating the migration energy, which can directly reflect the degree of difficulty of Ag migration. This is an approach used successfully in previous studies on cation migration in complex oxides.[15, 16, 29, 30]
In order to qualitatively measure the strength of covalent bonding between atoms, the overlap population between atoms is calculated by Mulliken’ s population analysis method.[31] In Mulliken analysis, the charge Q(A) associated with a given atom A, and bond overlap population n(AB) between A and B atoms are defined respectively as
where Pμ ν (k) and Sμ ν (k) are the density matrix and the overlap matrix, respectively, and Wk is the weight associated with the calculated k-point in the Brillouin zone. The n(AB) can be used to assess the covalent strength of a bond. A value of zero indicates a perfectly ionic bond, while values greater than zero indicate increasing the levels of covalency.[32] Positive and negative values indicate bonding and antibonding states, respectively.
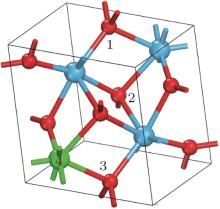
There are three possible interstitial sites (1, 2, and 3) and one possible substitutional site for Ag atom in the unit cell of HfO2 as shown in Fig. 1. It was reported by Zhou et al.[33] that the favorable site for Ag atom is the site 3 (the formation energy is 5.9 eV) and the formation energy of Ag at sites 1 and 2 are 6.53 eV and 6.6 eV, respectively. However, the calculations in this work show that the formation energies of Ag at the sites 1 and 2 are both 6.54 eV, which means the two positions are equivalent. Thus, in the following work, the properties of Ag atoms at sites 1 and 3 in HfO2 are discussed.
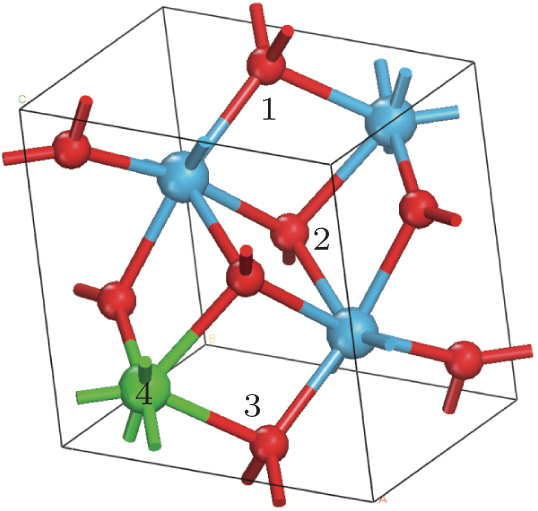 | Fig. 1. Unit cell of HfO2. The numbers 1, 2, and 3 represent the possible interstitial sites, and the number 4 refers to the possible substitutional site. The smaller balls represent O atoms, and the bigger balls denote the Hf atoms. |
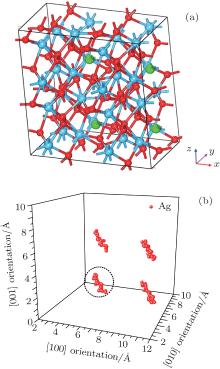
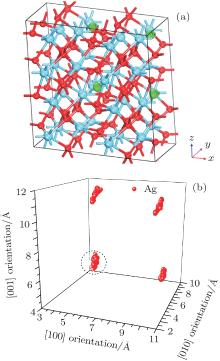
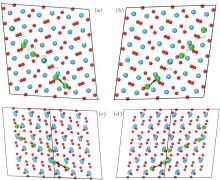
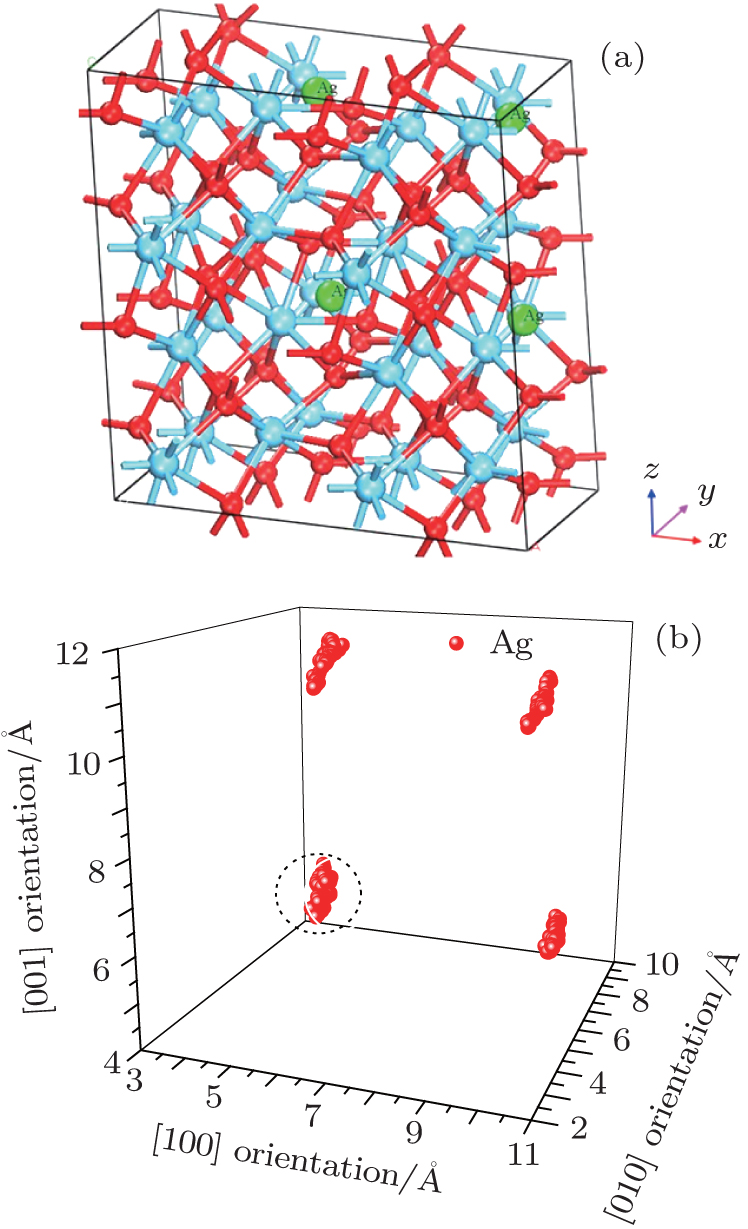
Figure 2(a) shows the supercell (2× 2× 2) model with four Ag atoms located at site 3 within four unit cells. Site 3 is set as an initial site within the simulation. The thermal motion of Ag atoms is simulated at room temperature (300 K) by using the molecular dynamics method, and the position coordinates of Ag atoms are collected for every other 50 steps, after sufficient relaxation of the structure. The results show that there is a dominant vibrating trend of Ag atoms along the 
 | Fig. 2. (a) Smaller balls represent O atoms, middling balls denote the Ag atoms and bigger balls denote the Hf atoms. A supercell (2× 2× 2) containing 100 atoms with four Ag in each of four unit cells at position 3. (b) Thermal motion position coordinates of Ag atoms at the position 3 after sufficient relaxation of the structure. A cluster refers to the corresponding thermal motion position coordinates of one Ag atom. |
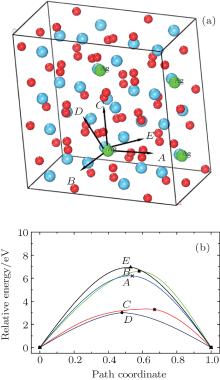
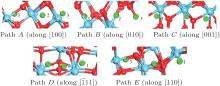
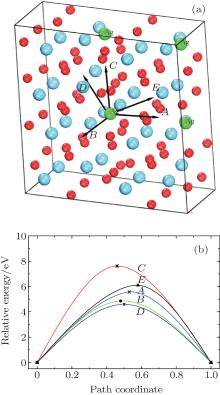
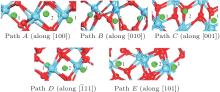
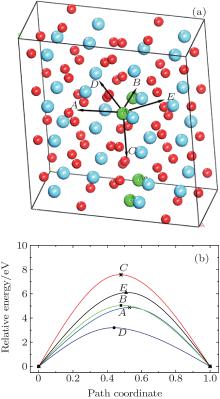
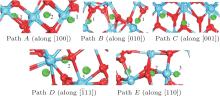
Examination of Ag atom motion in HfO2 is of vital interest when using it as the anode material in RRAM. Simulation can greatly enhance our understanding of the defect process or migration path by evaluating the activation energies. Since long-range migration of Ag is very difficult, we only discuss hoping between the nearest unit cells. Five main migration possibilities of Ag atoms at site 3 are considered within m-HfO2 (illustrated in Fig. 3(a)). Furthermore, the specific migration barriers of Ag atom along the five diffusion paths are calculated. The migration barrier profiles each as a function of path coordinate are shown in Fig. 3(b), and the transition states (saddle point) of Ag atom along these paths are also marked out (balls marked with number 2) in Fig. 4. For paths A, B, and C, the Ag atom, which is located on site 3 in the unit cell, migrates to the equivalent site 3 of another neighboring unit cell along the [100], [010], and [001] directions, respectively. For pathD and path E, the Ag atom, which is located at site 3 in the unit cell, migrates to site 1 of another neighboring unit cell along the
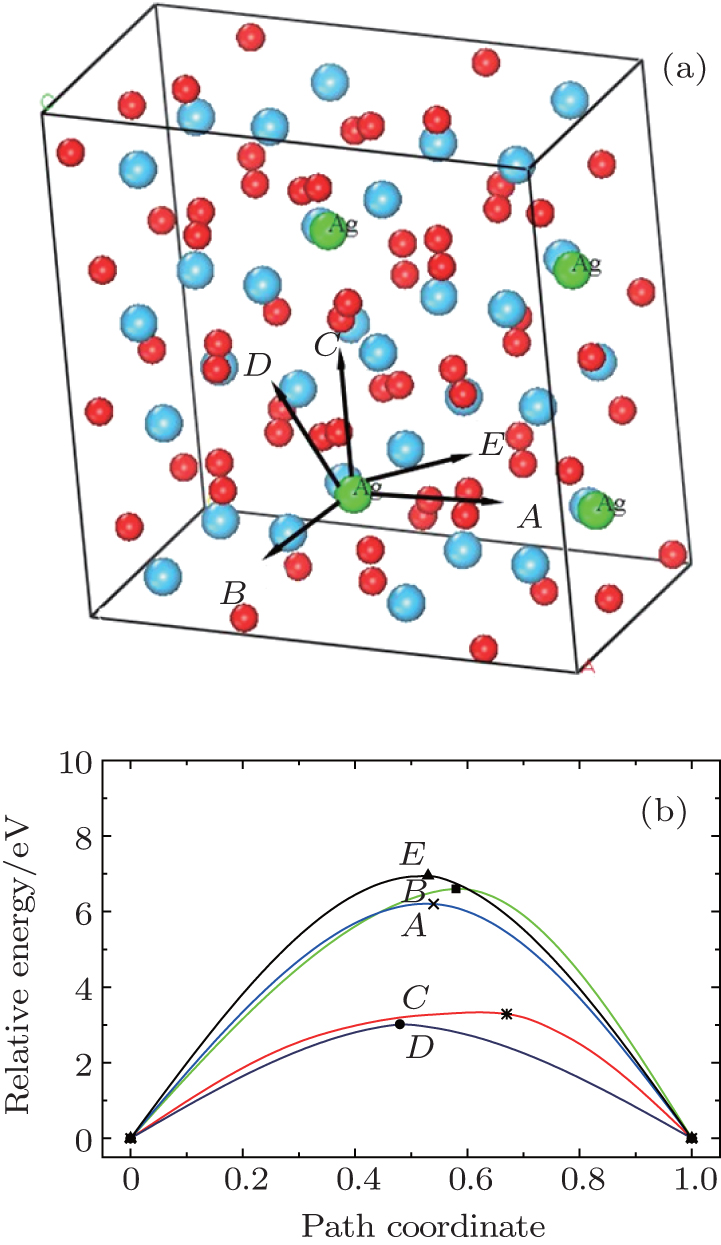 | Fig. 3. (a) Five different diffusion paths of Ag atoms (at site 3) in HfO2. Paths A, B, C, D, and E are along the [100], [010], [001], |
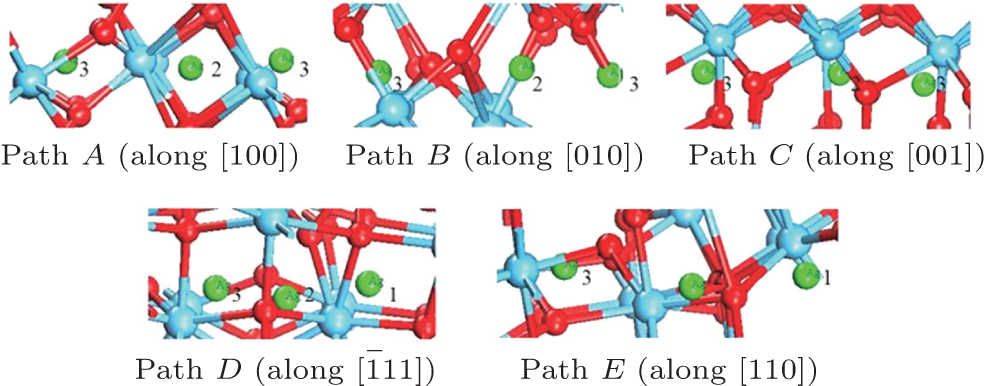 | Fig. 4. Barrier sites of Ag atoms along the five paths. Smaller balls represent O atoms, bigger balls denote the Hf atoms, and middling balls refer to the Ag atoms. For each of paths A, B, and C, site 3 on the left, site 2, and site 3 on the right are the initial site, transition site and the final site of Ag atom, respectively. For each of paths D and E, site 3 on the left, site 2, and site 1 on the right are the initial site, transition site and final site of Ag atom, respectively. |
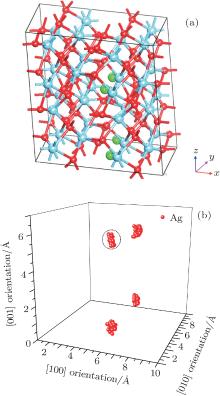
The thermodynamic analysis and migration barrier of Ag atom show that the path from site 3 to site 1 of the adjacent cell is the optimal migration path for Ag atom in HfO2. Thus an interesting question arises: which direction is best for the migration of Ag atoms at site 1. Next, the thermodynamic motion and migration barrier of Ag atom at site 1 will be discussed. A supercell (2× 2× 2) model with four Ag atoms located at site 1 in each of four unit cells is built as displayed in Fig. 5(a). The simulation method of the thermal motion is the same as that of Ag atoms at site 3. The result shows that there is a vibrating trend for Ag along the [001] direction as shown in Fig. 5(b), and the effective distance between the circled Ag atoms along this orientation is about 1.1269 Å .
 | Fig. 5. (a) Smaller balls represent O atoms, middling balls denote the Ag atoms, and bigger balls refer to Hf atoms. A supercell (2× 2× 2) containing 100 atoms with four Ag atoms in each of four unit cell at position 1. (b) The thermal motion position coordinates of Ag at the position 1 after sufficient relaxation of the structure. A cluster refers to the corresponding thermal motion position coordinates of one Ag. |
In order to further confirm the migration direction of Ag atoms at site 1, the migration barrier of Ag atom along the possible diffusion paths are calculated. As illustrated in Fig. 6(a), we also choose five main migration path candidates characterized by their corresponding migration rates of paths A, B, C, D, and E. For paths A, B, and C, the Ag atom, which is located at site 1 of the unit cell, migrates to the equivalent site 1 of another neighboring unit cell along the [100], [010], and [001] directions, respectively. For pathD, the Ag atom, which is located at site 1 in the unit cell, migrates to the symmetrical site 1 of the neighboring unit cell along the
 | Fig. 6. (a) Five different diffusion paths of Ag in HfO2. Paths A, B, C, D, and E are along the [100], [010], [001], |
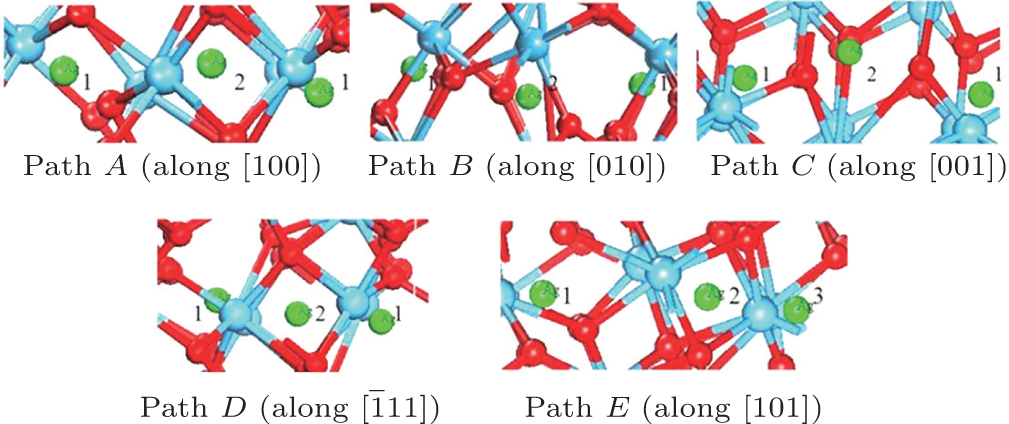 | Fig. 7. The barrier sites of Ag atom along the five paths. Smaller balls represent O atoms, bigger balls denote the Hf atoms and middling balls refer to the Ag atoms. For each of paths A, B, C, and D, site 1 on the left, site 2, and site 1 on the right are the initial site, transition site and final site of Ag atom, respectively. For path E, site 1 on the left, site 2, and site 3 on the right are the initial site, transition site and final site of Ag atom, respectively. |
However, the thermodynamic analysis shows that Ag atoms tend to move along the [001] path, which is in disagreement with the migration barrier calculations. The final motion direction is perhaps further affected by the diverse electron distributions and interactions between the Ag atom and other atoms when the Ag atom can go as far as possible. As presented in the following section, the population analysis indicates that it will be more favorable for Ag atoms to migrate along the
 | Fig. 8. Smaller balls represent the O atoms, middling balls denote the Ag atoms, and bigger balls refer to the Hf atoms. (a) A supercell (2× 2× 2) containing 100 atoms with four Ag atoms in each of four unit cell at the symmetrical site 1. (b) The thermal motion position coordinates of Ag atom at the position 1 after sufficient relaxation of the structure. A cluster refers to the corresponding thermal motion position coordinates of one Ag. |
The further movement direction of Ag at the symmetric site 1 is also investigated. Figure 8(a) shows the built supercell (2× 2× 2) model with four Ag atoms located at the symmetric site 1 in each of four unit cells. The simulation method is the same as that for Ag atoms at site 3. The result shows that there is a vibrating trend for Ag atom, which is along the [001] direction as displayed in Fig. 8(b), and the effective distance between the circled Ag along this orientation is about 0.8529 Å .
The migration barriers of Ag atom along possible diffusion paths are calculated. As illustrated in Fig. 9(a), we also choose five main migration path candidates characterized by their corresponding migration rates for paths A, B, C, D and E. For paths A, B, and C, the Ag atom, which is located at site 1 in the unit cell, migrates to the equivalent site 1 of another neighboring unit cell along the [100], [010], and [001] directions, respectively. For pathD, the Ag atom, which is located at site 1 in the unit cell, migrates to site 3 of the neighboring unit cell along the
 | Fig. 9. (a) Five different diffusion paths of Ag in HfO2. Paths A, B, C, D, and E are along the [100], [010], [001], |
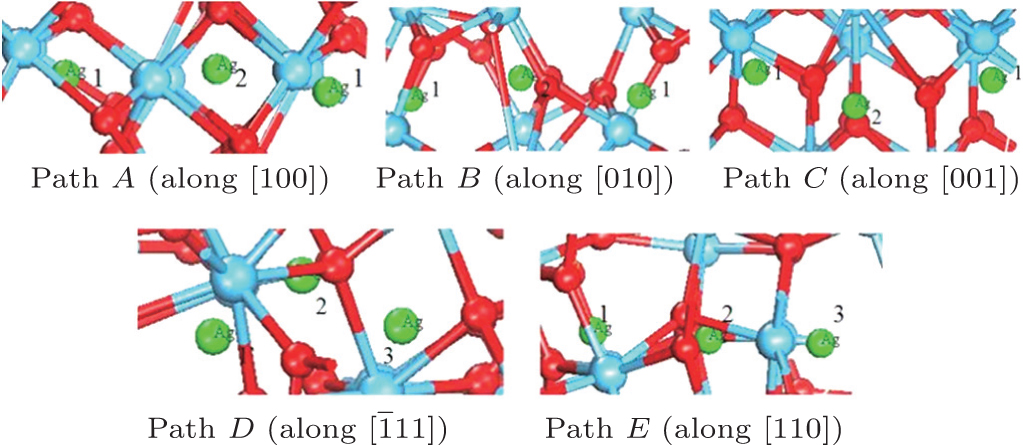 | Fig. 10. Barrier sites of Ag atom along the five paths. Smaller balls represent the O atoms, bigger balls denote the Hf atoms, and middling balls refer to the Ag atoms. For each of paths A, B, and C, the site 1 on the left, site 2, and site 1 on the right are the initial site, transition site, and final site of Ag atom, respectively. For each of paths D and E, site 1 on the left, site 2, and site 3 on the right are the initial site, transition site, and final site of Ag atom, respectively. |
Furthermore, we calculate the overlap population values between Ag atom and its surrounding atoms of the above three migration steps in transition states in five diffusion paths. The results are shown in Table 1. The S3 (site 3) → Sfin represents that the Ag atom migrate from initial site 3 to final site, and a similar meaning can be applied to SS1 (symmetrical site 1) → Sfin and S1 (site 1) → Sfin. The calculated average overlap population values of Ag– Hf bonds of the transition states are negative, revealing that an anti-bonding characteristic is induced between Ag and Hf shells. Thus, a great deal of attention has been paid to the characteristic of bonding in this work, and the overlap population between Ag– O bonds is only discussed. It can be seen that the average overlap population values of Ag– O show relatively low values in three different cases: S3 → Sfin with an overlap population value of 0.02 (along the
| Table 1. Population analyses of Ag– O bonds of the transition states along [100], [010], [001], |
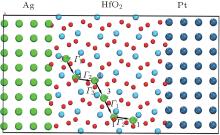
The lowest-energy pathway for long-range diffusion is obtained through analyses of thermodynamic calculations, the migration barriers, and the bond overlap populations. The diffusion loop path Γ 1 → Γ 2 → Γ 3 → Γ 1 for Ag atoms are marked as shown in Fig. 11. Migration paths from site 3 to site 1, from site 1 to the symmetrical site 1 and from the symmetrical site 1 to site 3 are marked as step Γ 1 (along
 | Fig. 11. Schematic diagram of the transmission path of Ag and sandwich structure in a HfO2-based ReRAM. For HfO2 slab, smaller balls represent the O atoms, bigger balls denote the Hf atoms. |
Ultimately, the lowest migration barrier path of Ag in HfO2 supercells is built by considering the results of the molecular dynamic simulations, migration barriers, and population analysis. As viewed from different directions, we can see that the Ag migrate along [111] or
 | Fig. 12. Optimal migration paths of Ag in HfO2 viewed from (a) [010], (b)   |
In this study, we model Ag motion from two sites, i.e., site 1 and site 3, in bulk HfO2 by using first-principles calculations. Thermodynamic analysis shows that the motion of Ag atoms in the HfO2 supercell appears to be anisotropic, however, the migration barrier and bond overlap population calculations indicate that for Ag in HfO2 the migration path in the
All the numerical calculations in this paper was done with the help of the Supercomputing Center of Hefei Institutes of Physical, Chinese Academy of Sciences and the Supercomputing Center of Anhui University.
| 1 |
|
| 2 |
|
| 3 |
|
| 4 |
|
| 5 |
|
| 6 |
|
| 7 |
|
| 8 |
|
| 9 |
|
| 10 |
|
| 11 |
|
| 12 |
|
| 13 |
|
| 14 |
|
| 15 |
|
| 16 |
|
| 17 |
|
| 18 |
|
| 19 |
|
| 20 |
|
| 21 |
|
| 22 |
|
| 23 |
|
| 24 |
|
| 25 |
|
| 26 |
|
| 27 |
|
| 28 |
|
| 29 |
|
| 30 |
|
| 31 |
|
| 32 |
|
| 33 |
|