Zhao Jun-Hua†, Tan Rui-Qin, Yang Ye, Xu Wei, Li Jia, Shen Wen-Feng, Wu Guo-Qiang, Yang Xu-Feng, Song Wei-Jie. Synthesis mechanism of heterovalent Sn2O3 nanosheets in oxidation annealing process . Chinese Physics B, 24(7): 070505
Permissions
Synthesis mechanism of heterovalent Sn2O3 nanosheets in oxidation annealing process
Zhao Jun-Hua†a), Tan Rui-Qinb), Yang Yec), Xu Weic), Li Jiac), Shen Wen-Fengc), Wu Guo-Qianga), Yang Xu-Fenga), Song Wei-Jiec)
College of Chemical and Material Engineering, Quzhou University, Quzhou 324000, China
Faculty of Information Science and Engineering, Ningbo University, Ningbo 315211, China
Ningbo Institute of Material Technology and Engineering, Chinese Academy of Sciences, Ningbo 315201, China
*Project supported by the National Natural Science Foundation of China (Grant Nos. 21377063, 51102250, 21203226, and 21205127) and the Personnel Training Foundation of Quzhou University, China (Grant No. BSYJ201412).
Abstract
Heterovalent Sn2O3 nanosheets were fabricated via an oxidation annealing process and the formation mechanism was investigated. The temperature required to complete the phase transformation from Sn3O4 toSn2O3 was considered. Two contrasting experiments showed that both oxygen and heating were not necessary conditions for the phase transition. Sn2O3 was formed under an argon protective atmosphere by annealing and could also be obtained at room temperature by exposing Sn3O4 in atmosphere or dispersing in ethanol. The synthesis mechanism was proposed and discussed. This fundamental research is important for the technological applications of intermediate tin oxide materials.
PACS:
05.70.Fh; 64.60.My; 62.23.Kn
Keyword:
intermediate tin oxides; nanosheets; metastable phase; synthesismechanism
Smart and functional oxide materials with heterovalent cation states have attracted a great deal of attention due to their amazing electrical, optical, magnetic, and chemical properties.[1– 3] These materials can be used to fabricate smart devices for important technological applications. As a key functional metal oxide, intermediate tin oxides SnO2− x (0 < x < 1) have received increasing attention for their potential applications in gas sensing, catalysts, luminescence, and lithium ion batteries.[4– 6] It is noteworthy that the only known preparation method for intermediate tin oxides is the traditional solid-state reactions: decomposition of SnO or carbothermal reduction of SnO2.[7– 9] However, the intermediate oxide phase is always accompanied by other phases, such as stoichiometric tin oxides Sn3O4 and metallic tin.[10, 11] Sn2O3 has been only mentioned as an impurity phase in a liquid-phase method.[12– 14] Pure phase Sn2O3 has not been obtained yet.
Solution-phase chemical routes can be used to provide materials with high purity and nanoscale crystalline.[15] The hydrothermal synthesis has been proved to be an effective method for preparing mixed-valence compounds of transition metals.[16] Sn3O4 nanosheets were first synthesized by our laboratory under hydrothermal conditions using stannous chloride as the source.[17– 19] Sn2O3-based sensors were fabricated by Sn3O4 dispersion later, showing high selectivity for NO detection.[17] To our knowledge, there are very few reports about the synthesis mechanism of the mixed-valence crystalline phase of Sn2O3 due to the lack of pure phase.[12– 14]
In this study, the formation process of Sn2O3 is studied in detail and two contrasting experiments are carried out. Through the analysis of the experimental study, the synthesis mechanism of Sn2O3 nanosheets is discussed.
2. Experiment
To prepare the Sn3O4 nanosheets, 0.12 mol SnCl2· 2H2O (AR, SCRC, China) was dissolved into 200 mL distilled water and the pH value was regulated to 11.80 by 0.50 mol/L NaOH under vigorous magnetic stirring for 2 h.[17] The obtained mixture was transferred into a 100 mL Teflon-lined stainless autoclave, sealed and maintained at 180 ° C for 12 h, then cooled down to room temperature. The obtained precipitates were centrifuged and washed six times with water and ethanol until Cl ions could not be detected. The products were finally dried in a vacuum at 60 ° C for 1 h. Sn3O4 nanosheets were further annealed at 300 ° C for 1 h at oxygen atmosphere until totally transferred to Sn2O3. To show the oxidation process of Sn3O4 nanosheets, the powders were annealed at 137 ° C, 435 ° C, 550 ° C, and 740 ° C respectively for 1 h in oxygen atmosphere. Sn3O4 nanosheets annealed under argon protective atmosphere were also synthesized. The powders were sealed in a silicon vacuum tube, annealed at 300 ° C and 500 ° C for 1 h at the vacuum levels of 1.0 × 10⁵ Pa, 5.7 Pa, and 4.1 × 10− 4 Pa, respectively, and slowly cooled down to room temperature. The Sn3O4 dispersion was synthesized by magnetically stirring for 1 h, followed by ultrasonic agitation at 40 kHz (300 W) for 30 min at room temperature.
The phase identification was achieved by x-ray diffraction (XRD) using a Bruker AXS D8 advance diffractometer with Cu Kα radiation at a power of 1.6 kW. High-resolution transmission electron microscopy (HRTEM) and selected area electron diffraction (SAED) patterns were obtained with an FEI Tecnai F20 field emission electron microscope. XPS spectra were obtained using a Kratos Axis Ultra DLD XPS system. Thermogravimetric analyses (TG, Pyris Diamond TG/DTA, Perkin-Elmer, USA) were conducted for the samples with a heating rate of 2 ° C/min. The Fourier transform infrared (FTIR) spectra of the nanoparticles were collected using a Thermo Electron Nicolet 6700 spectrometer (Nicolet 6700, Thermo Electron Corporation, Madison, WI). The optical transmission spectra were recorded using an ultraviolet– visible– near– infrared (UV– visible– NIR) spectrometer (Perkin Elmer Lambda 950, Shelton, USA) in the wavelength range of 190– 400 nm.
3. Results and discussion
3.1. Structural and morphology analysis
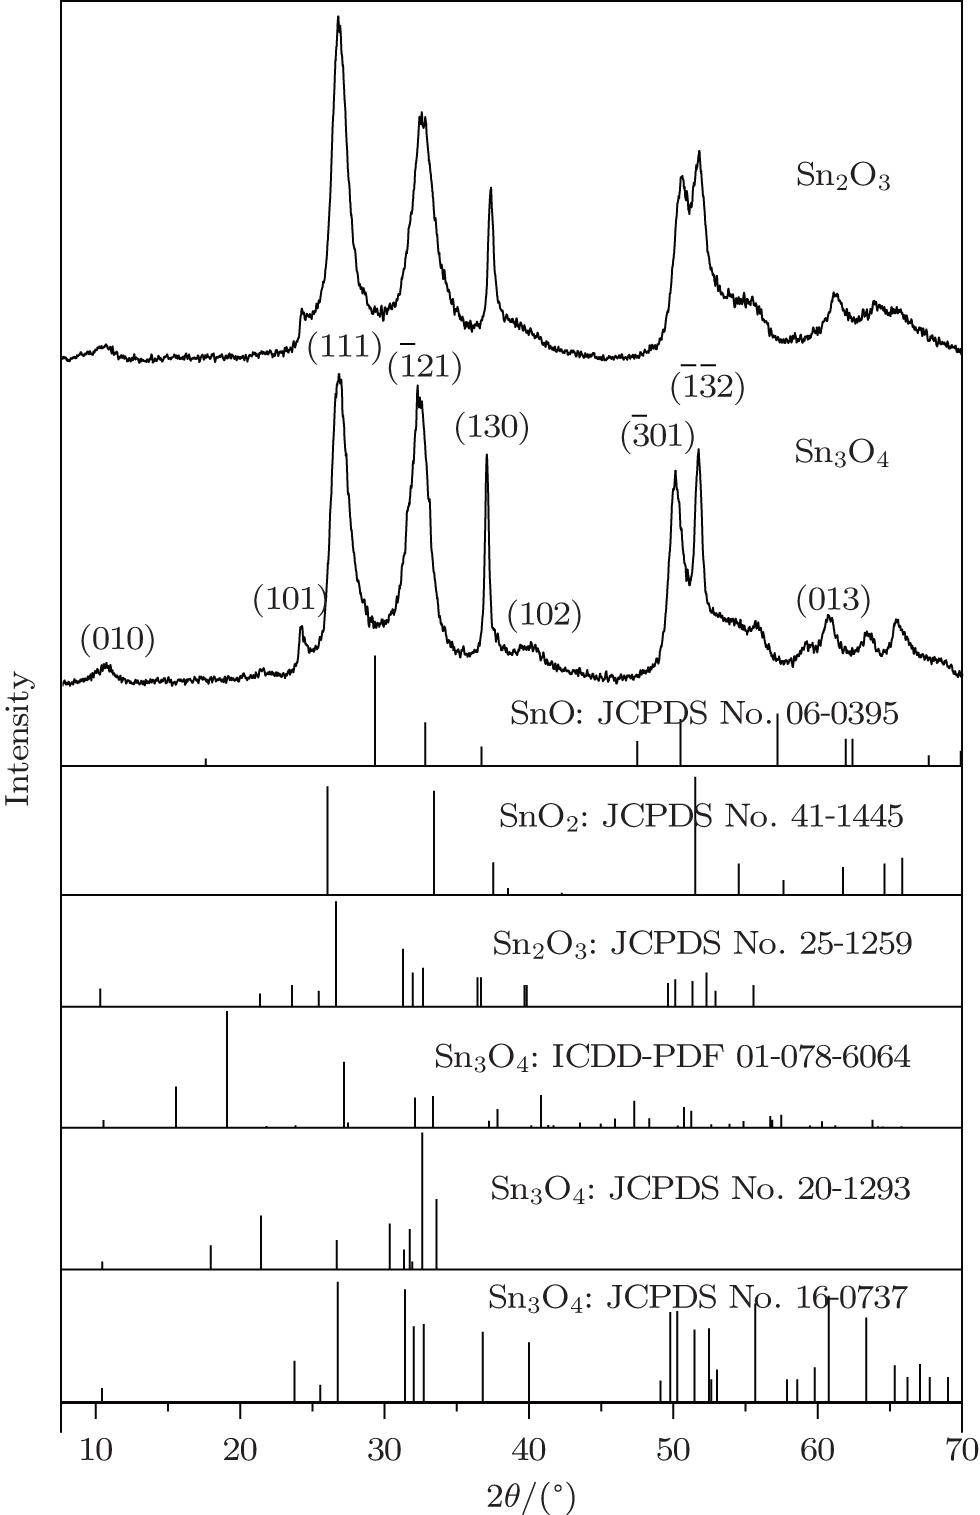
Figure 1 shows the typical XRD patterns of the as-synthesized products obtained by annealing Sn3O4 nanosheets
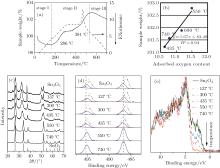
Fig. 1. XRD patterns of Sn3O4 nanosheets annealed under oxygen atmosphere at 300 ° C for 1 h.
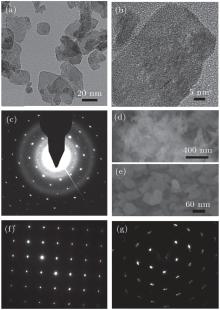
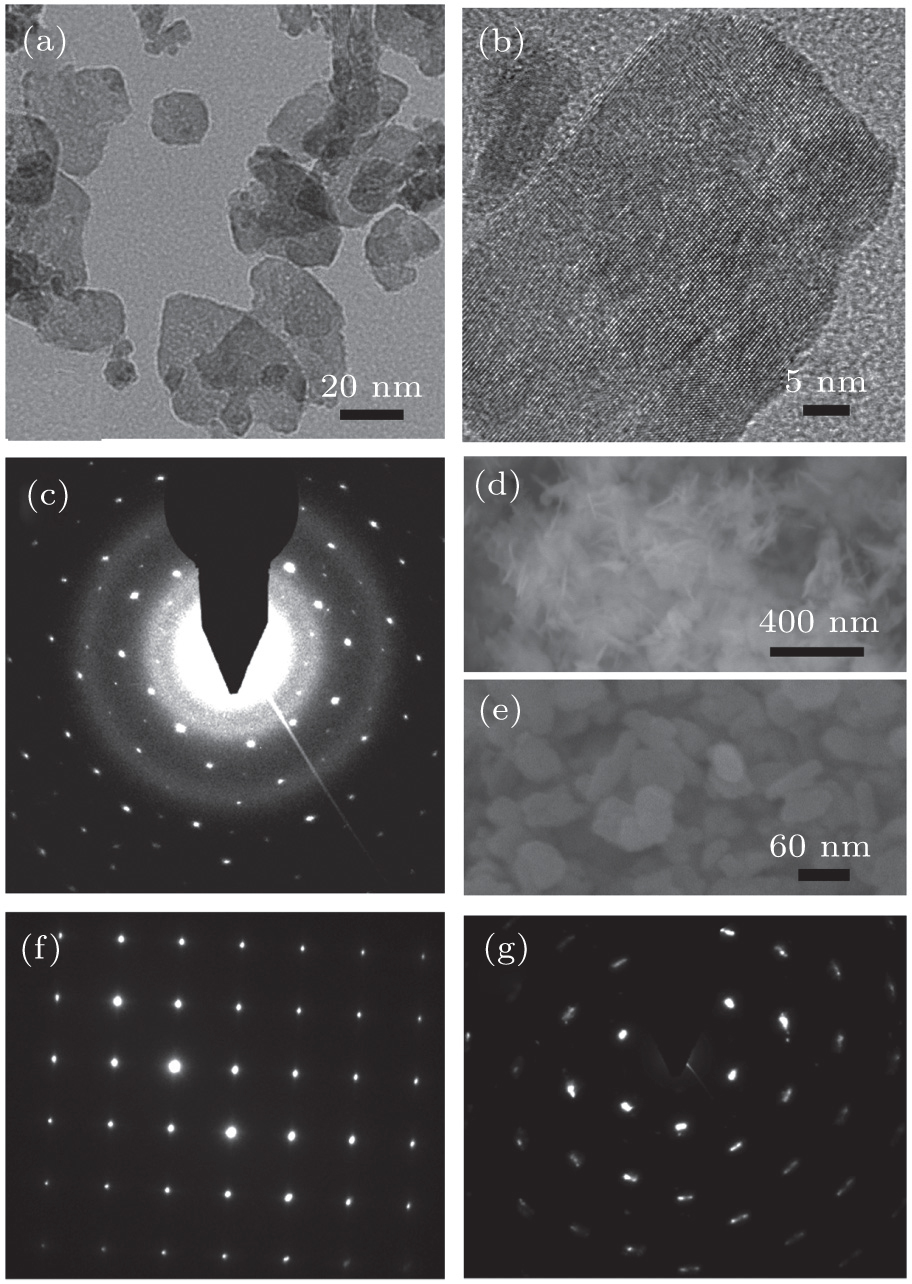
at 300 ° C for 1 h. The XRD patterns cannot be indexed to either tin oxide or stannous oxide, while they are similar to anorthic-phase Sn3O4 (JCPDS No. 16-0737) and Sn2O3 (JCPDS No. 25-1259). Comparing to the standard XRD spectrum of Sn3O4, peaks of (102) and (013) disappear, peaks of (010), (111), , and stay the same, while the other peaks all shift significantly to higher angles (ca. 0.34° ). The spectrum is also similar to that of Sn2O3 (JCPDS No. 25-1259). The diffraction peaks of the JCPDS card at angles higher than 58° disappear because of the conversion of radiation from Cr Kα (λ = 2.2897 Å ) to Cu Kα (λ = 1.5418 Å ). Figure 2 shows HRTEM and SEM images of the as-synthesized products. The nanoparticle shows a sheet-like morphology and exhibits a single-like diffraction pattern, implying that it is highly crystalline with a lattice spacing of 2.46 nm.
Fig. 2. (a) TEM, (b) HRTEM, and (c) SAED images of Sn3O4 nanosheets annealed under oxygen atmosphere at 300 ° C for 1 h. (d) and (e) SEM images of Sn3O4 nanosheets before and after annealing. (f) and (g) Typical SAED patterns of SnO and SnO2 particles.
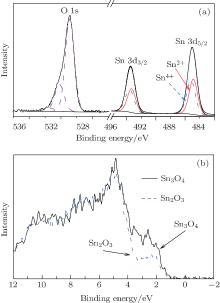
Figure 3(a) shows the curve-fitting data of the Sn 3d core-level spectra. The area ratio of S = S(Sn2+ )/[S(Sn4+ )+ S(Sn2+ )] is 0.49 deduced from the Sn 3d spectra. It means that this nanosheet contains similar concentrations of Sn2+ and Sn4+ .[20] In addition, Sn 3d and O 1s spectra show that the ratio of O/Sn is 1.48. These results are also confirmed by the valence-band (VB) spectrum (Fig. 3(b)). Owing to the prominent Sn 5s-derived peak characteristic of Sn2+ from the VB spectrum, I = I(Sn 5s)/I(O 2p) has been used to monitor the approximate concentrate ratio of Sn2+ .[21] Using the value of ISn3O4/ISnO2− x = 1.43 derived from the VB specturm, we expect ratio S to be 0.47 for SnO2− x. Generally, the above results indicate that the as-prepared nanosheet is Sn2O3.[17]
Fig. 3. (a) XPS spectra and (b) valence-band spectrum of Sn3O4 nanosheets annealed under oxygen atmosphere at 300 ° C for 1 h.
3.2. Oxidation properties
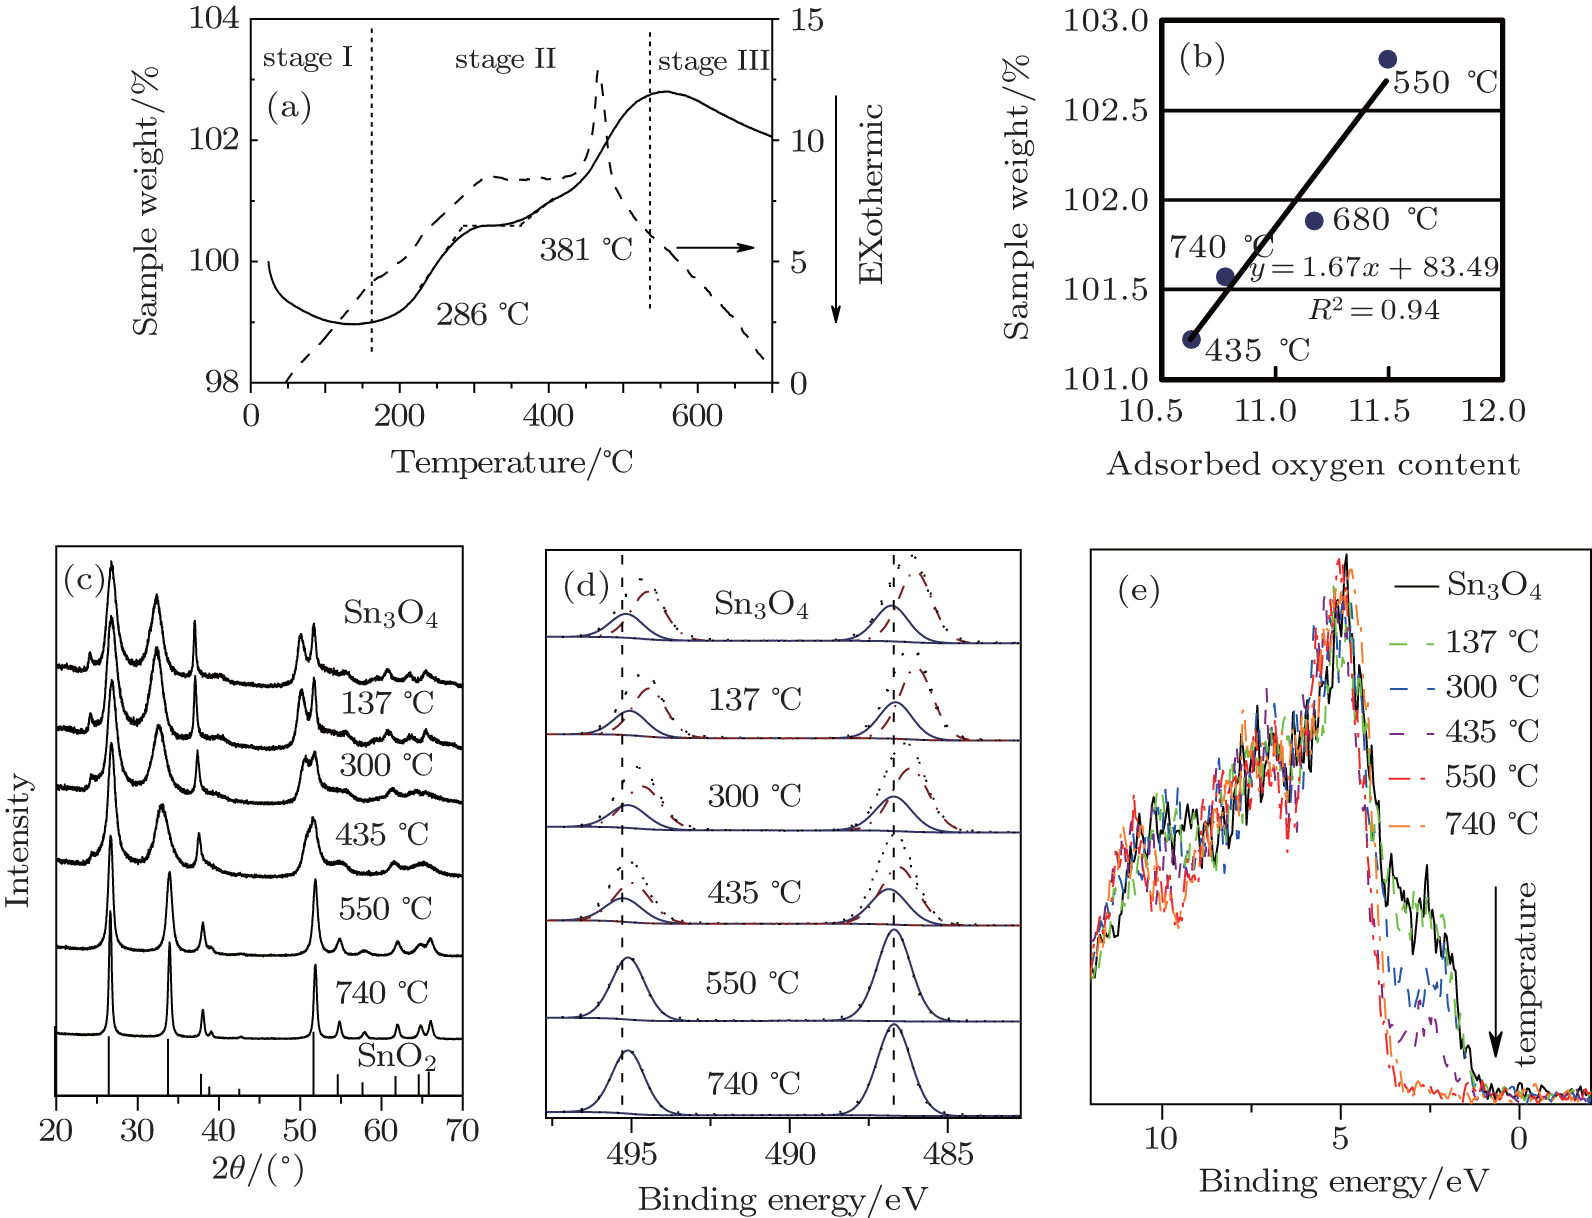
Thermogravimetric-differential thermal analysis(TG-DTA, Fig. 4.) is used to evaluate the oxidation properties of Sn3O4. Under air flow and a 2 ° C/min ramp rate, TG-DTA reveals a rapid weight loss at 185 ° C, which is due to the loss of moisture. The reason for the change of weight at the temperature higher than 400 ° C is the adsorption and desorption of adsorbed oxygen at the surface of the particle.[22] This result agrees well with the linear relationship between the adsorbed oxygen content obtained from XPS and the sample weight. With the increase of temperature, Sn3O4 is oxidized with the decrease of the Sn2+ /Sn4+ ratio, and finally a phase transition to rutile-type SnO2 occurs at 550 ° C during thermal processing. Furthermore, the weight is stable from 286 ° C to 381 ° C, where Sn2O3 is detected. This result agrees perfectly with the prediction by first principles that Sn2O3 is the second metastable phase with formation energy of − 8 meV/Sn.[23]
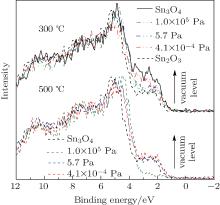
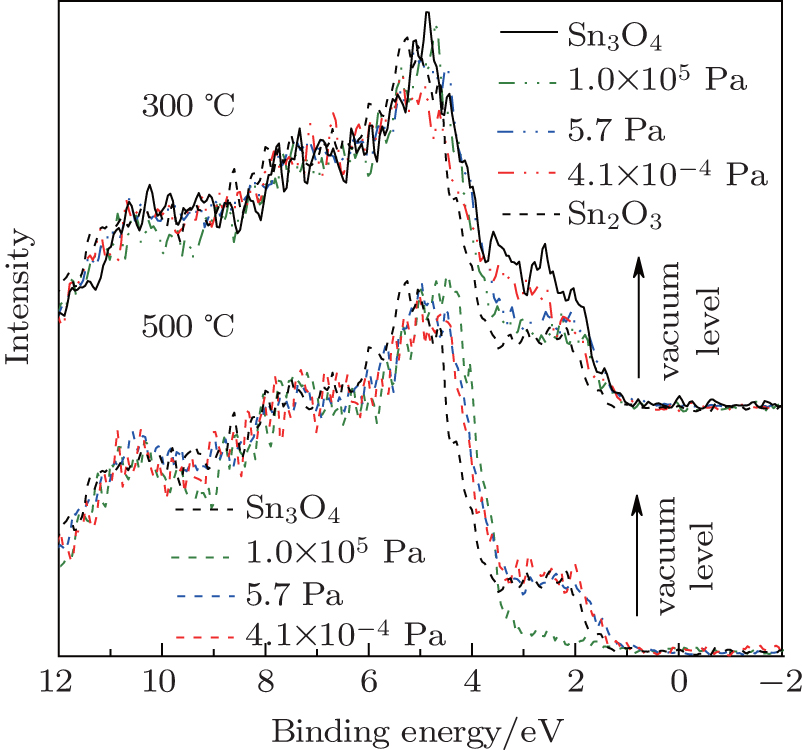
To further understand the formation mechanism of Sn2O3, a contrasting experiment was carried out. The Sn3O4 nanosheets were annealed under the argon protective atmosphere with the vacuum levels of 105 Pa to 10− 4 Pa at 300 ° C. With the increase of the vacuum level, the oxidation process of Sn3O4 is delayed (Fig. 5). By increasing the temperature from 300 ° C to 500 ° C, Sn2O3 is synthesized with the vacuum levels of 101 Pa to 10− 4 Pa. These results indicate that oxygen is not the necessary condition for the preparation of Sn2O3.
Fig. 5. The valence-band XPS spectra of Sn3O4 annealed under argon protective atmosphere at 300 ° C and 500 ° C with the vacuum levels of 105 Pa to 10− 4 Pa.
3.3. Formation mechanism of Sn2O3 nanosheets
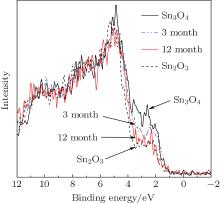
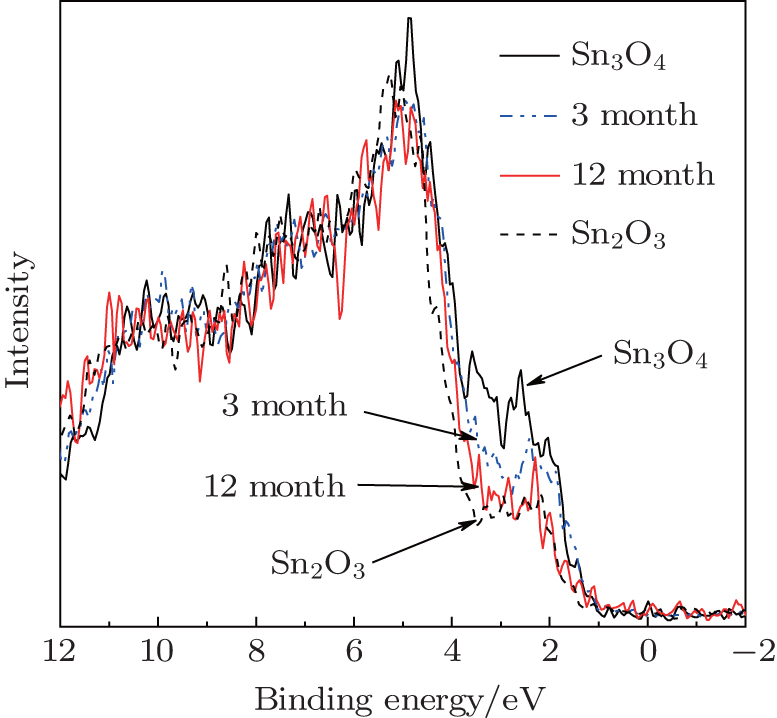
To determine which parameters affect the oxidation process from Sn3O4 to Sn2O3, we investigated the oxygen-free heating progress. By exposing Sn3O4 nanosheets in dry air at room temperature, the light greenish-yellow Sn3O4 nanosheets turned brown and converted to Sn2O3 after 12 months (Fig. 6). By comparing to the data in Fig. 3, it is found that the annealing process depends on the oxidation kinetics.
Fig. 6. The valence-band XPS spectra of Sn3O4 after exposing in the atmosphere for one year.
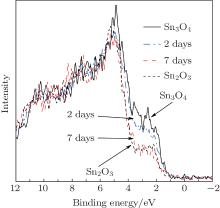
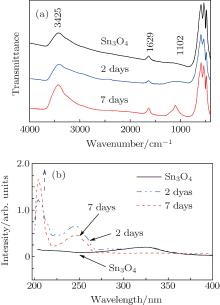
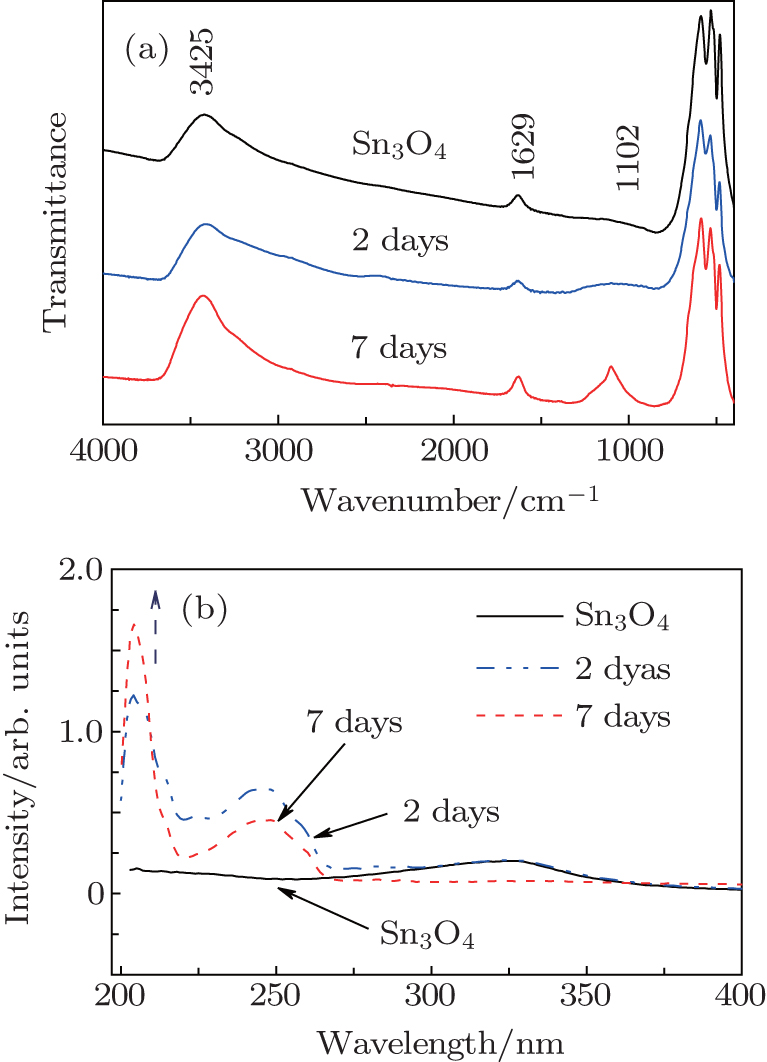
Similarly, the fresh Sn3O4-ethanol dispersion turned brown by standing at room temperature. The ratio of Sn2+ /Sn4+ decreased during standing time and Sn2O3 was synthesized within 7 days (Fig. 7). Figure 8(a) shows the FTIR spectra of the Sn3O4– ethanol dispersion with different exposing time. For all samples, three strong bands exist around 650 cm− 1, which are ascribed to Sn– O vibration.[24] The broad absorption peaks centered at 3425 cm− 1 and 1629 cm− 1 are attributed to − OH stretching and bending modes, [25] respectively. The bands of − CH2 and − CH3 stretching modes do not appear in the FTIR spectra, which indicates that ethanol is not chemisorbed on the Sn3O4 nanosheets. Furthermore, an absorption peak appears at 1102 cm− 1 and becomes stronger during the exposing time, which is assigned to the superoxide radical anion (O2− ) stretching modes.[26]
Fig. 7. The valence-band XPS spectra of Sn3O4 after exposing in ethanol for 7 days.
Figure 8(b) shows the UV– vis spectra of Sn3O4– ethanol dispersion with different exposing time. An extra absorption band near 204 nm appears after 2 days. This peak might correspond to Sn4+ species, [27] and increases with the increase of exposing time in Fig. 8(b). This means that Sn2+ is oxidized to Sn4+ with the increase of exposing time, which agrees well with the valence-band XPS spectra.
Fig. 8. (a) The Fourier transform infrared spectra and (b) UV– vis absorption spectra of Sn3O4 after exposing in ethanol for seven days.
The formation mechanism of Sn2O3 synthesized by annealing Sn3O4 under air at 300 ° C could be explained as follows. The oxygen vacancies layered on the (101) planes may be suitable sites available for oxygen adsorption. The chemisorption of oxygen may result in a mixture of various oxygen species on the surface, expressed as O2(g) + VO + e− ⇔ adsorbed oxygen, where e− is the quasi-free electron. The annealing process induces the surface oxygen vacancies, which trap the electrons from adsorbed oxygen and react with gaseous oxygen according to the following reaction: , where is the atomic oxygen. The oxygen vacancy disappears with the decrease of the bond length between Sn and O ions. A more stable structure exists with higher bond energies.
When dispersing Sn3O4 into ethanol, the surface oxygen vacancies trap the electrons from ethanol, which breaks down the balance of long pairs between Sn and O ions.[28] This may be the reason why the peak near 204 nm in Fig. 8(b) appears after 2 days’ exposure in ethanol. The metastable structure distorts and tends to a more stable structure with the formation of oxygen vacancy. The detailed interaction behavior between Sn3O4 and ethanol needs further exploration.
4. Conclusion
The heterovalent Sn2O3 nanosheet was synthesized by oxidation of Sn3O4 at 300 ° C for 1 h at oxygen atmosphere. This was supported by XRD, HRTEM, and XPS studies, which showed that the synthesized nanosheet has high crystalline and contains similar concentrations of Sn2+ and Sn4+ species. Neither the oxygen nor the heating processes were necessary for the fabrication of Sn2O3. Sn2O3 could be obtained by annealing Sn3O4 under an argon protective atmosphere with different vacuum levels, and also could be synthesized at room temperature by exposing Sn3O4 in the atmosphere or dispersing in ethanol. The synthesis mechanism was proposed and characterized. These experimental results extended the knowledge base that can be used to guide technological applications of intermediate tin oxide materials.
BerengueO M, SimonR A, ChiquitoA J, DalmaschioC J, LeiteE R, uerreiroG H A and GuimaraesF E G2010J. Appl. Phys. 107033717DOI:10.1063/1.3294613[Cited within:1]
... 3] These materials can be used to fabricate smart devices for important technological applications ...
1
2007
0.0
0.0
... [4#cod#x2013 ...
1
2010
0.0
0.0
1
2010
0.0
0.0
... 6] It is noteworthy that the only known preparation method for intermediate tin oxides is the traditional solid-state reactions: decomposition of SnO or carbothermal reduction of SnO2 ...
1
1967
0.0
0.0
... [7#cod#x2013 ...
1
2010
0.0
0.0
1
2010
0.0
0.0
... 9] However, the intermediate oxide phase is always accompanied by other phases, such as stoichiometric tin oxides Sn3O4 and metallic tin ...
1
1973
0.0
0.0
... [10,11] Sn2O3 has been only mentioned as an impurity phase in a liquid-phase method ...
1
1973
0.0
0.0
... [10,11] Sn2O3 has been only mentioned as an impurity phase in a liquid-phase method ...
2
1997
0.0
0.0
... [12#cod#x2013 ...
... [12#cod#x2013 ...
1
2011
0.0
0.0
2
2012
0.0
0.0
... 14] Pure phase Sn2O3 has not been obtained yet ...
... 14] ...
1
2001
0.0
0.0
... [15] The hydrothermal synthesis has been proved to be an effective method for preparing mixed-valence compounds of transition metals ...
1
2003
0.0
0.0
... [16] Sn3O4 nanosheets were first synthesized by our laboratory under hydrothermal conditions using stannous chloride as the source ...
4
2012
0.0
0.0
... [17#cod#x2013 ...
... [17] To our knowledge, there are very few reports about the synthesis mechanism of the mixed-valence crystalline phase of Sn2O3 due to the lack of pure phase ...
... [17] The obtained mixture was transferred into a 100#cod#x00A0 ...
... [17] ...
1
2014
0.0
0.0
1
2014
0.0
0.0
... 19] Sn2O3-based sensors were fabricated by Sn3O4 dispersion later, showing high selectivity for NO detection ...
1
2012
0.0
0.0
... [20] In addition, Sn 3d and O 1s spectra show that the ratio of O/Sn is 1 ...
1
1992
0.0
0.0
... [21] Using the value of ISn3O4/ISnO2#cod#x2212 ...
1
1997
0.0
0.0
... [22] This result agrees well with the linear relationship between the adsorbed oxygen content obtained from XPS and the sample weight ...
1
2008
0.0
0.0
... [23] ...
1
2014
0.0
0.0
... [24] The broad absorption peaks centered at 3425#cod#x00A0 ...
1
2011
0.0
0.0
... OH stretching and bending modes,[25] respectively ...
1
1973
0.0
0.0
... [26] ...
1
2001
0.0
0.0
... species,[27] and increases with the increase of exposing time in Fig ...
1
1996
0.0
0.0
... [28] This may be the reason why the peak near 204#cod#x00A0 ...
Synthesis mechanism of heterovalent Sn2O3 nanosheets in oxidation annealing process
[Zhao Jun-Hua†a), Tan Rui-Qinb), Yang Yec), Xu Weic), Li Jiac), Shen Wen-Fengc), Wu Guo-Qianga), Yang Xu-Fenga), Song Wei-Jiec)]


 , Tan Rui-Qin