Rotational stretched exponential relaxation in random trap–barrier model
Aydiner Ekrem†
Rotational stretched exponential relaxation in random trap–barrier model |
|
Aydiner Ekrem†
|
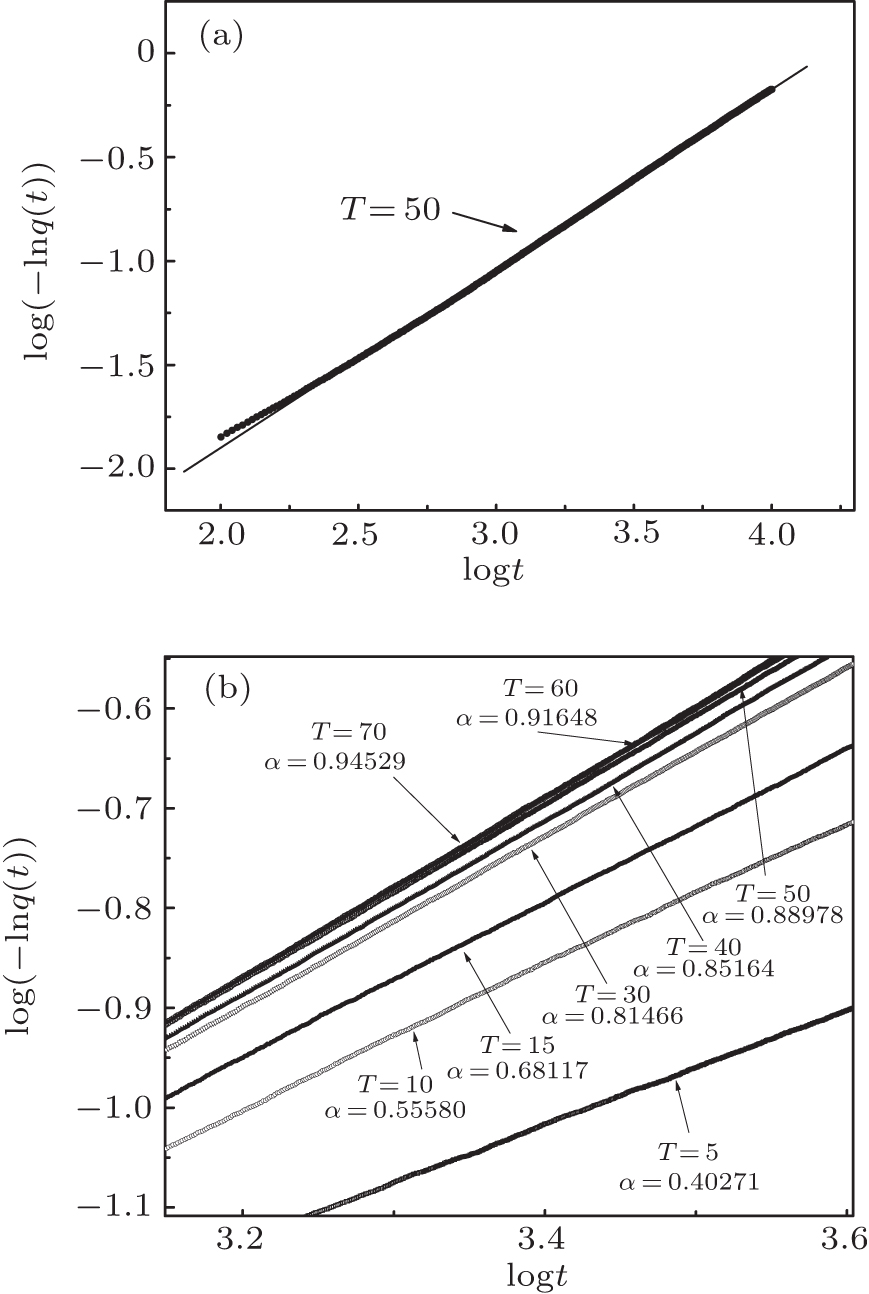
| (a) The log(−ln q ( t )) versus log t plot of the rotational relaxation function q ( t ) for temperature T = 50. The solid line on the curve is a fit line, which shows that the time dependence of simulation data can be represented by the stretched exponential relaxation function for the spherical RTB model. (b) The log(−ln q ( t )) versus log( t ) plot of the rotational relaxation function q ( t ) for different temperatures. |
| |