
Theoretical investigation on isomer formation probability and free energy of small C clusters*
[Lin Zheng-Zhe ]
]
]
|
|


†Corresponding author. E-mail: linzhengzhe@hotmail.com
*Project supported by the National Natural Science Foundation of China (Grant No. 11304239) and the Fundamental Research Funds for the Central Universities.
Molecular dynamics simulations and free energy calculations are employed to investigate the evolution, formation probability, detailed balance, and isomerization rate of small C cluster isomer at 2500 K. For C10, the isomer formation probability predicted by free energy is in good agreement with molecular dynamics simulation. However, for C20, C30, and C36, the formation probabilities predicted by free energy are not in agreement with molecular dynamics simulations. Although the cluster systems are in equilibrium, detailed balance is not reached. Such results may be attributed to high transformation barriers between cage, bowl, and sheet isomers. In summary, for mesoscopic nanosystems the free energy criterion, which commonly holds for macroscopic systems in dynamic equilibrium, may not provide a good prediction for isomer formation probability. New theoretical criterion should be further investigated for predicting the isomer formation probability of a mesoscopic nanosystem.
Decades ago, the structure of nanoclusters was essential to modern nanotechnology. For example, catalysts used in fuel cells are based on Pt or Pt alloy clusters[1– 5] which always exhibit very complex structures. In 1985, C60 fullerene was first prepared by Kroto et al.[6] from laser ablation of graphite in He buffering. In this well-known experiment, the formation probability of CN clusters was obviously affected by He pressure, and by an integration cup to maximize the cluster reaction, the products became mainly C60 and a few C70. However, at very high pressure small C clusters will aggregate to large amorphous nanoparticles.[7, 8] In fact, the influence of experimental conditions on cluster structure may be difficult to extrapolate. Therefore, theoretical investigations should emphasize on the kinetics of formation and isomerization. For example, Slanina et al. used free energy criterion to predict isomer formation probability of a CN cluster.[9] Nowadays, such a method has been widely applied to various kinds of clusters.[10– 12] However, since the topography of global potential energy surface is complicated, the cluster system needs a long time to reach ergodicity.[13] Therefore, the isomer formation probability in thermal equilibrium and its relation with isomer free energy should be carefully examined before using them as theoretical criterion. In our previous work, we found that for Pt cluster isomers the prediction of free energy criterion is in good agreement with equilibrium molecular dynamics (MD) simulations.[14] However, in the study of C clusters[5, 15, 16] we found that for C36 isomers the free energy criterion can only roughly give the differences in formation probability among cage, bowl, and sheet isomers, but fails to quantitatively predict the formation probability of each isomer.[17] In this case, we even develop a time-going-back method[18] and a statistical model[19] to predict C isomer formation probability. In a word, the validity of free energy criterion should be further examined.
In this work, MD simulation and free energy calculation by the Metropolis Monte Carlo method are employed to investigate the evolutions, formation probabilities, detailed balances, and isomerization rates of C10, C20, C30, and C36 cluster isomers at 2500 K. For C10, the isomer formation probability in MD is in good agreement with the prediction of free energy criterion. However, for C20, C30, and C36 the free energy criterion fails to quantitatively predict the formation probability. The detailed balance between isomers is not reached. For example, the cage fullerene of C20 (i.e., an isomer that has not been found in the product of laser ablation of graphite for a long time, finally was synthesized by chemical method[20]) was never formed in MD simulations, while the free energy criterion predicts that it may be found. For C36, the most probable isomer in MD is the one with D2d symmetry, while the free energy criterion proposes the one with D6h symmetry. In summary, the difference between MD simulation and the free energy criterion reminds us to use the free energy criterion cautiously. For mesoscopic nanosystems, the free energy criterion which commonly holds for macroscopic systems may not provide a good prediction for isomer formation probability. In future research, we need to provide a new theoretical criterion for predicting the isomer formation probability of mesoscopic nanosystems.
To investigate the formation and isomerization of C cluster, MD simulation is performed for isolated C atoms in He buffer gas. The interaction between C atoms is described by the Brenner potential, and Leonard-Jones potential is applied to the He– He and C– He interactions. N isolated C atoms and 160 He atoms are randomly placed in a cubic with a side length of 40 Å (the pressure of He gas is about 100 atm (1 atm = 1.01325× 10⁵ Pa) at 300 K) and periodical boundary condition is used. Both the C and He atoms are initially set to be at 2500 K, and a thermal bath at the same temperature was applied to the He atoms. In time steps of 0.2 fs, the simulation takes 300 ns. During the evolution, the structure of the CN system is sampled once every 5 ps and cooled down to 0 K. For a given N, the formation probability of each isomer can be derived by counting the sampling number in running simulations many times.
It is worth noting that the statistic results are taken from simulations taking only 300 ns. To verify whether the simulation time is long enough for the system to arrive at equilibrium, we perform the same MD simulations starting from an isomer, instead of starting from C atomic gas. Such simulations are also run for 300 ns. If such simulations provide the same isomer formation probability distribution as the simulations from C atomic gas, such an isomer formation probability distribution will no longer change considerably even if the simulations are extended to infinite time.
To obtain the reaction path and corresponding rate of transformation between isomers, MD simulations are performed using the technique in Subsection 2.1, starting from a given isomer instead of starting from C atomic gas. The time taken by the transformation from the isomer to another one is recorded. By repeating the simulations a thousand times, probable reaction paths from a given isomer to other isomers are all obtained, and the average reaction rate of each path is derived. Finally, the energy profiles of minimum energy paths are calculated by the nudged elastic band (NEB) method.[21, 22]
In equilibrium, the formation probability of cluster isomer is corresponding to the free energy. In an isothermal-isobaric ensemble, the Gibbs free energies of isomer a and b satisfy

where T is the temperature, and Na and Nb are the molecule numbers of a and b respectively. Similarly, in an isothermal-isovolumic ensemble the Helmholtz free energies satisfy

When the cluster molecules are treated as an ideal gas, then

and the ratio Nb/Na in isothermal– isobaric equals that in the isothermal– isovolumic ensemble. Then, by F = − kT lnQ (where Q is the molecular partition function) the ratio reads

In the following discussion we focus on the classical partition function Q and compare it with classical MD simulations.
At low temperature, by the rigid-rotor and harmonic-oscillator approximation Q can be decomposed into

where E0 is the potential energy (PE) of isomer at 0 K; QT, QR, and QV are the translational, rotational, and vibrational partition functions, respectively. Here,

where M is the molecular mass and V is the volume of simulation box, and

where Ix, Iy, and Iz are the molecular principal moments of inertia, and δ is the rotational symmetry number. The quantum mechanical expression for the vibrational partition function reads

where ν i is the canonical vibrational frequency of mode i. In the classical limit, it becomes

At high temperature, Q can be calculated numerically. For the atoms located at r1 ∼ rn with mass m1 ∼ mn and momentum p1 ∼ pn, the total energy reads

where U is the interaction potential, and the classical partition function reads

Then, to separate the translational motion new coordinates 


in which the Jacobian

Next, the rotational motion is separated by another transformation stated as follows. Starting from 


By

and

the integral element in Eq. (12) reads


Then, according to the rotational symmetry 

Combining Eqs. (11), (12), and (17), we have

and

in which the term on the right-hand side can be treated as the average value of e(U/k)(1/T1 − 1/T2) in the canonical ensemble at T1.
Based on the above theory, a technique is developed to calculate the partition function Q of an isomer at a given temperature. At T = 300 K, Q is calculated by Eqs. (5)– (7), and (9). Then, equation (19) is employed to accurately calculate Q values from low to high temperature. By the Metropolis Monte Carlo method, the calculation temperature T2 is increased to 500, 700, 900, … , 2500 K while keeping T1 = T2– 200 K, and then the formation probability of each isomer at 2500 K, i.e., the free energy criterion is evaluated by Eq. (4). Note, for isomers with chirality, Q is taken as the sum of both enantiomers.
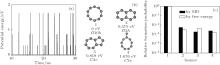
In MD simulations for N = 10, the C atoms condense into a C10 cluster in about 0.3 ns. Figure 1(a) shows the evolution of isomer PE sampled in MD, in which the points with the same PE correspond to the same isomer. In most of the time, the C10 system stays in the isomer form with the lowest PE. Sometimes it transforms to a state with higher PE and then falls down immediately. By counting the sampling number of each isomer, the four isomers with the lowest PEs are found to be most probable, denoted as 1, 2, 3, and 4 in Fig. 1(b) with their PEs and symbols of molecular point group. In the MD simulations, the sum of the formation probability of these four isomers is about 99.5%, while other isomers with higher PEs seldom appear. The relative formation probabilities of isomers 1, 2, 3, and 4 are 0.990, 5.53× 10− 3, 1.80× 10− 3, and 2.32× 10− 3. According to free energy calculations and the free energy criterion Eq. (4), the predicted formation probabilities of isomers 1, 2, 3, and 4 are 0.991, 3.01× 10− 3, 4.57× 10− 3, and 1.60× 10− 3, which are in proximity to the MD values [Fig. 1(c)]. The above results indicate that the C10 system is in thermal equilibrium at 2500 K.
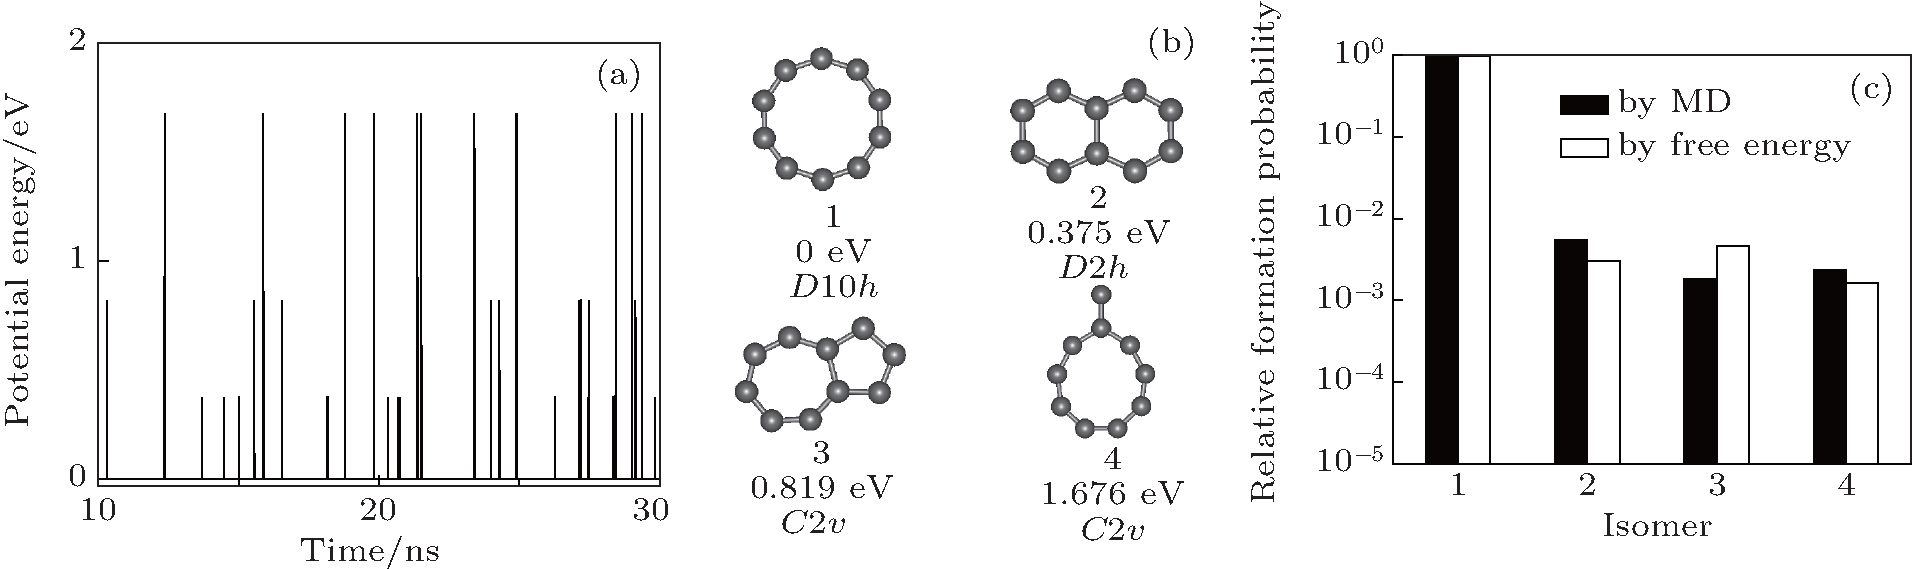 | Fig. 1. (a) The PE of C10 isomers sampled during the MD simulation, in which the lowest PE is set to be 0. (b) The four C10 isomers of the lowest PE, with corresponding PEs and symbols of the molecular point group marked. (c) The relative formation probabilities of the isomers 1, 2, 3, 4 in panel (b) from the MD simulations and free energy calculations. |
In MD simulations for N = 20, the C atoms condense into a C20 cluster in less than 0.3 ns, then frequently transform between isomers. In the evolution at T = 2500 K, more than 5000 isomers are found. These isomers can be classified into bowls, sheets, and irregular shapes. By sampling isomer PEs, it is found that the isomerization of C20 is much more frequent than that of C10, and the C20 system seldom stays at the state of the lowest PE [Fig. 2(a)]. The structures of the seven isomers of the lowest PE (denoted as 1– 7) are shown in Fig. 2(b) with their PEs and symbols of molecular point group. By sampling isomers in MD simulations, the relative formation probabilities of the sixteen isomers of the lowest PE (denoted as 1– 16) are derived (shown by the black columns in Fig. 2(c)). The result indicates that the isomer formation probabilities are obviously unrelated to the level of PE. To confirm that the system is in equilibrium, MD simulations are performed by starting from 1, 2, and 3 instead of starting from C atomic gas. By running the simulations many times, the same isomer formation probability spectrum as the simulations from C atomic gas is reproduced. It indicates that such an isomer formation probability spectrum will no longer change even if the simulations are extended to infinite time.
According to free energy calculations and the free energy criterion Eq. (4), the predicted formation probabilities of isomers 1– 16 (shown by the white columns in Fig. 2(c)) are not in accordance with the MD results. For some isomers, the difference between the formation probability by the free energy criterion and that by MD simulations is even in one order of magnitude. It is worth noting that the cage fullerene (denoted as cage in Fig. 2(b)), which is considered as the smallest fullerene, [20] is not found in MD simulations. However, with a free energy of 0.651 eV higher than 1, a considerable formation probability of cage is predicted to be Ncage/N1 = 4.86× 10− 2. The above facts indicate that the free energy criterion is not suitable for the C20 system at 2500 K. However, the free energies of some sheet isomers (e.g. 4, 6, 10, and 16) are almost lower than those of bowls (e.g. 1, 2, 3, 5, and 7), and the formation probabilities of some sheet isomers are actually higher than those of bowls. Generally speaking, the free energy criterion can only roughly give the formation probabilities of different isomer classes, but fails to quantitatively predict the formation probability.
 | Fig. 2. (a) The PE of C20 isomers sampled during the MD simulation, in which the lowest PE is set to be 0. (b) The 7 C20 isomers of the lowest PE (denoted as 1– 7) from the MD simulations and the fullerene (denoted as cage) of C20, with corresponding PE and symbols of molecular point group for symmetric structures marked. (c) The relative formation probability of the 16 C20 isomers of the lowest PE (denoted as 1– 16) from the MD simulations (black column), and the corresponding theoretical values from the free energy calculation (white column). (d) The potential energy profile of the reaction path from isomer 6 to b via an intermediate state a, with corresponding isomer structure shown. (e) The potential energy profile of the reaction path from isomers 1 to 3 via an intermediate state 2, with corresponding isomer structure shown. |
Then, the detailed balance between C20 isomers is investigated. As an example, we choose the most probable isomer 6 and perform the simulation introduced in Subsection 2.2, and a most probable reaction path to an isomer b via an intermediate state a is found. By the NEB method, the potential energy profile of 6– a– b along the reaction coordinate is obtained and shown in Fig. 2(d). In MD simulations, we derive a rate k6→ a = 4.79× 10¹⁰ s− 1 for the transformation from isomer 6 to isomer a, and ka→ 6= 2.45× 10¹² s− 1 for the transformation from isomer a to isomer 6. However, the ratio Na/N6= 3.80× 10− 2 of the formation probability of 6 isomer and isomer a in MD is far from k6→ a/ka→ 6 = 1.96× 10− 2, which means detailed balance is not reached. Such a situation is also found for the transformation between isomers a and b, for which Nb/Na = 2.30 is also far from ka→ b/kb→ a = 11.7 (ka→ b = 2.53× 10¹² s− 1, kb→ a = 2.17× 10¹¹ s− 1). The transformation from isomer 1 to isomer 3 via isomer 2 as an intermediate (corresponding potential energy profile is shown in Fig. 2(e)) is found as another example. It is found that N2/N1 = 1.03, k1→ 2/k2→ 1 = 0.278, and N3/N2 = 0.558, k2→ 3/k3→ 2 = 0.807. Such a deviation between the ratio of formation probabilities and isomerization rate further indicates that the free energy criterion is not suitable for the C20 system.
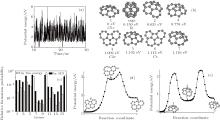
In the evolution at 2500 K, more than 9000 C30 isomers are found, which can be classified into cages, bowls, and sheets. Generally, cages have lower PEs than bowls and sheets, but the C30 system seldom stays at cage states. Figure 3(b) presents the structure of isomer a (which has the lowest PE in all isomers) and the six most probable isomers b– g. By sampling isomers in MD simulations, it can be clearly seen that during the evolution the PE of C30 system is always about 4 eV higher than the lowest value (the upper panel of Fig. 3(a)). The relative formation probability of a– g in MD is shown by the black columns in Fig. 3(c). To confirm that the system is in equilibrium, we also perform MD simulations starting from a instead of starting from C atomic gas, and find that a quickly transformed into sheet isomer with increasing the PE (the lower panel in Fig. 3(a)) in about 2 ns via irregular isomer as an intermediate state. In the following evolution, an isomer formation probability spectrum similar to the previous MD simulations is reproduced. This result indicates that the C30 system is in equilibrium and isomer formation probability spectrum will no longer change even if the simulations are extended to infinite time.
Then, free energy calculations are performed for isomers a– g to examine the free energy criterion Eq. (4). The predicted formation probabilities are shown by white columns in Fig. 3(c). Although the free energy of isomer a is not the lowest, it is not a stable structure due to some dynamic reason. Comparing the MD simulations with the free energy criterion, it is clearly shown that the free energy criterion fails to quantitatively predict the formation probability. However, its criterion can roughly give the formation probabilities of different types of isomers (cages, bowls, and sheets). For example, the free energies of isomers e, f, and g (sheets) are lower than those of isomers a (cage) and b, c, and d (bowls). And the formation probabilities of isomers e, f, and g are actually higher than those of isomers a, b, c, and d.
 | Fig. 3. (a) Upper: the PE of C30 isomers sampled during the MD simulation, lower: the PE of C30 isomers sampled during the MD simulation starting from the isomer of the lowest PE. In both panels the lowest PE is set to be 0. (b) The isomers of C30:a represent the one of the lowest PE and b– g refer to the 6 most probable isomers, with corresponding PE and symbols of molecular point group for symmetric structures marked. (c) The relative formation probabilities of a– g from the MD simulations (black column), and corresponding theoretical values from the free energy calculation (white column). |
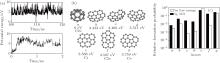
For C36 system at 2500 K, the isomers can be also classified into cages, bowls, sheets, and irregular shapes. According to the sampling in MD simulations, the PE of the system jumps in a short time [Fig. 4(a)], but for a long time, i.e., the simulation duration 300 ns, the ergodicity is achieved. This point can also be proved by MD simulations starting from a chosen isomer instead of starting from C atomic gas. By any chosen isomers, the same formation probability spectrum as that from C atomic gas is reproduced, indicating that the system is in equilibrium. In the above simulations, the isomer of the lowest PE is isomer 1 with D6h symmetry in Fig. 4(b), i.e., just the one found in experimental preparation.[23] In Fig. 4(b), the eight most probable C36 isomers are shown, in which isomers 1– 6 are of cages and isomers 7 and 8 are of sheets. The most probable one is isomer 2 with D2d symmetry. According to the sampling in MD simulations, the corresponding formation probability is shown by the black columns in Fig. 4(c).
 | Fig. 4. (a) The PE of C36 isomers sampled during the MD simulation. (b) Isomers 1– 8 represent the 8 most probable isomers, with corresponding PE and symbols of molecular point group for symmetric structures marked. (c) The relative formation probabilities of isomers 1– 8 from the MD simulations (black column), and corresponding theoretical values from the free energy calculation (white column). |
Then, free energy calculations are performed for isomers 1– 8 to examine the free energy criterion Eq. (4). The predicted formation probabilities are shown by white columns in Fig. 4(c), which are not in agreement with MD simulation results either. At 2500 K, the isomer 1 has the lowest free energy. But in MD simulations it is not the most probable one. In summary, the free energy criterion fails to quantitatively predict the formation probability. However, its criterion can roughly give the formation probabilities of different types of isomers. For example, the free energy of isomer 1 (cage) is lower than those of isomers 7 and 8 (sheets). And the formation probabilities of 7 and 8 are actually higher than that of isomer 1. Overall, for mesoscopic nanosystems the free energy criterion may not provide a good prediction for isomer formation probability. In future research, a new theoretical criterion should be investigated.
In this work, MD simulations and free energy calculations by the Monte Carlo method are employed to investigate the evolutions, formation probabilities, and isomerization rates of small C clusters at 2500 K. For C clusters of a few atoms, e.g. C10, ergodicity is achieved in hundreds of ns and the system is in equilibrium. The isomer formation probabilities predicted by free energy are in good agreement with MD simulations. However, for larger C clusters, e.g. C20, C30 or C36, the formation probabilities predicted by free energy are not in good agreement with those from MD simulations and detailed balance is not reached. Such results may be attributed to the transformation barriers between cage, bowl, and sheet isomers because of their large difference in geometry. The structure transformation from one isomer to another may go through some high-energy intermediate states, and thermal equilibrium is difficult to achieve for so many structures. In summary, the free energy criterion can only roughly predict the formation probabilities between different types of isomers, but fail to quantitatively predict them. In the future research, a new theoretical criterion should be further investigated.
| 1 |
|
| 2 |
|
| 3 |
|
| 4 |
|
| 5 |
|
| 6 |
|
| 7 |
|
| 8 |
|
| 9 |
|
| 10 |
|
| 11 |
|
| 12 |
|
| 13 |
|
| 14 |
|
| 15 |
|
| 16 |
|
| 17 |
|
| 18 |
|
| 19 |
|
| 20 |
|
| 21 |
|
| 22 |
|
| 23 |
|