1. IntroductionIn recent years, infrared solid state lasers working around 2.0 μ m have received much attention due to its extensive applications, such as eye-safe laser radars, remote sensing, atmosphere pollution monitoring, etc.[1– 3] The 2.0-μ m lasers based on the 5I7→ 5I8 transition of Ho3+ ions have been investigated in some crystalline materials, [4, 5] and the fiber laser performances have been studied in tellurite, oxyfluoride, and silica fibers.[6– 8]
Because the absorption band of the Ho3+ ion are mainly located in a range from 400 nm to 700 nm with a small absorption cross section, it is difficult to choose a favorable laser diode (LD) to pump the Ho3+ singly doped material. As is well known, the Yb3+ ions can be used as an effective sensitizer for the Er3+ ion because of the strong absorption of 980-nm transition from 2F7/2 to 2F5/2 and well matching between Yb3+ :2F5/2 and Er3+ :4I11/2 energy levels. Actually, the Ho3+ :5I6 is very close to the Yb3+ :2F5/2 from the energy level diagram, it is proposed that the Yb3+ should transfer energy to Ho3+ through the transition of 2F5/2→ 5I6. The performance between Ho3+ and Yb3+ has been demonstrated in previous studies.[9, 10]
As the rapid multiphonon effect, [11] the luminescence of Ho3+ is easily quenched when it is doped in traditional oxide glass due to its high phonon energy. It is necessary to explore new host material with low phonon energy. Compared with the traditional oxides, the fluoride host crystals have a long lifetime with the excited electronic states. There have been some studies conducted about the properties of Ho3+ /Yb3+ co-doped glasses and crystals.[12] Due to the low phonon energy of the matrix, good chemical– physical performance, and high doping concentration for trivalent rare-earth ions which take the place of the Y3+ ions, the LiYF4 single crystal is preferred to be used as solid material for the mid-infrared laser. However, there are rare studies on 2.0-μ m emission in Ho3+ /Yb3+ co-doped LiYF4 crystal.
In this work, Yb3+ and Ho3+ singly-doped, and Ho3+ /Yb3+ co-doped LiYF4 crystals are grown by the Bridgman method, and Yb3+ as the sensitizer is introduced into LiYF4 crystal to improve the pump efficiency of 980-nm diode laser. By analyzing the fluorescence characteristics, the mechanisms for 2.0-μ m emission in Ho3+ /Yb3+ co-doped LiYF4 crystal and the energy transfer processes between Yb3+ and Ho3+ are understood.
2. ExperimentThe Ho3+ /Yb3+ co-doped and Yb3+ singly doped LiYF4 crystals were grown by the Bridgman method. The molar compositions of the raw materials were 51.5LiF– (47.5− x)YF3– 1.0HoF3– xYbF3 (x = 0, 2.0, 4.0, 6.0, 8.0) and 51.5LiF– 46.5YF3– 2YbF3. The obtained samples were designated respectively as LFHY0, LFHY2, LFHY4, LFHY6, LFHY8, and LFY2. Each sample was mixed and ground adequately for 50 min in a mortar. In order to obtain anhydrous Ho3+ /Yb3+ co-doped LiYF4 polycrystalline materials, each mixed powder was put into apparatus for the anhydrous process for about 5 h– 6 h at 760° C– 780 ° C in a dried HF condition. The polycrystalline materials were put into some Pt sealed crucibles, and then placed in a Bridgman furnace for crystal growth. The temperature gradient of the solid– liquid interface was measured to be 40 ° C/cm– 50 ° C/cm. The detailed processes for crystal growth are described elsewhere.[13, 14]
The grown crystal with about ϕ 10 mm× 78 mm was shown in Fig. 1(a). The crystal was sliced into pieces and polished to about 2.2-mm-thickness for the optical performance measurements. The polished slice of crystal was also shown in the right of the inset. The structures of crystals were measured by the use of an XD-98X diffractometer (XD-3, Beijing) for x-ray diffraction. The concentrations of Ho3+ and Yb3+ in these samples are listed in Table 1, and detected severally with inductively coupled plasma atomic emission spectroscopy (ICP-AES, PerkinElmer Inc., Optima 3000). The absorption spectrum was investigated with a Cary 5000 UV/VIS/NIR spectrophotometer in a wavelength range from 200 nm to 2500 nm. The emission spectrum was recorded under the excitation of 980-nm LD by a Triax 320 type spectrometer with a range of 1000 nm– 3000 nm. The fluorescence lifetime was obtained with the FLSP920 fluorescence spectrophotometer. All these measured data were obtained at room temperature atmosphere in the same conditions.
Table 1.
Table 1.
 Table 1. Concentrations of Ho3+ ions and Yb3+ ions in these samples (mol%).| Samples | LFHY0 | LFHY2 | LFHY4 | LFHY6 | LFHY8 | LFY2 |
|---|
| Ho3+ | 0.98 | 0.99 | 0.98 | 0.97 | 0.97 | 0 | | Yb3+ | 0 | 1.96 | 3.92 | 5.90 | 7.88 | 1.97 |
| Table 1. Concentrations of Ho3+ ions and Yb3+ ions in these samples (mol%). |
3. Results and discussion3.1. The x-ray diffractionFrom Fig. 1(b), x-ray diffraction (XRD) measurement at room temperature of Ho3+ /Yb3+ co-doped LiYF4 crystal (LFHY8) is presented. The other samples also show a similar XRD pattern. Compared with those of the JCPDS card (77-0816) of LiYF4, the relative intensity and diffraction locations of the crystal sample are almost the same in the XRD spectrum. The similar XRD patterns demonstrate that all the crystals have been almost crystallized into a pure tetragonal phase, and neither an obvious peak shift nor a second phase is caused at this doping level. The cell parameters are calculated to be a = b = 0.5162 nm and c = 1.0735 nm for sample LFHY8.
3.2. Absorption and emission spectrumThe absorption spectra of Ho3+ singly doped (LFHY0) and Ho3+ /Yb3+ co-doped (LFHY8) LiYF4 crystals from 300 nm to 2200 nm are shown in Fig. 2. It could be seen for both LFHY0 and LFHY8 samples, seven absorption peaks at 412, 446, 481, 539, 639, 1144, and 1936 nm, which correspond to Ho3+ transitions from the 5I8 ground state to 5G5, 5G6, 5F3, 5F4− 5S2, 5F5, 5I6, and 5I7 excited states. It is also observed that a very intense absorption peak at 980 nm of Yb3+ ion, which relates to the Yb3+ transition that the ground state 2F7/2 transits into an excited state 2F5/2, appears in the LFHY8 sample. The intense absorption peak corresponding to nearly 980 nm demonstrates that Yb3+ acts as an excellent sensitizer to absorb the pump light. Apparently, the co-doped sample LFHY8 does not change the level positions and the shapes of the absorption peaks compared with the singly doped LFHY0 sample.
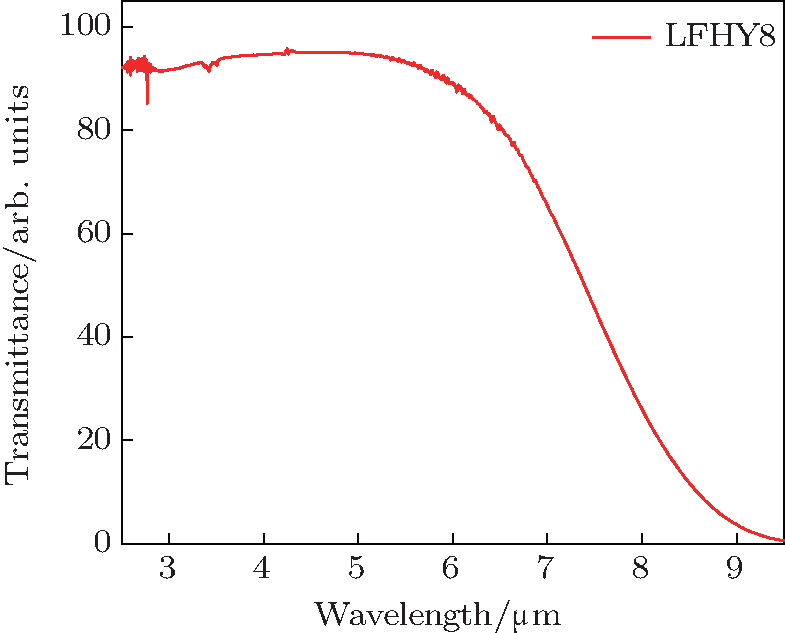
The infrared transmittance spectrum in a wavelength range of 2500 nm– 6000 nm for sample LFHY8 with 2.3 mm in thickness is shown in Fig. 3. It can be observed from the spectrum that the maximum transmittance reaches up to 91.8%, which indicates that oxide and oxyfluoride compounds are almost inexistent in the sample. A very weak absorption band of the OH− ions at 2751 nm is observed. The absorption coefficient of the OH− vibration peak at 2751 nm describes the quantity of OH− groups, and can be calculated to be 0.128 cm− 1. It is noted that the transmittance at ∼ 2 μ m is about 91%, indicating that the LiYF4 crystal has high transparency and scarce absorption for the light.
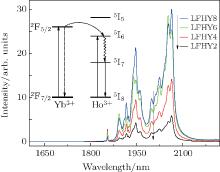
Figure 4 shows the emission spectra of Ho3+ /Yb3+ co-doped LiYF4 crystals with different concentrations under excitation at 980-nm LD in the same condition. A strong emission band from 1850 nm to 2150 nm, centered at 2000 nm, which is attributed to the transition 5I7→ 5I8 of Ho3+ , is obtained. However, the 1.66-μ m emission band associated with the transition 5I5→ 5I7 of Ho3+ almost disappears due to the lack of efficient energy transfer channels to populate Ho3+ :5I5 in the 980-nm LD. From the emission spectra it follows that the 2.0-μ m emission intensity is strengthened with the concentration of Yb3+ ions increasing from 2 mol% to 8 mol%. In this study, the maximum emission intensity at ∼ 2.0 μ m is produced by the sample with a concentration of ∼ 8-mol% Yb3+ and 0.98-mol% Ho3+ ions (LFHY8). There appears to be no quenching effect at that doping concentration of Yb3+ ions. It indicated that the LiYF4 crystal is very favorable for Yb3+ /Ho3+ incorporation to obtain high emission intensity.
The inset of Fig. 4 shows the energy level scheme and the relevant energy transfer channels between the Yb3+ ions and Ho3+ ions. The possible mechanism of the energy transfer processes between Yb3+ and Ho3+ has also been reported elsewhere.[15] Compared with those of Ho3+ /Yb3+ -doped fluorophophate glass, [9, 15] the emission spectra have many peaks at ∼ 2.0 μ m which are corresponding to Ho3+ transitions that the 5I7 energy levels split into the energy levels of the 5I8 ground state, and they appear to be sharper.
The Yb3+ ions are pumped from the 2F7/2 ground state to an excited state 2F5/2 under the excitation of 980-nm LD, and then the energy is transferred to the level 5I6 of Ho3+ ions. The processes are as follows:

The above energy transfer is a phonon-assisted energy transfer process due to the energy mismatch between the Yb3+ :2F5/2 and Ho3+ :5I6 levels. Some phonons are needed in such an energy transfer process. Most ions on the 5I6 state of the Ho3+ level mainly non-radiatively decay to the 5I7 state of the Ho3+ level, and then to the 5I8 state with 2.0-μ m emission. Figure 5 shows the changes of emissions at 1945 nm, 2023 nm, and 2063 nm with concentration ratio between Yb3+ and Ho3+ ions, in which the Ho3+ concentration is kept at ∼ 0.98 mol%. It is clearly shown that the fluorescence intensities of these samples in the region of near 2.0 μ m are the maximum values when the concentration ratio between Yb3+ and Ho3+ ions reaches 8. It is indicated that the Ho3+ ions can be successfully sensitized by the co-doped Yb3+ ions, achieving the 2.0-μ m emission in LiFY4 crystal.
3.3. Fluorescence decay and energy transfer efficiencyThe stimulated emission cross section of laser crystal is one of the important parameters in evaluating the quality properties of a laser. The 2.0-μ m emission cross section (σ em) of 5I7→ 5I8 transition can be calculated by the McCumber theory.[16] The free energy (ε ) of the 5I7→ 5I8 transition is 5153 cm− 1. The maximum emission cross section in the Ho3+ /Yb3+ co-doped LiYF4 crystal (LFHY6) at 2.0 μ m reaches 1.08× 10− 20cm2, which is higher than Ho3+ single-doped LiYF4 crystal (0.51× 10− 20cm2).
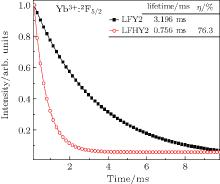
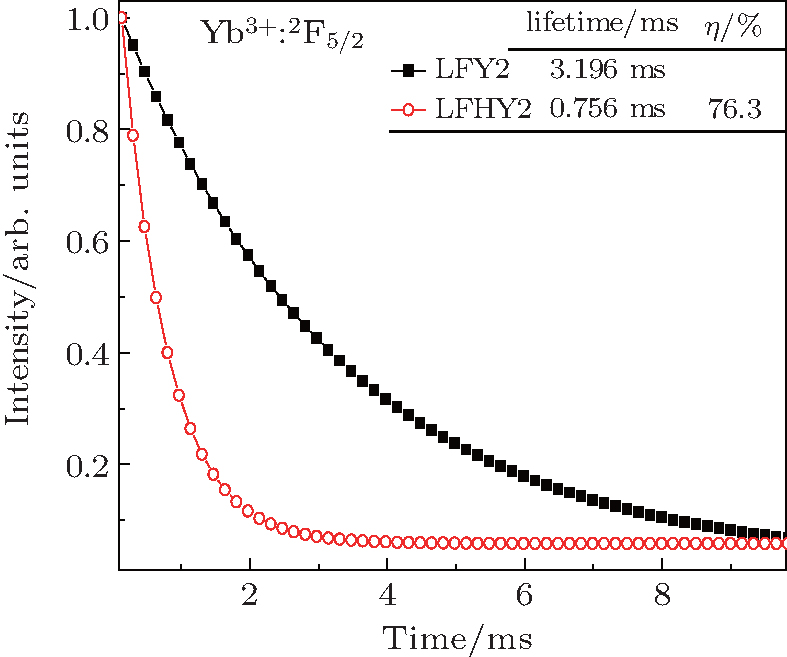
The fluorescence decay curves for 2F5/2→ 2F7/2 transition of Yb3+ at 1019 nm in the Yb3+ single-doped sample and Ho3+ /Yb3+ co-doped samples under the excitation of 940-nm LD are measured to detect the dynamics of energy transfer processes between the Yb3+ ions and Ho3+ ions. Figure 6 shows the fluorescence decay curves of LFY2 and LFHY2 samples. From the decay curves, the average fluorescent lifetime can be calculated by the following formula:[17]
where I(t) represents the luminescence intensity as a function of time t. The measured lifetime of Yb3+ :2F5/2 decreases from 3.196 ms for the Yb3+ singly doped LiYF4 crystal (LFY2) to 0.756 ms for the Ho3+ /Yb3+ co-doped LiYF4 crystal (LFHY2), indicating that the energy transfers from the Yb3+ ions to Ho3+ ions.
The energy migration process strongly dominates the energy transfer from the Yb3+ ions to Ho3+ ions. The energy transfer rate WET is related to the effective lifetime by[18]

where τ is the lifetime of the Yb3+ :2F5/2 level in the Ho3+ /Yb3+ co-doped LiYF4 crystals, and τ s is the lifetime of the Yb3+ :2F5/2 level in single-doped LiYF4 crystal. The energy transfer efficiency of η of Yb3+ can be calculated by the lifetime values from

The fluorescence decay curves at 1019 nm are monitored, the obtained energy transfer rate (WET) and energy transfer efficiency (η ) of Yb3+ :2F5/2 are 1008 s− 1 and 76.3%, respectively.
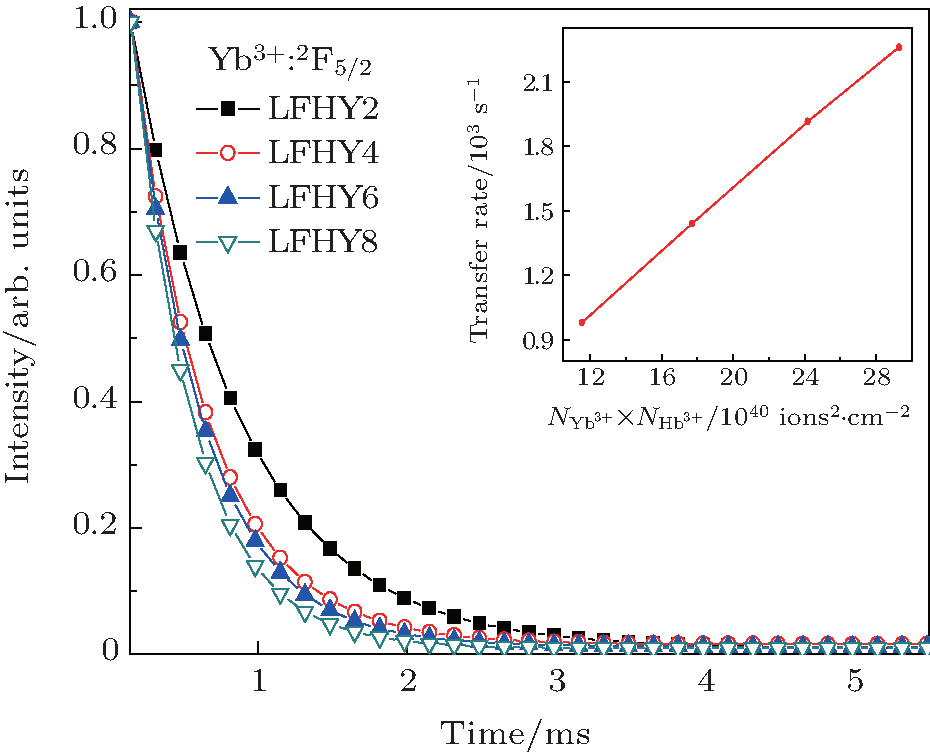
Figure 7 shows the fluorescence decay curves of samples doped with different concentrations. The Yb3+ :2F5/2 level decay curves in the four samples present nearly singular exponential behaviors. The fluorescence decay lifetime increases with the decrease of Yb3+ ion concentration. It is most likely to be due to the fact that the higher concentration induces self-quenching in the excited energy migration-assisted energy transfer process.
The inset of Fig. 7 exactly describes the relationship of energy transfer rate WET with the concentration of Yb3+ ions and Ho3+ ions. The energy transfer rate WET in the co-doped crystal can be described as

where a is a constant equal to a= 0.85× 10− 38 cm6· s− 1 in the present crystal.[18] The energy transfer rate shows the linear dependence on the product of Yb3+ and Ho3+ ions concentration.
The lifetimes of samples LFHY2, LFHY4, LFHY6, and LFHY8 are listed in Table 2, the values of WET are calculated by Eq. (4), and the values of τ s are computed by Eq. (2). The energy transfer efficiencies in samples LFHY2, LFHY4, LFHY6, and LFHY8 are calculated to be 74.0%, 81.7%, 86.8%, and 88.9% respectively. The high energy transfer efficiency from Yb3+ to Ho3+ enhances the population of 5I7 of the Ho3+ level. It is beneficial for achieving an enhanced 2.0-μ m emission in LiYF4 crystal.
Table 2.
Table 2.
Table 2. Values of lifetime at 1019 nm, energy transfer rate, and calculated values (τ s) of samples LFHY2, LFHY4, LFHY6, and LFHY8.| Samples | LFHY2 | LFHY4 | LFHY6 | LFHY8τ s/ms |
|---|
| τ /ms | 0.756 | 0.567 | 0.453 | 0.393 | | WET/s− 1 | 978.7 | 1440.1 | 1915.6 | 2261.9 | | τ s/ms | 2.906 | 3.091 | 3.426 | 3.538 |
| Table 2. Values of lifetime at 1019 nm, energy transfer rate, and calculated values (τ s) of samples LFHY2, LFHY4, LFHY6, and LFHY8. |


 , Jiang Yong-Zhang