


Hydrothermal synthesis of Yb3+, Tm3+ co-doped Gd6MoO12 and its upconversion properties*
[Di Qiu-Mei, Sun Yu-Mei, Xu Qi-Guang, Han Liu, Xue Bing, Sun Jia-Yue† ]
]
]
|
|


†Corresponding author. E-mail: jiayue sun@126.com
*Project supported by the National Natural Science Foundation of China (Grant No. 20976002), the Beijing Natural Science Foundation, China (Grant No. 2122012), the Key Projects for Science and Technology of Beijing Education Commission, China (Grant No. KZ201310011013), and the Education and Research Fund of Guangdong Province, China (Grant No. 2011B090400100).
Yb3+, Tm3+ co-doped Gd6MoO12 phosphors with different morphologies are prepared by the hydrothermal method. The dendrites present different morphologies (including hexagonal prisms, spindles, and spheres) after changing the pH value and edetate disodium (EDTA) usage. It is found that each of the two factors plays a crucial role in forming different morphologies.
The up-conversion (UC) luminescence is studied. Under 980-nm semiconductor laser excitation, relatively strong blue emission and weak red emission are observed. Finally, the effect of pumping power on the UC luminescence properties and the level diagram mechanism of Gd6MoO12:Yb3+/Tm3+ phosphor are also discussed.
In recent years, much attention has been paid to the infrared-to-visible up-converted luminescence (UCL) in rare-earth (RE) ions-doped phosphors due to their potential applications in biological fluorescent labels, color displays and infrared sensors.[1– 7] These applications are highly dependent on size, morphology, structure, and other fundamental factors which govern the luminescence behaviors.[8] Therefore, the synthesis of materials doped with rare earths has received more and more attention. So far, many reports have been published on the study of RE-doped tungstate and molybdate matrix, due to their highly chemically, photo-thermally, photo-chemically stable properties.[9, 10] These materials were synthesized through various methods, such as the high temperature solid method, the sol– gel method, and the hydrothermal method. The hydrothermal method has the advantages in preparing various inorganic materials, such as less pollution, higher homogeneity and purity, and more controllable morphologies.[11– 13] The variations of conditions in the synthesis process, such as pH, annealing temperature, and the addition of different chelators (citric acid or EDTA) may result in the formation of different morphologies of the final samples, and may further influence the phosphor luminescence properties.
Here in this paper, Yb3+ , Tm3+ co-doped Gd6MoO12 powders are synthesized via a hydrothermal method. The samples are characterized by x-ray diffraction (XRD), scanning electron microscopy (SEM), thermogravimetry — differential thermal analysis (TG-DSC), and upconversion (UC) emission spectra.
The Gd5.74MoO12:0.25Yb3+ , 0.01Tm3+ samples were prepared by the hydrothermal method. The starting materials were (NH4)6Mo7O24· 4H2O (99.0%), Tm2O3 (99.99%), Gd2O3 (99.99%), Yb2O3 (99.99%), HNO3(65%– 68%), and C10H4N2O8Na2· 2H2O (EDTA) (A.R.). All chemicals were directly used without further purification.
The Tm3+ /Yb3+ co-doped Gd6MoO12 was synthesized by a facial solution phase precipitation reaction. In a typical synthesis, solutions of Tm (NO3)3, Yb (NO3)3, and Gd (NO3)3 were prepared by dissolving stoichiometric Tm2O3, Gd2O3, and Yb2O3 separately in dilute HNO3 as stock solutions, respectively. EDTA and Mo6+ were obtained by dissolving stoichiometric C10H4N2O8Na2· 2H2O and (NH4)6Mo7O24· 4H2O powder separately in the deionized water (
The structures of the phosphors were analyzed on a Shimadzu model XRD-6000 x-ray powder diffraction with Cu Kα radiation, 40 kV, 30 m A. The XRD patterns were recorded in the range of 18° < 2 θ < 80° . Its room temperature upconversion emission spectra were recorded by using a FluoroLog-3 spectrophotometer (HORIBAJOBINYVON USA) equipped with an external power-controllable 980-nm semiconductor laser. The morphologies of the samples were recorded using a scanning electron microscope (SEM, JEOL and JSM-6490). Thermogravimetry — differential thermal analysis (TG-DSC) was performed on a Setaram TGA 92 TG-DSC instrument at a heat rate of 10 ° C/min from room temperature to a maximum temperature of 950 ° C.
The typical XRD patterns of the prepared products A, B, C are shown in Fig. 1(a). The diffraction peaks of samples obtained under different conditions can be exactly assigned to the pure Gd6MoO12 crystal [JCPDS Card: No. 24-1085], indicating that the crystal lattice and basic structure of the Gd6MoO12 host can be obtained by the above method.
 | Fig. 1. (a) The x-ray diffraction patterns of Gd6MoO12:Yb3+ /Tm3+ samples obtained under different conditions: (i) pH = 3, (ii) pH = 9, (iii) pH = 3/EDTA; SEM images of Gd6MoO12:Yb3+ /Tm3+ samples obtained at different conditions: (b) pH = 3, (c) pH = 9, and (d) pH = 3/EDTA. |
Figure 1 shows the SEM images of the Gd5.74MoO12:0.25Yb3+ , 0.01Tm3+ samples under different synthesis conditions. Figure 1(b), obtained at a pH value of 3, presents the morphology of long hexagonal prism with an average length of about 50 μ m. When the pH value is 9, the spindle-like shape is obtained as shown in Fig. 1(c). The above information indicates that the pH values are responsible for the uniform morphologies.
The crystal growth process has already been studied a lot in the past decades.[14– 16] The high ratio of height to side length indicates that the growth rate of the prismatic facets is quicker than that of top and bottom facets in an acidic condition. As in an alkalinity condition, the spindle shape appears and the average size becomes smaller. This may be due to the fact that the growths of the length and the side facets have been prevented in the alkalinity condition. The shape changing can be explained as controlling the relative growth rates in different directions by varying pH values.
Here, EDTA is selected as the chelator due to its efficiency in controlling the crystal morphologies.[17, 18] The structure stability coefficient of EDTA with Ln3+ ions is larger than that of citric acid, ascribing to its six binding sites and ring-like space structure.[19] As shown in Fig. 1(d), sphere-like morphology with an average length of about 5 μ m can be seen, which is obtained by mixing EDTA into the solution with a pH value of 3. The sphere-like particle appearance indicates that the sequestering effects of EDTA on all directions are completely uniform. The synthesized crystals above are all comprised of the same lanthanide dopants.
In a word, the differences in growth rate among various crystal facets result in the different morphologies of the crystallite. The relatively fast rate of crystal growth has the smaller area of crystal facet perpendicular to this growth direction.[5]
To further study the annealing influences on the morphology and structure, sample D is obtained by annealing sample A at 700 ° C for 4 h. The XRD pattern of sample D is shown in Fig. 2(a). The phase peaks are consistent with the standard data of Gd6MoO12, indicating that the Gd6MoO12 crystal is obtained successfully. The SEM image of sample D is shown in Fig. 2(b). The relatively small size of grain in sample D compared with the size of grain in sample A indicates that the heating process breaks the crystal to some extent. In addition, by comparing the XRD patterns with those of sample A in Fig. 1, we can observe that sample D has stronger peaks and narrow phase width, which implies much higher crystallinity than in sample A.
 | Fig. 2. (a) XRD patterns of sample D; (b) the SEM image of sample D. |
The TG-DSC analysis is made to understand the crystallization process of the precursor A from room temperature to a maximum temperature of 950 ° C.
As shown in Fig. 3, the weight loss of sample A occurs with increasing temperature up to about 665 ° C. Based on the DSC curve, the decomposition and crystallization processes of the precursor can be divided into three stages. The first stage is from 50 ° C to 275 ° C, in which the sample loses 2% gross weight. This stage is corresponding to the volatilization of the absorbed water and the decomposition of the precursors.[11] The second stage shows a large loss of 15% when temperature increases from 275 ° C to 665 ° C. In this stage, the mass loss should correspond to the decomposition of metal nitrates hydrates in the starting materials. On the curve, an obviously exothermic peak appears at a temperature of 330 ° C, which is attributed to the decomposition of 1.5Gd(NO3)3· 3.5H2O· GbONO3 and Yb(NO3)3· H2O· YbONO3. Another exothermic peak at a temperature of 437 ° C is ascribed to the decompositions of GdONO3 and YbONO3.[20, 21] The strong exothermic peak at about 635 ° C corresponds to the ending temperature of the large weight loss region. The large endothermic peak at 654 ° C indicates that the new crystal phase begins to form at this temperature. In the third stage, the weight begins to keep invariable when the temperature exceeds 665 ° C, which implies that the precursor decomposition and reaction have been completed and the crystal phase of Gd6MoO12 has formed.
 | Fig. 3. TG-DSC curves of Gd6MoO12:Yb3+ /Tm3+ (sample A). |
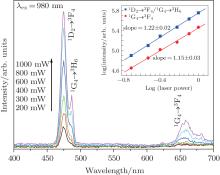
Figure 4 shows the UCL spectra and the morphologies of samples synthesized under different conditions. The dendrites display a prism, spindle, and sphere respectively, with sizes decreasing sequentially from sample A to sample C. Under the excitation of 980 nm, by comparing the UCL spectra of samples A, B, and C, we can see that with the particle size of the phosphors increasing, its UCL intensities increase dramatically. We know that the particle size of the phosphor can affect the upconversion luminescence intensity.[22, 23] This phenomenon may be attributed to the relatively large surface-to-volume ratio and few inner defects of microcrystals compared with those of bulk materials. In addition, the prisms have higher crystallinity and lower defect concentration than spheres and spindles, which also contribute to its stronger red and blue emission. Since “ defects” are produced in the preparation process, which act as quenching centers (traps), when an excited luminescent center is in the vicinity of a trap, the excited energy can be transferred easily to the trap non-radiatively, [19] giving rise to the decreasing of luminescence intensity. When precursor A is annealed at a temperature of 700 ° C for 4 h, sample A is obtained. Its crystal structure is broken as shown in Fig. 4(d). Meanwhile, the slight agglomerate phenomenon occurs, which is caused by the heating process, resulting in the further enhancement of the UC emission.
 | Fig. 4. UCL spectra pumped by a 980-nm diode laser for Gd6MoO12:0.25Yb3+ /0.01Tm3+ synthesized under different conditions: (a) pH = 3; (b) pH = 9; (c) pH = 3/EDTA; (d) annealed at the temperature of 700 ° for 4 hours of sample A. |
 | Fig. 5. Power dependences of UCL intensities of 1G4 → 3H6, 1D2 → 3F4, and 1G4 → 3F4 emissions of sample A under 980-nm diode laser pump. |
To understand the effect of pump power density on luminescence properties, the pump power-dependent UC curves are given in Fig. 5. The two-photon process corresponding to the red emission, has been discussed in many reports.[24] However, the calculated blue emission is a two-photon process, which is different from the typical three-photon process. This may be due to the competition between the linear decay and up conversion of the excited states, resulting in n becoming smaller than the theoretical value under high excited pump power.[25, 26]
The mechanisms of Yb3+ as a sensitizer and Tm3+ as an activator UC luminescence system have been discussed widely in many researches.[27– 29] The relative diagram can be seen in Fig. 6. The Yb3+ ion is a good sensitizer which can greatly enhance UC efficiency through energy transfer.[30] The three-photon process of blue emission produced by Tm3+ can be explained by the three successive energy transfers from Yb3+ to Tm3+ and the two-photon process of red emission can be explained by the two successive energy transfers from Yb3+ to Tm3+ . According to the Suyver et al. report, [26] the value of n deviating from the typical data is due to the competition between the linear decay and up conversion of the excited states. For blue emission, the value of n is 3, indicating the linear decay of the intermediate state is dominant. While n is 1 or 2, the UC is dominant in the Yb3+ /Tm3+ co-doped system.[31] The red emission follows the same regularity.
 | Fig. 6. Schematic energy levels of Yb3+ and Tm3+ ions in the as-prepared Gd6MoO12:Yb3+ /Tm3+ sample. |
In this paper, Yb3+ /Tm3+ co-doped Gd6MoO12 phosphors are synthesized successfully by the hydrothermal method. When changing the reaction conditions (pH, EDTA), various morphologies are observed, illustrating that the pH values and EDTA both play fundamental roles in the crystal growth. The luminescence properties of the samples are investigated in detail and its corresponding luminescence spectrum is measured and analyzed. Moreover, the results prove that the heating process has an effect on increasing the phosphor’ s crystallinity and producing an agglomerate phenomenon, further enhancing the UC emission. Finally, the mechanism of the UC luminescence is given. We believe that the work could provide some useful information for future research.
| 1 |
|
| 2 |
|
| 3 |
|
| 4 |
|
| 5 |
|
| 6 |
|
| 7 |
|
| 8 |
|
| 9 |
|
| 10 |
|
| 11 |
|
| 12 |
|
| 13 |
|
| 14 |
|
| 15 |
|
| 16 |
|
| 17 |
|
| 18 |
|
| 19 |
|
| 20 |
|
| 21 |
|
| 22 |
|
| 23 |
|
| 24 |
|
| 25 |
|
| 26 |
|
| 27 |
|
| 28 |
|
| 29 |
|
| 30 |
|
| 31 |
|