
Preparation and piezoelectric properties of potassium sodium niobate glass ceramics
[Jiang Shana) , Wang Xuan-Mingb) , Li Jia-Yuc) , Zhang Yonga) , Zheng Taoa) , Lv Jing-Wena)†  ]
]
]
|
|


†Corresponding author. E-mail: ljwcc@126.com
This paper describes the preparation of a piezoelectric glass ceramic material from potassium sodium niobate (K0.5Na0.5NbO3; KNN) using a novel melting method. The effects of the subsequent heat-treatment on the optical, thermal, electrical, and mechanical properties of the material are carefully examined, and its crystal structure and surface morphology are characterized respectively by x-ray diffraction and scanning electron microscopy. This new material has a much higher piezoelectric coefficient (163 pC·N−1) than traditional piezoelectric ceramics (131 pC·N−1). On this basis therefore, a strategy for the future study and development of lead-free KNN-based piezoelectric glass ceramics is proposed.
Piezoelectric materials are a unique class of functional material that can convert mechanical energy into electric energy, and vice versa.[1, 2] They are widely used in military hardware, [3, 4] commercial applications, [5, 6] medicine, [7] sensors, [8] and various other fields.[9, 10] However, the piezoelectric ceramic transducer (PZT) has so far not equaled the lead-free piezoelectric material in performance. There is therefore clearly substantial interest in improving the efficiencies of lead-free piezoelectric materials, as oxide materials based on alkali metal niobium compositions (niobate-based materials) prove particularly attractive in this context.
Lead-free piezoelectric glass ceramics with a perovskite structure have emerged as cutting-edge materials due to their superior piezoelectric properties. However, despite numerous reports on piezoelectric crystals and ceramics, very little research has been devoted to piezoelectric glass ceramics. Zhou et al.[11] have prepared lead-free 0.9(K0.5Na0.5)NbO3-0.1LiSbO3 piezoelectric ceramics with a dielectric constant as high as 131 using a conventional solid-state reaction method. Eliminating stomata in this ceramic proved difficult however due to the reduction in breakdown strength induced by sintering. Meng et al.[12] successfully synthesized a lead-free sodium potassium niobate piezoelectric ceramic powder using solid-phase sintering, and discovered that the dielectric constant is maximal for a potassium:sodium ion ratio of 1:1. Nevertheless, the reduction in the density after sintering and the numerous stomata and defects greatly affected the polarization voltage, resulting in a relatively low maximum dielectric constant. In the present study, potassium sodium niobate piezoelectric glass ceramics (K0.5Na0.5NbO3; KNN) are prepared using a novel melting method, therefore the glass is first melted at high temperature and then heat-treated to separate the KNN crystals. Continuously heating the glass encourages the growth of KNN crystals, ultimately producing a KNN glass ceramic. Unlike conventional preparation methods, this new approach prevents the stomata from forming and leads to increases in the breakdown strength, piezoelectric coefficient, and dielectric constant. Furthermore, by controlling the duration of the heat treatment, the transparency of the KNN piezoelectric glass ceramic can be adjusted for optoelectronic applications.
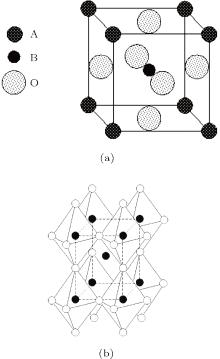
As illustrated in Fig. 1, the lattice of orthorhombic potassium sodium niobate is defined by the space group 
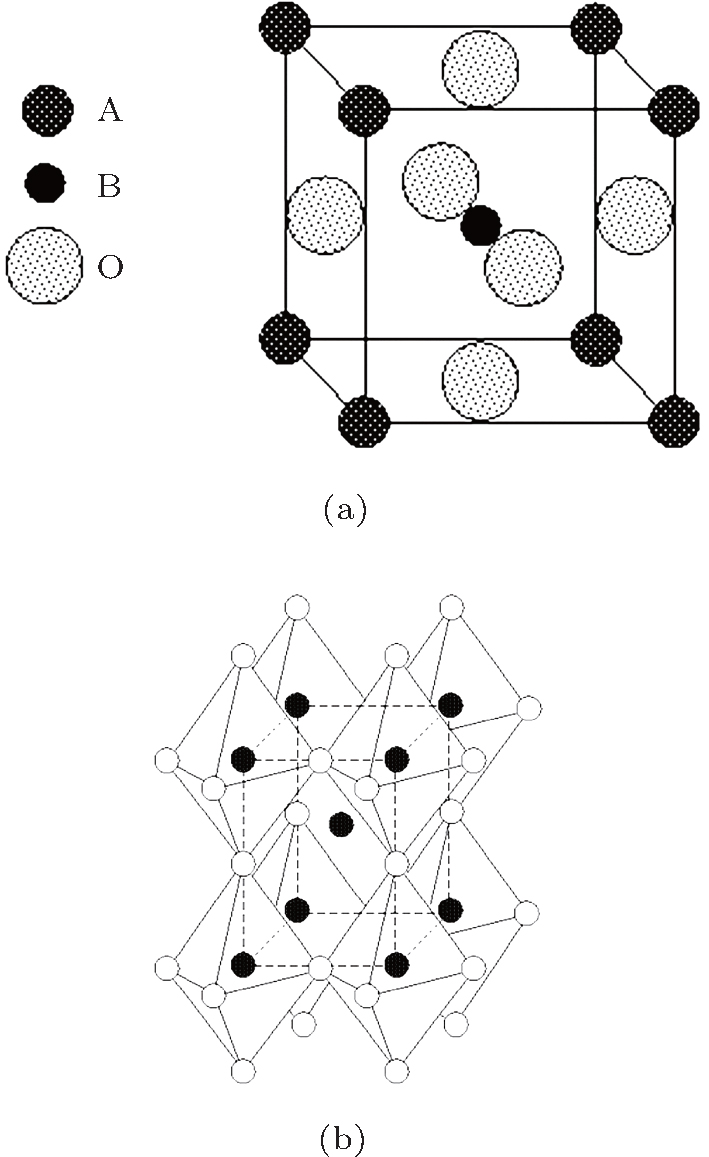 | Fig. 1. Ideal perovskite structure: (a) unit cell, (b) greater cell structure. |
Piezoelectric materials have been widely used and studied, with niobate generally considered as being the most representative of the lead-free piezoelectric materials. The sodium potassium niobate material used in this study possesses excellent piezoelectric performance but its commercialization has so far been limited by the formation of stomata and the current market dominance of lead-based piezoelectric materials. Furthermore, although piezoelectric single crystals offer the best performance, the long cycle time, high resource cost, and high failure rate associated with their growth tends to make mass production prohibitively expensive. Most researchers have therefore shifted their focus towards piezoelectric ceramics, among which the niobate system considered in this study is of particular interest.
To prepare the (KxNa1− x) NbO3 glass ceramics, various ratios of analytical grade SiO2, K2CO3, NaNO3, Nb2O5, H3BO3, and Sb2O3 precursors were used as received. With SiO2 content values being greater than 45 mass%, the melting temperature and viscosity of the glass were found to increase, leading to the formation of small bubbles that proved difficult to remove. With SiO2 content values being less than 35 mass% on the other hand, the KNN glass devitrified too readily. The SiO2 content was therefore maintained between 35 mass% and 45 mass%. A small amount of Sb2O3 was added to reduce the number of air bubbles in the glass and to reduce (increase) its viscosity (transparency). The K+ :Na+ molar ratio was 1:1, while the molar ratio of (K+ + Na+ ):Nb5+ was maintained at between 1.5:1 and 2.5:1. An appropriate amount of boric acid was used to reduce the viscosity of the glass. After grinding in a mortar, the KNN mixture was transferred to a crucible and placed in a silicon carbide resistance furnace where it was melted at 1440 ° C for 30 min. Next, the liquid KNN glass was poured onto a heated iron plate, placed in a muffle furnace, and annealed at 500 ° C to obtain a transparent KNN glass.
The thermal expansion coefficient of the transparent KNN glass sample was measured using an M311735 instrument at a heating rate of 4 K/min, from which the heat-treatment temperature of the KNN glass was determined. The glass samples were then heated in a silicon carbide resistance furnace at a temperature of 750 ° C for 2, 4, 6, or 8 h to yield four different types of KNN glass ceramics.
The surface morphology of the heat-treated KNN glass ceramic samples was observed by scanning electron microscopy (SEM) using a JSM-6701F machine, while their crystal structure was determined by x-ray diffraction (XRD) using an Ultima IV diffractometer. These results were used to determine the relationship between the heat-treatment duration and the microstructure of the material, while the particle diameter (D) was found to be less than 50 nm using the Scherrer formula

where λ is the x-ray wavelength (in unit Å ), and β is the full width at half maximum (° ) of the diffraction peak at an angle θ (° ).
After polishing both sides, the KNN glass ceramic samples were processed into 2-mm thick glass blocks with a surface area of approximately 1 cm2 whose permeability, dielectric constant, and piezoelectric coefficient were measured.
The transmittances of the KNN glass ceramics produced in various heat-treatment times were measured by spectrophotometry (Perkin– Elmer– Lambda 900 UV/VIS/NIR) to determine their suitability for photovoltaic applications. For these experiments, both sides of the KNN glass ceramic sheets were plated with conductive silver paste and then placed in a furnace under a nitrogen atmosphere for calcination and annealing. The dielectric constant of each KNN piezoelectric glass ceramic sample was measured using an Agilent-16451B instrument, as per the following equation:

where K is the electrostatic constant (8.988 × 10⁹ N· m2/C2), d is the plate spacing (mm), C is the measured capacitance (pF), and S is the surface area (cm3).
The KNN glass ceramic samples were then placed along with electrodes in an oil bath at 120 ° C, and depolarized by applying a voltage of 3000 V. The dielectric constant and piezoelectric coefficient d33 (pC· N− 1) of the samples (the latter using a ZJ-3AN quasi-static d33 meter) were determined by placing the samples under heating polarization for 20 min.
According to Fig. 2, the glass transition temperature (Tg) and the softening temperature (Tf) of KNN glass are about 628 ° C and 670 ° C, respectively, from which the thermal expansion coefficient α 20 ° C− 300 ° C is calculated to be 91.4748 × 10− 7 ° C− 1. This means that for heat-treatments above 670 ° C, the samples need to be placed on a clean and flat ceramic plate to avoid drastic deformations.
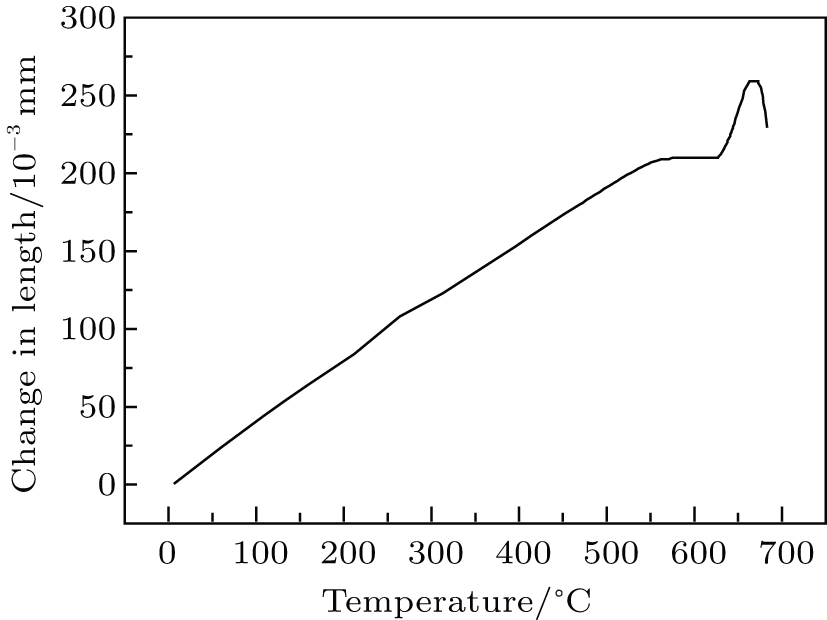 | Fig. 2. Thermal expansion coefficient curve of KNN glass. |
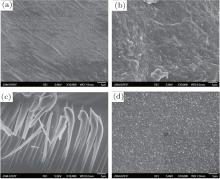
Figures 3(a)– 3(d) show the images of KNN glass ceramic samples treated at 750 ° C for 2, 4, 6, and 8 h, respectively. In Fig. 3(a), the microcrystalline particles are homogeneously distributed across an irregular glass-covered surface, whereas in Fig. 3(b), numerous microcrystalline particles of different sizes appear to grow indiscriminately on the glass. In Fig. 3(c), the irregular particles are arranged in an orderly manner within the sample, with very little glassy phase being evident. This abnormal grain growth is attributed to an obstruction arising from the dispersion of particles or impurities in the second phase during normal grain growth, meaning that the grains tend to coarsen while the relatively fine ones are gradually absorbed by their surroundings. This ultimately results in a very coarse-grained material with unfavorable room temperature mechanical properties.[16] In Fig. 3(d), the particles are much smaller and compact, most likely to be a result of shrinkage due to an excessive crystallization time. Since the interior of the sample is no longer compact, this situation is also detrimental for the physical properties of the glass ceramic. These results therefore show that the most appropriate heat-treatment duration is 4 h.
 | Fig. 3. SEM images of KNN glass ceramics treated at 750 ° C for (a) 2, (b) 4, (c) 6, and (d) 8 h respectively. |
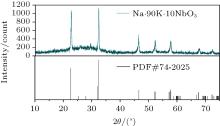
The XRD spectra shown in Fig. 4 confirm the perovskite structure of the KNN glass ceramic heat-treated for 4 h, without any discernible impurities. This is significant as the crystal structure directly affects the transparency of the material and is therefore the key factor (more important than the particle orientation) in determining its optical properties. Moreover, the orientation of the crystallographic axis determines the refractive indices of the material. For example, in a cubic structure, the three main refractive indices on the main axis of the refractive index ellipsoid are equal (i.e., n1 = n2 = n3), so that the structure is optically isotropic with no double refraction.[17] The wavelength and full width at half maximum of the KNN crystal diffraction peak are obtained from these test data.
 | Fig. 4. XRD spectrum of a KNN glass ceramic after 4 h of heat treatment at 750 ° C. |
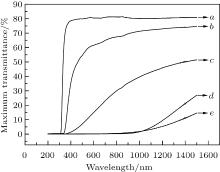
The transmittances of 0.4-mm thick KNN glass ceramic samples heat-treated for different durations are shown in Fig. 5 for wavelengths ranging from 0 to 1500 nm. All the samples are opaque to ultraviolet light (wavelengths less than 390 nm), but the samples treated for 0, 2, or 4 h transmit both visible (390 nm– 780 nm) and infrared light (> 780 nm). In contrast, the samples treated for 6 h or 8 h only transmit infrared wavelengths. A continuous decrease in the overall transmittance is observed with increasing the heat-treatment time, with the highest transmittances for visible light in the samples treated for 0, 2, and 4 h being 79.9%, 52.9%, and 5.5%, respectively. In the infrared range, the highest transmittances for the samples heat-treated for 0, 2, 4, 6, and 8 h are 81.3%, 74.8%, 54.5%, 26.9%, and 14.6%, respectively. This decrease can be attributed to the gradual growth of small grains with increasing the heat-treatment time, which impedes the passage of light, thereby reducing the transmittance. With heat-treatment times of 6 h and 8 h, the small, compact, and uniformly distributed grains render the glass almost completely opaque. The initially colorless and transparent KNN glass was found to become translucent after 2 h– 4 h of heat treatment, but milky and opaque after 6 h– 8 h, which is in agreement with the transmittance results for visible wavelengths.
 | Fig. 5. Variations of transmittance with the wavelength of KNN glass ceramics heat-treated for (curve a) 0, (curve b) 2, (curve c) 4, (curve d) 6, or (curve e) 8 h. |
Table 1 lists the dielectric constants and piezoelectric coefficients calculated and measured for the KNN piezoelectric glass ceramics heat-treated for 2, 4, 6, and 8 h. Note that the maximum dielectric constant obtained here is nearly as high as that of PZT, and significantly higher than that of KNN-based piezoelectric ceramics, suggesting that this KNN piezoelectric glass ceramic could potentially substitute for lead-based piezoelectric materials in the future.
| Table 1. Dielectric constants and piezoelectric coefficients of the proposed KNN piezoelectric glass ceramic. |
A novel glass ceramic is successfully prepared by heat-treating KNN glass at 750 ° C for various durations (2, 4, 6, or 8 h). The analysis of the resulting samples leads to the following conclusions.
(i) KNN glass has a transition temperature of about 628 ° C, a softening temperature of about 670 ° C, and a calculated thermal expansion coefficient of 91.4748 × 10− 7 ° C− 1.
(ii) The optimum heat-treatment time for a KNN glass-ceramic is determined to be 4 h, in which the crystallite size in the glass ceramics is approximately 40 nm. This is consistent with the results obtained by SEM and XRD.
(iii) The highest dielectric constant (ε r = 1974) and piezoelectric coefficient (d33 = 163 pC· N− 1) are obtained for the KNN glass ceramic heat-treated for 4 h.
| 1 |
|
| 2 |
|
| 3 |
|
| 4 |
|
| 5 |
|
| 6 |
|
| 7 |
|
| 8 |
|
| 9 |
|
| 10 |
|
| 11 |
|
| 12 |
|
| 13 |
|
| 14 |
|
| 15 |
|
| 16 |
|
| 17 |
|