1. IntroductionManganese-based orthorhombic ternary compounds aroused lots of fundamental research interest due to their non-collinear magnetic structures which can be tuned by temperature, pressure, and applied magnetic field.[1– 3] One of the most feature-rich materials is MnCoSi which exhibits a field-induced metamagnetic phase transition and associated inversed magnetocaloric effect (MCE).[4] In the MnCoSi compound, the phase transition temperature is highly sensitive to applied field and substitution, and there is a tricritical point in the temperature which is the bound of the first-order (FOMT) and the second-order metamagnetic transition (SOMT).[4– 6] The critical field which initiates the phase transition also depends on temperature. The higher the temperature, the lower the critical field is. As the metamagnetic phase transition is the result of the competition between the ferromagnetism and antiferromagnetism, it is reported that the nearest-neighbor Mn– Mn separation plays a key factor in determining the transition temperature and critical field. There are two different explanations for this phenomenon: the first one says that there will be a metamagntic transition when a crossover between the nearest-neighbor Mn– Mn distance parallel to the bc plane (d1) and the one almost along the a axis (d2) happens, [3] while the second one says that the distance d1 plays a more important role than d2.[7]
The influences of different dopings at Mn and Co sites on the MCE property and phase transition have already been investigated.[8– 10] However, the influences of P substitution in the Si site on the crystal structure and magnetic properties have not been reported. In this paper, results of MnCoSi1− xPx compounds are reported. It is found that there will be a new phase transition at high temperature when x > 0.3 and an explanation for this phase transition is also presented.
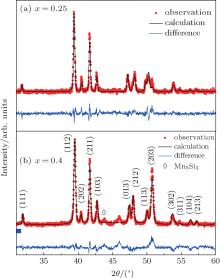
3. Results and discussion3.1. StructureAccording to the results of room temperature XRD, the as-cast ingots with x ≤ 0.3 are single phase with a TiNiSi-type structure (space group Pnma) while an appreciable quantity of impurities with Mn5Si3-type (hexagonal, P63/mcm) structure arises from ingots with x > 0.3, which is common in the TiNiSi-type compounds (as shown in Fig. 1). By dripping the melted alloys into a chilled steel wheel, the following melt spinning and annealing make samples with high P content much purer, although there is still a hint of impurity. Due to the differences in ionic radius and the number of valence electrons between P and Si, P substitution for Si makes the structure unstable and finally leads to the formation of an impurity.[11] Table 1 shows the refined unit cell parameters which change anisotropically with the increase of P content: a increases monotonically while both b and c decrease. The nearest-neighboring Mn– Mn distance[12]d1 decreases from 2.985 Å for x = 0 to 2.929 Å for x = 0.5, while d2 increases from 3.136 Å to 3.155 Å , which is opposite to the scenario in Fe-doped MnCoSi.[10] The reason is P substitutes for larger Si, while Fe substitutes for smaller Co, although they are on different sites. This difference can explain the difference in the magnetic properties between MnCoSi1− xPx and MnCo1− xFexSi and can also make the influence of the lattice on the magnetism clear. Considering the contribution of the metal– metal boding via d orbits to the stabilization of structure and the relationship between TiNiSi-type and Mn5Si3-type structures, the change of MnCoSi1− xPx cell with P concentration and the occurrence of impurity are understandable.[13– 15]
Table 1.
Table 1.
 Table 1. Unit cell parameters and the nearest Mn– Mn distances (d1 and d2) for compounds with x = 0.05– 0.5.| x | a /Å | b /Å | c /Å | V /Å 3 | d1 /Å | d2 /Å |
|---|
| 0.05 | 5.8766 | 3.6924 | 6.8628 | 148.914 | 2.985 | 3.136 | | 0.10 | 5.8823 | 3.6845 | 6.8592 | 148.662 | 2.982 | 3.139 | | 0.15 | 5.8956 | 3.6552 | 6.8310 | 147.205 | 2.965 | 3.143 | | 0.20 | 5.9161 | 3.6203 | 6.8213 | 146.099 | 2.952 | 3.152 | | 0.25 | 5.9183 | 3.6158 | 6.8112 | 145.756 | 2.948 | 3.153 | | 0.30 | 5.9201 | 3.6083 | 6.8032 | 145.327 | 2.943 | 3.153 | | 0.35 | 5.9179 | 3.5974 | 6.7979 | 144.721 | 2.939 | 3.152 | | 0.40 | 5.9236 | 3.5954 | 6.7954 | 144.726 | 2.937 | 3.155 | | 0.45 | 5.9270 | 3.5879 | 6.7942 | 144.482 | 2.935 | 3.156 | | 0.50 | 5.9254 | 3.5765 | 6.7850 | 143.789 | 2.929 | 3.155 |
| Table 1. Unit cell parameters and the nearest Mn– Mn distances (d1 and d2) for compounds with x = 0.05– 0.5. |
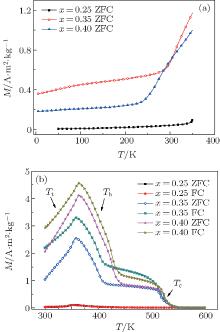
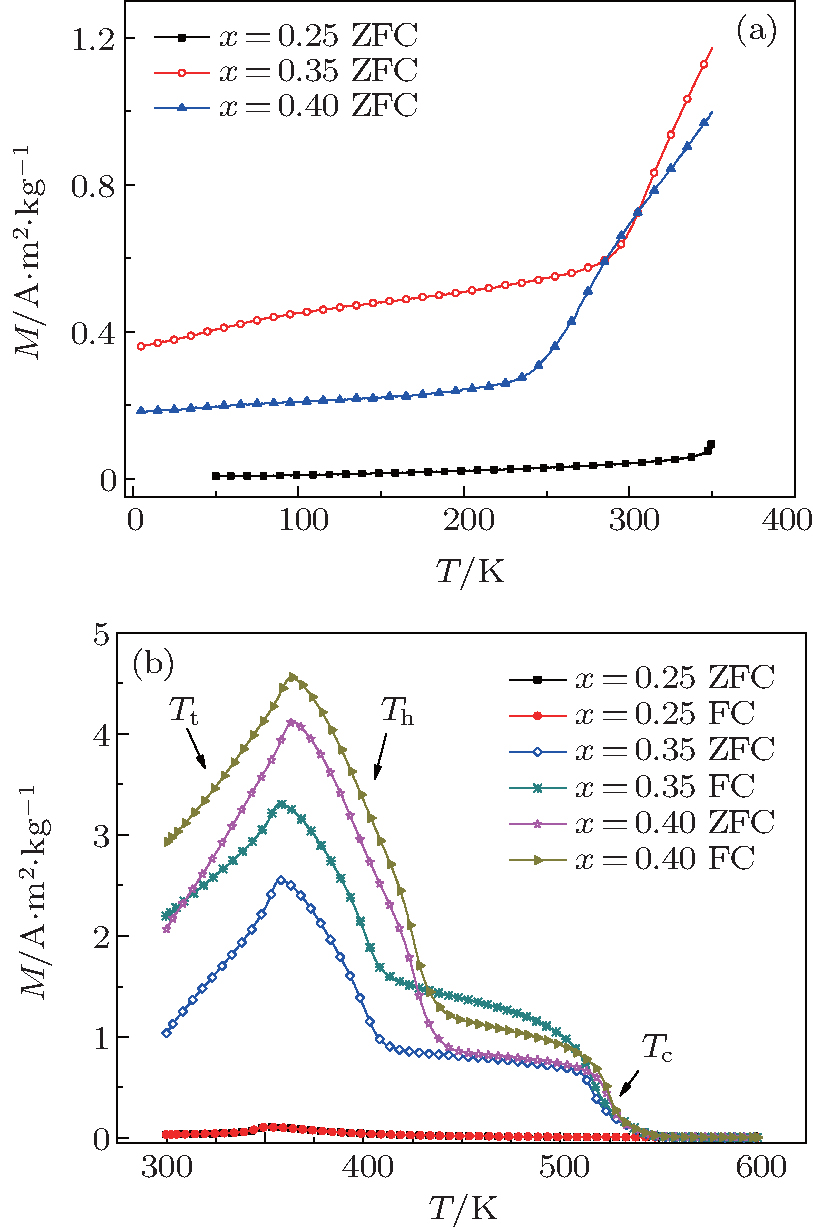
3.2. Magnetic property and phase transitionThermal evolutions of DC magnetization for the compounds are measured from 5 K to 350 K via zero-field cooling (ZFC) and field cooling (FC) at 50 Oe (1 Oe = 79.5775 A· m− 1) using PPMS and the same curves from 50 K to 600 K using VSM. Figure 2 shows the thermomagnetic behavior for compounds with x = 0.25, 0.35, and 0.4: (a) 5 K to 350 K ZFC curves and (b) 300 K to 600 K ZFC and FC curves. The figure clearly shows that the thermomagnetic properties change significantly with the P content: compounds with x < 0.3 show an antiferromagnetic feature indicated by a hump in the M– T curve, while for compounds with x > 0.3 there is a metamagnetic phase transition from non-collinear ferromagnetic state (ferrimagnetic state, FIM) to ferromagnetic state (FM) around 325 K. The reasons for these differences are discussed in the following. The temperature for this metamagnetic transition (indicated as Tt in Fig. 2) decreases with the increase of P concentration. At around 400 K a new phase transition from a higher-magnetization state (FM 1) to a lower-magnetization state (FM 2) is observed in compounds with x > 0.3 (the temperature of this transition is indicated as Th in Fig. 2). The Tt and Th are confirmed by the maximum of ∂ M/∂ T. The Th and the Curie temperature (around 525 K) of the lower-magnetization state increase with increasing the P content. The transition around Tt is an SOMT according to the low thermal hysteresis around Tt, which is coincident with the results reported previously.[4– 6] Difference between the FC and ZFC curves in Fig. 2(b) is the result of domain pinning which is common in ferromagnetic regions of lots of compounds.
According to ab-initio calculations, the nearest neighboring Mn– Mn distance d1 plays a key role in determining the magnetic order in the relevant compounds.[7, 12] The antiferromagnetic state (AFM) prefers an intermediate d1, and the FM state needs a small or large d1. As the ratio of P increases, d1 decreases from an intermediate to a small value. In the critical region, there will be a transition from AFM to FM. This can also explain the decrease of Tt with the increase of x. What is more, when d1 stays in the critical region of AFM and FM where the energy barrier between them is small, there will be an FIM state and that is the reason for the occurrence of FIM for the x > 0.3 samples. Because the metamagnetic transition occurs after (but do not couple with) the abrupt jumps in lattice parameter and Mn– Mn distance, this transition shows a second-order feature.[3]
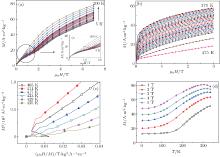
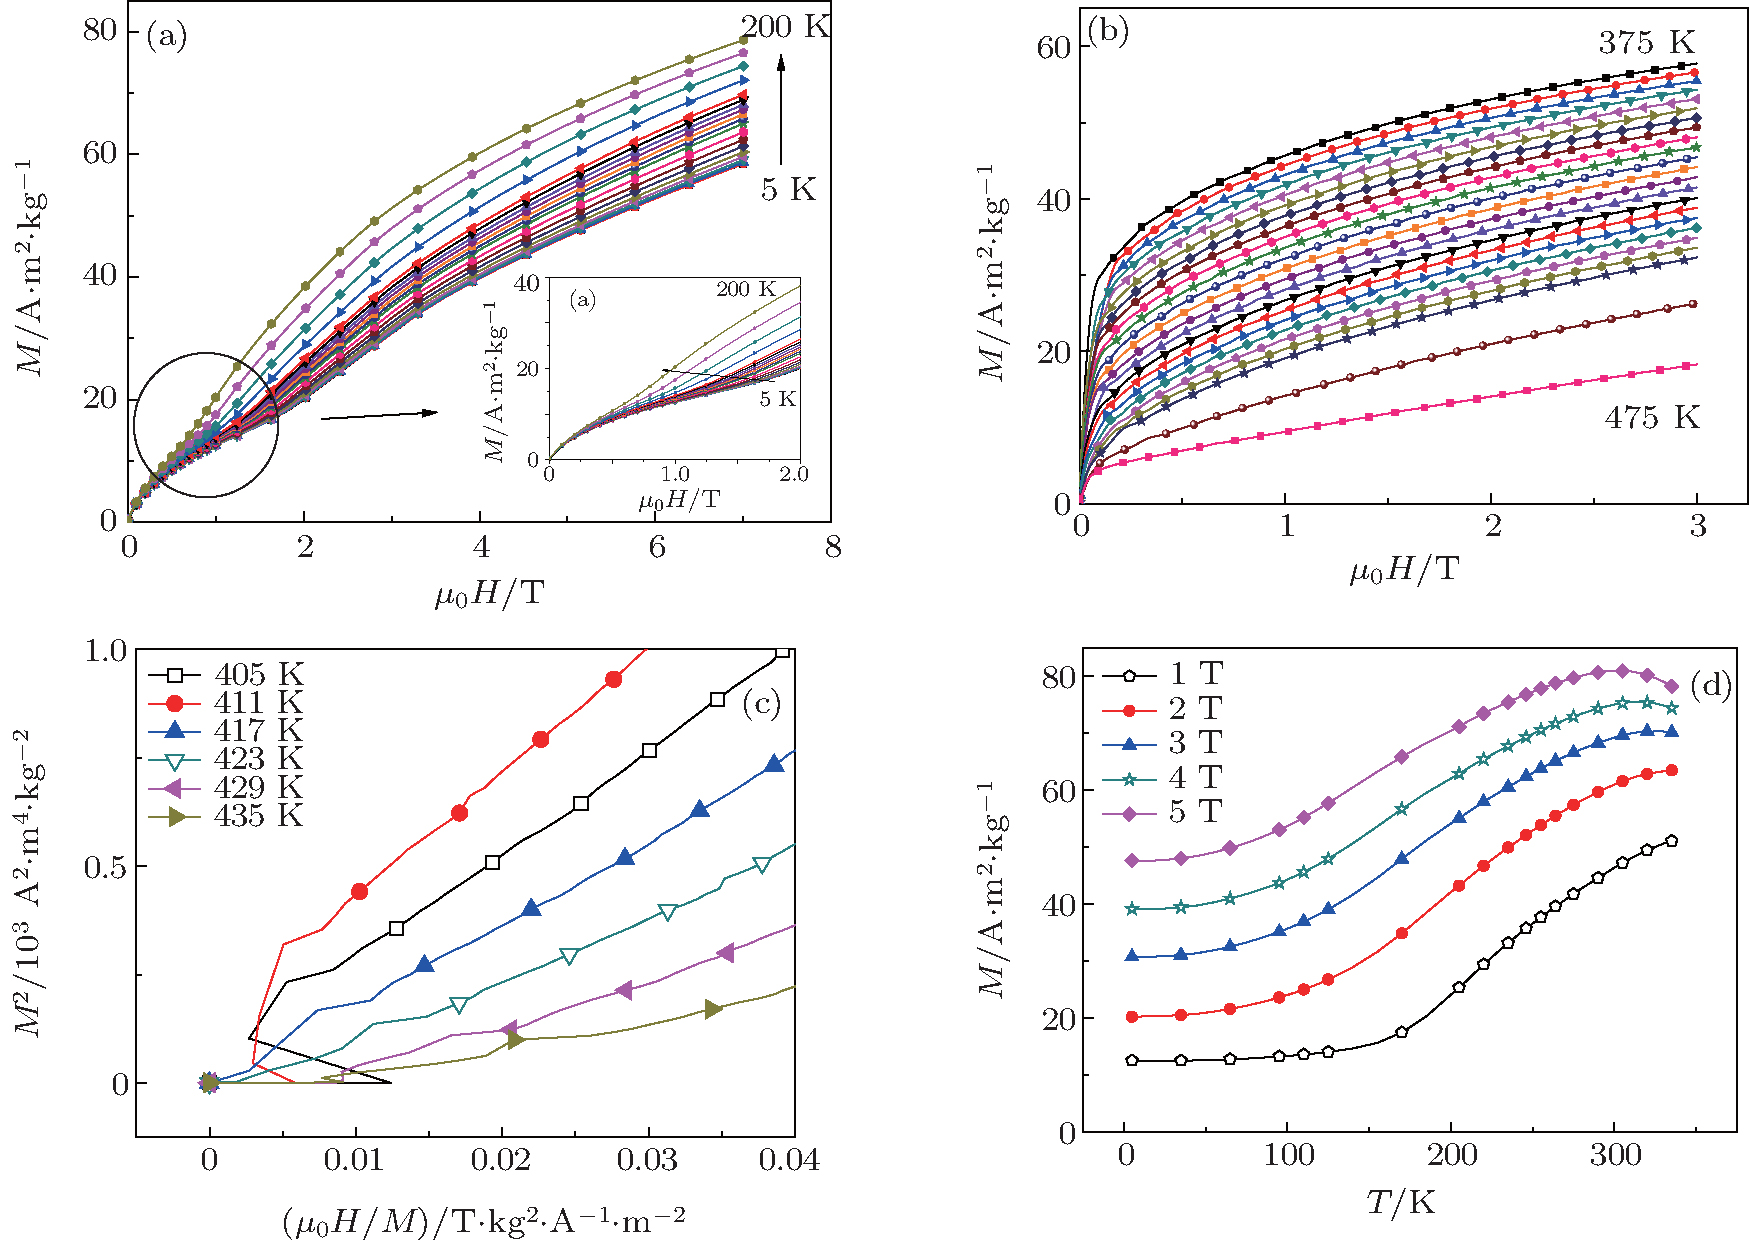
Figure 3 shows M– H curves around (a) 150 K, (b) 425 K, (c) Arrott plots around 425 K and (d) isofield M– T curves in various fields (1 T– 5 T) constructed from isothermal magnetization data for the compound with x = 0.4. From M– H curves in Fig. 3(a), it is clear that the critical field of the metamagnetic transition decreases slowly as temperature increases (the critical field is determined by the maximum of ∂ M/∂ H) and the magnetization increases smoothly with the magnetic field increasing, which indicates the second-order feature of this transition. When the temperature increases to 200 K, the compound achieves a high magnetization in a relatively low field but it is difficult to saturate in a high field. Both of them are features of the coexistence of FM and FIM. So the temperature range between 200 K and Tt is a concomitant region. According to M– H curves in Fig. 3(b), it indicates the formation of FM 2 state around Th. Considering the negative slope at an inflection point in each of Arrott plots around 410 K, the transition around Th is a first-order transition.[16] While the change in Mn– Mn distance seems to have no effect on this transition, which is different from the case in the metamagnetic transition of Tt.
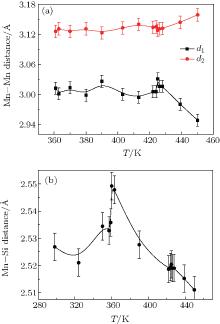
Figure 4 indicates (a) the variations of d1 and d2 with T and (b) the variations of average distance between the nearest Mn atoms and Si atoms with the increase of temperature, obtained from the high temperature XRD data for the x = 0.4 compound. Although d1 keeps fluctuating during the whole temperature range, it stays in the region where FIM is stable according to the results reported previously and there is no crossover between d1 and d2.[3, 7] By taking the distance between Mn atoms and Si atoms into consideration, as figure 4(b) shows, the transition at Th can be explained by the overlap of orbits in these two atoms. The Si occupies the pyramid site built by five Mn atoms. The distance between them determines the overlap of their orbits and then determines the moment located in Mn atoms.[17] From Fig. 4(b), the distance between Mn atoms and Si atoms decreases from 2.55 Å (360 K) to 2.51 Å (450 K). This leads to the expansion of the Mn band and then results in the decreasing of Mn moments, which leads to the formation of the FM 2 state. The transition from FM 1 to FM 2 couples with the change in Mn– Si distance, which can also explain the first-order feature of this transition as shown by Arrott plots.
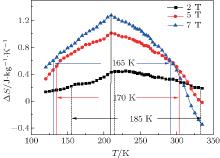
3.3. Magnetocaloric effectUsing the Maxwell equation, the magnetic entropy change is calculated according to the M– H curve around 210 K.[18] Due to the wide temperature span of the metamagnetic transition around Tt of the compound with x = 0.4, only MCE for this compound is studied. Figure 5 shows the temperature dependences of the isothermal entropy change S around Tt for the x = 0.4 compound. As shown in Fig. 3(d), with the increase of applied field, the Tt moves a little toward a lower temperature. This can explain the entropy peak near 210 K. As the temperature span between Tt and Th is small, the MnCoSi1− xPx compounds can achieve a successive decrease and increase in temperature due to the associated inversed MCE and MCE (as shown in Fig. 5, both positive and negative entropy change exist in this compound), respectively. What is more, the transition around Th is a first-order transition, which is sensitive to the applied field. The larger the applied field, the lower the transition temperature is. This makes the negative entropy change larger in a low temperature under a high applied field (such as 7 T). It is also worth noting that P doping in the Si site makes the transition have a large temperature span with a low entropy change peak compared with the scenario of MnCoSi. For example, the entropy change with Δ μ 0H = 5 T is 1.0 J· kg− 1· K− 1 at its peak while the full width at half maximum of the peak is 185 K. Even compared with the MnCoSi-related compound which has the SOMT, it is still a large temperature span.[10] This is because P substitution intensifies the competition between FIM and FM. As mentioned above, compounds with larger x values have smaller d1 values, which makes the FIM unstable and the energy barrier between the FM and FIM state decrease.[6] Both of them make the metamagnetic transition have a large temperature span.[4] Another reason for this large temperature span can come from the non-uniform surroundings of Mn ions on a microscopic scale: as P atoms substitute for Si atoms, different Mn ions see different environments, which means that different Mn atoms have different orbital overlaps with the neighboring atoms, thereby leading to different magnetic interactions. Additionally, the chemical disorder which is a common phenomenon in a melt spinning process leads to the formation of P-rich and Si-rich regions in the compound (phase separation). This effect enhances the non-uniformity on a microscopic scale. This inhomogeneity can also be confirmed by the fact that the table-like MCE with large temperature span has always been observed in composites or multi-phase samples and it is rare for single-phased samples. So because the ionic radius of a P atom is smaller than that of a Si atom, the P doping results in a distortion of the lattice. This is confirmed by the expansion of peaks in room temperature XRD patterns for compounds with larger x values (the expansion also confirms the phase separation). As a consequence, the magnetic interactions between different magnetic atoms vary on a microscopic scale, which means that the magnetic transitions locally take place at different temperatures. The occurrence of a marcoscopic scale implies that the region where the FM state and FIM state coexist (that is the region between 200 K and Tt in x = 0.4 compounds as mentioned above) will be enlarged, which is similar to the scenario of the Ge-substituted MnCoSi compounds. Finally the sharpness of the transition decreases.[19]
Also, according to Fig. 3(d), which shows that the insensitivity of Tt depends on the applied field, the low but broad peak of Δ S(T) can come from the magneto-crystalline coupling mechanism, which is weakened by the P doping at the Si site and a change in the elastic energy. The force driving the magneto-elastic transition can be an elastic transition in the lattice or a magnetic transition (one of them takes the main role, the other acts as a cooperator).[20, 21] This insensitivity indicates that the magnetic field is ineffective in activating the magneto-elastic transition and the change in the magnetic interaction is the main reason for this transition. Figure 3(d) indicates the role of P in weakening the antiferromagnetic interaction inside the Mn sublattice illustrated by the high magnetization under a high field at low temperature (in fact, as mentioned above, it is FIM not AFM at low temperature), which reduces the change of magnetization in the metamagnetic transition and then reduces the maximum of entropy change. This may be due to the fact that a P atom has one valence electron more than a Si atom and as discussed above, the Mn– Si bond determines the moment located in Mn atoms. This extra electron can enter into the band of Mn atoms, which reduces the moment in Mn atoms and finally weakens the magnetic interactions. So the spin-lattice coupling may directly be associated with magnetic interaction and possibly result from the correlation between magnetism and the chemical bond, which is consistent with the results reported previously and our analysis of high temperature XRD data.
All of this leads to the decline in the MCE effect and an uncommonly wide temperature span compared with the case in other compounds which have first-order transition in the MnCoSi system.


 , Wang Chang-Sheng