Luo Xiao-Ning, Dong Cheng, Liu Shi-Kai, Zhang Zi-Ping, Li Ao-Lei, Yang Li-Hong, Li Xiao-Chuan. Low-temperature physical properties and electronic structures of Ni3Sb, Ni5Sb2, NiSb2, and NiSb * . Chinese Physics B, 2015, 24(6): 067201
Permissions
Low-temperature physical properties and electronic structures of Ni3Sb, Ni5Sb2, NiSb2, and NiSb *
Luo Xiao-Ninga),b), Dong Chengb)†, Liu Shi-Kaia), Zhang Zi-Pinga), Li Ao-Leib), Yang Li-Hongb), Li Xiao-Chuanb)
School of Material Science and Engineering, Henan University of Technology, Zhengzhou 450001, China
National Laboratory for Superconductivity, Institute of Physics, Chinese Academy of Sciences, Beijing 100190, China
*Project supported by the National Natural Science Foundation of China (Grant No. 21271183) and the National Basic Research Program of China (Grant Nos. 2011CBA00112 and 2011CB808202).
Abstract
We report the results of low temperature resistivity and magnetization measurements on polycrystalline samples of four Ni–Sb compounds, Ni3Sb, Ni5Sb2, NiSb, and NiSb2. Resistivity measurements revealed that these compounds exhibit a metallic type of electrical conductivity. Temperature dependences of the resistivities were well fitted by the generalized Bloch–Grüneisen formula with an exponent of n = 3, indicating that the s–d interband scattering is the dominant scattering mechanism. The magnetic susceptibilities of Ni5Sb2, NiSb, and NiSb2 are almost independent of temperature (above 150 K), exhibiting Pauli paramagnetic behavior. The temperature dependences of the susceptibilities were fitted using the Curie–Weiss law. Ni3Sb was found to have a paramagnetic–ferromagnetic phase transition at 229 K.
First-principles calculations have been performed to investigate the electronic structures and physical properties of these Ni–Sb alloys. The calculation of the band structure predicted that Ni3Sb, Ni5Sb2, NiSb, and NiSb2 have characteristics of metal, and the ground state of Ni3Sb is ferromagnetic. The electrical and magnetic properties observed experimentally are consistent with that predicted by the first-principle electronic structure calculations.
Since the superconductivity of LnNi2B2C (Ln = Y, Tm, Er, Ho or Lu)[1, 2] has been discovered, extensive studies were performed successfully in the search for new Ni-based superconductors. In 2001, a new superconductor MgCNi3[3] with an antiperovskite structure was found with Tc around 8 K. Subsequently, superconductivity was also found in CdCNi3, [4] ZnNNi3, [5] and CuNNi3[6] with the antiperovskite structure. Several Ni-based superconductors with the ‘ 1111’ -type structure, such as LaONiP, [7, 8] LaNiOAs, [9] and LaNiBiO1 − x, [10] were found soon after the discovery of superconductivity in LaOFeP.[11] In addition, CeNi0.8Bi2[12] and LaNi0.9Bi2[13] are superconductors and they share the same space group with the ‘ 1111’ -type structure.[14]
Though all the Ni-based superconductors mentioned above are ternary or quaternary phases, we noticed that some binary nickel alloys are also superconductors. For example, both NiBi and NiBi3 are superconductors, [15, 16] and they are the only two intermediate phases in the Ni– Bi system.[17] Because Sb and Bi belong to the same group in the periodic table, we conjectured that some Ni– Sb binary phases might be superconductor as well. In this paper, we investigate the electrical and magnetic properties of the Ni– Sb alloys at low temperature to search for possible superconductors in the Ni– Sb system.
Four intermediate phases, Ni3Sb, Ni5Sb2, NiSb, and NiSb2, exist in the Ni– Sb binary system near room temperature.[18, 19] The Ni3Sb, NiSb, and NiSb2 phases crystallize with the well-known Cu3Ti, NiAs, and FeS2 type structure respectively, whereas Ni5Sb2 crystallizes in a unique type of structure.[20– 22] There is very scarce information in the literature about their low-temperature physical properties. The high-temperature phase of Ni3Sb attracted a great deal of attention, because Ni atoms of this alloy possess the highest mobility ever observed in a metallic system.[23] Bulk NiSb and nanosized Ni5Sb2, NiSb, and NiSb2 have been studied as promising electrode materials in lithium-ion batteries recently.[24– 27] To the best of our knowledge, only the low-temperature resistivity and susceptibility of NiSb were studied previously. NiSb was found to be a typical Pauli paramagnetic metal by resistivity and susceptibility measurements.[28, 29] Besides, we have incomplete information about the physical properties of NiSb2. The bulk NiSb2 shows metallic behavior by electric resistivity measurement above room temperature.[30] NiSb2 nanocrystals are ferromagnetic.[31] At present, knowledge about the low-temperature physical properties of Ni3Sb and Ni5Sb2 is obviously lacking.
The main aim of the present work is to investigate the low-temperature electrical and magnetic properties of Ni3Sb, Ni5Sb2, NiSb, and NiSb2. We also performed the first-principle electronic structure calculations for these compounds in order to elucidate their physical properties.
2. Experimental and computational method
The polycrystalline samples of Ni3Sb, Ni5Sb2, NiSb2, and NiSb were synthesized at high temperature from nickel (99.999%, Sinapharm) and antimony (99.999%, Sinapharm) powders. Stoichiometric amounts of Ni and Sb powders were mixed and pressed into pellets. The pellets were sealed in evacuated quartz tubes. The samples were placed into a furnace and heated at 1050 ° C for 24 h, and then cooled down to 600 ° C and annealed at this temperature for 100 hours. Finally, the samples were furnace-cooled to room temperature. The powder x-ray diffraction data of the samples were collected on a Rigaku D/max-Ultima IV diffractometer with Cu Kα radiation at room temperature. The 2θ scan range was from 10° to 120° . The lattice parameters of the samples were calculated using the least-square method with the help of the PowderX program.[32] The grain morphology of the samples was examined using a scanning electron microscope (FE-SEM, Hitachi S4800), and the chemical compositions were analyzed by an energy-dispersive x-ray spectroscopy (EDX) attachment. The electrical resistivity measurement was performed using the conventional four-probe method. The temperature dependence of the magnetization was measured at a magnetic field of 1 T using a Quantum Design MPMS XL-5 SQUID magnetometer in the temperature range from 5 K to 300 K.
We employed the CASTEP (Cambridge Serial Total Energy Package) program[33] for the electronic structure calculations. The spin-polarized generalized gradient approximation with the Perdew– Burke– Ernzerhof (PBE) scheme is adopted for the exchange– correlation potential.[34] The ultrasoft pseudopotentials[35] with a plane wave cutoff energy of 330 eV were used for the calculations of Ni3Sb, NiSb2, and NiSb, and the norm-conserving pseudopotential[36] is used for Ni5Sb2 with cutoff energy of 860 eV. The Brillouin zone was sampled with a 5× 6× 6, 5× 4× 7, 7× 7× 6, 2× 5× 4 Monkhorst– Pack grid for Ni3Sb, Ni5Sb2, NiSb2, and NiSb, respectively. The crystal structure data in references listed in Table 1 were used for the calculations.
3. Results and discussion
3.1. Powder x-ray diffraction and microanalysis
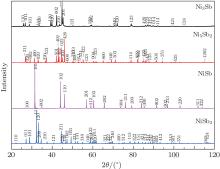
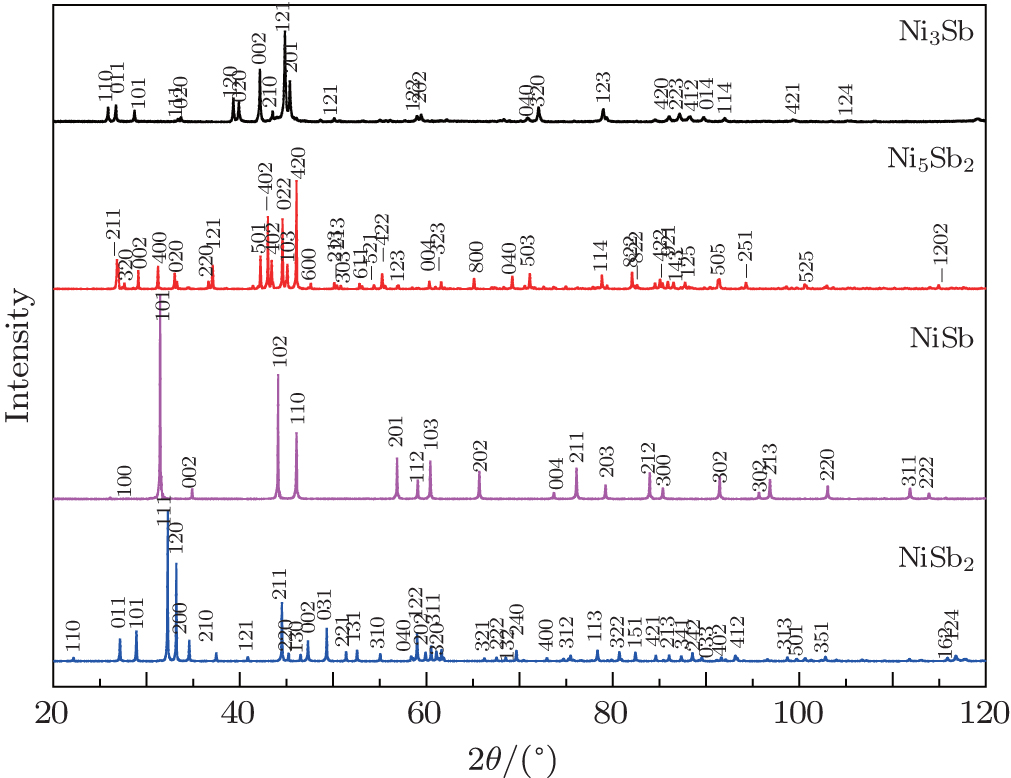
The powder x-ray diffraction data indicate that all samples are single phase. Figure 1 shows the x-ray power diffraction patterns of the Ni3Sb, Ni5Sb2, NiSb2, and NiSb samples. All observed peaks in each pattern can be indexed to the previously reported structure with the lattice parameters listed in Table 1. The lattice parameters given in the reference papers are also listed in Table 1 for comparison. Our results are consistent with those reported in the literature.
The elemental compositions of the samples determined by EDX analysis are listed in Table 2. The measured elemental compositions are consistent with the stoichiometric ones within the experimental errors.
Table 1. Summary of lattice parameters measured in this work and previous works.
Table 2.
Table 2.
Table 2. Elemental compositions determined by EDX analysis.
Sample
Ni3Sb
Ni5Sb2
NiSb
NiSb2
Ni/at%
74.6
71.7
51.0
33.1
Sb/at%
25.4
28.3
49.0
66.9
Table 2. Elemental compositions determined by EDX analysis.
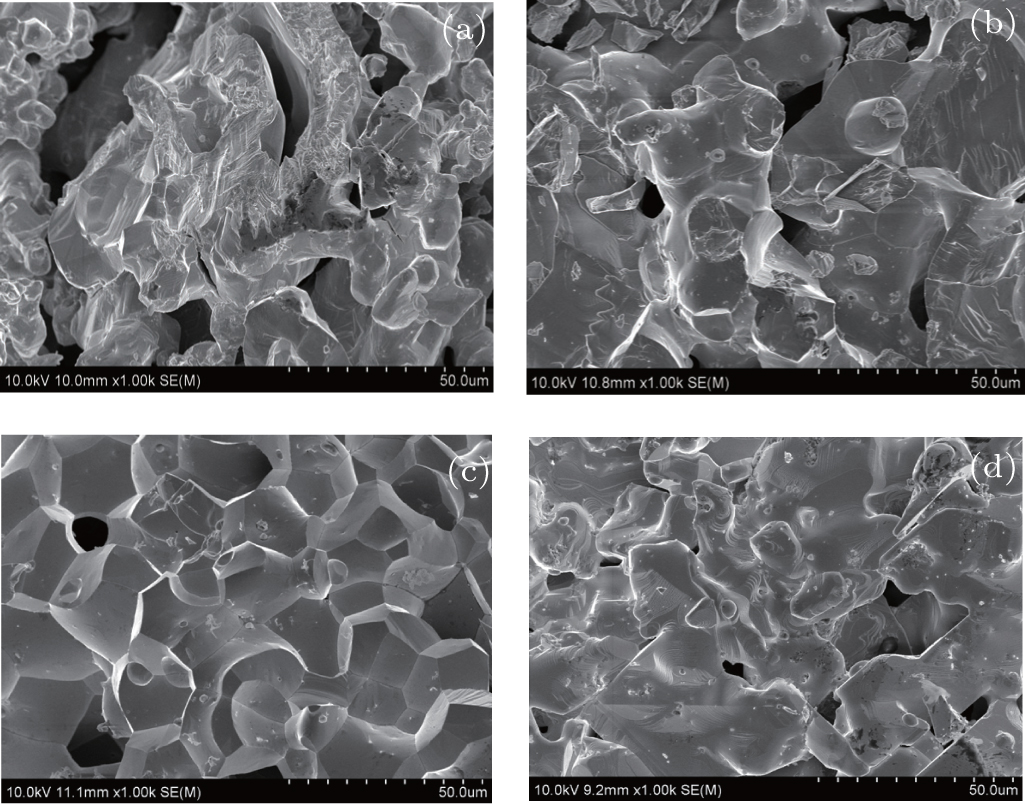
The SEM micrographs of the Ni3Sb, Ni5Sb2, NiSb, and NiSb2 samples are shown in Fig. 2. The Ni3Sb, Ni5Sb2, and NiSb2 samples are aggregations of irregular-shaped particles with sizes in the range of 5 μ m– 20 μ m . The micrographs also revealed the presence of porosity in the Ni3Sb, Ni5Sb2, and NiSb2 samples. The NiSb sample has the most regular morphology among all the samples, which may be explained in terms of the phase transitions. Only NiSb has no phase transition below 1000 ° C.[18] It can be seen from Fig. 2(c) that some of the NiSb grains clearly show hexagonal facets, signifying their hexagonal crystal structure. The grain sizes of the NiSb sample are varied from 10 μ m to about 25 μ m.
Fig. 2. SEM micrographs of the Ni3Sb (a), Ni5Sb2 (b), NiSb (c), and NiSb2 (d) samples.
3.2. Electronic structure
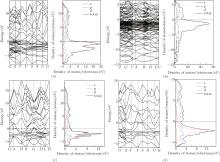
Figure 3 shows the calculated band structures and densities of states (DOS) for Ni3Sb, Ni5Sb2, NiSb, and NiSb2. A common feature of these band structures is the bands crossing at the Fermi level along various directions, which results in finite DOS at the Fermi level. Hence, these compounds are predicted to exhibit metallic behavior by the electronic structure calculations, which is in accordance with our experimental results given in the next sections. The total DOSs at the Fermi levels N(EF) are 9.987, 14.561, 2.088, and 2.477 (states/eV) for Ni3Sb, Ni5Sb2, NiSb, and NiSb2, respectively. Since the valence configurations of isolated atoms are 3d84s2 for nickel and 5s25p3 for antimony, the electron bands near the Fermi levels will be occupied by these valence electrons. In addition to the total DOS, the partial densities of s, p, and d states are also illustrated in Fig. 3. We note that the p and d states make the dominating contribution to the total DOS near the Fermi levels. At the Fermi levels, the partial densities of d states provide over half of the total DOS in the Ni-rich phases (Ni3Sb, Ni5Sb2, and NiSb). Even in the Sb-rich NiSb2 phase, the partial densities of d states account for more than one-third of the total DOS. These calculation results support the s– d scattering mechanism responsible for the resistivity in these alloys (described in the next section).
Fig. 3. The calculated band structure (left) and total densities of states and the partial densities of s, p, and d states (right) for Ni3Sb (a), Ni5Sb2 (b), NiSb (c), and NiSb2 (d). The horizontal line denotes the position of the Fermi energy, which has been chosen to be 0 eV.
The spin-polarized electron structure calculations have also provided valuable information for the magnetic properties. The calculated total magnetic moment is 0.36μ B per cell for Ni3Sb in the ground state. Therefore, Ni3Sb should be ferromagnetic. The calculated total magnetic moments are practically zero for Ni5Sb2, NiSb, and NiSb2. Hence, Ni5Sb2, NiSb, and NiSb2 were predicted to be paramagnetic by the theoretical calculations.
3.3. Electrical resistivity
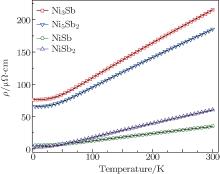
In Fig. 4 we plot the temperature dependence of resistivity of the samples. All samples exhibit metallic behavior and the resistivities increase linearly with temperature above 50 K. No superconductivity was found down to 2 K.
The temperature dependence of the resistivities was modeled by the generalized Bloch– Grü neisen formula, [40– 42]
where ρ 0 is the residual resistivity due to the temperature-independent scattering from defects and impurities. C is a prefactor that is related to the electron– phonon coupling strength. θ D is the Debye temperature. The exponent n is dependent on the dominant scattering mechanisms, and takes the value of 5 for electron– phonon intraband scattering and 3 for electron– phonon s– d interband scattering. The s– d interband scattering is significant in alloys with an unfilled d band.
We calculated by a least-squares fit to the data using Eq. (1) for both values of n. A better fit to the experimental data was obtained with n = 3 (solid line in Fig. 4.) than that with n = 5 for each sample, indicating that s– d interband scattering is the dominant scattering mechanism in all these compounds. This can be explained with our band structure calculation results as they all have an unfilled d-band.
The residual resistivity (ρ 0), the prefactor (C), and the Debye temperature (θ D), obtained from the fits of the resistivity data are summarized in Table 3. The residual resistivity monotonically increases with the Ni content, indicating that the Ni-rich samples contain more defects and impurities.
Fig. 4. Temperature dependence of electrical resistivity of Ni3Sb, Ni5Sb2, NiSb, and NiSb2. The small symbols denote the experimental data points, and the solid lines represent the fits using Eq. (1). Note that the experimental data points are rarefied for a better clarity.
Table 3.
Table 3.
Table 3. The residual resistivity (ρ 0), Debye temperature (θ D), and the prefactor (C) obtained from the fits of the resistivity data using Eq. (1).
Sample C/μ Ω · cm
ρ 0/μ Ω · cm
θ D/K
Ni3Sb
76. 215
310
199. 90
Ni5Sb2
65. 702
300
248. 73
NiSb
5. 65
330
67. 32
NiSb2
3. 00
275
108. 78
Table 3. The residual resistivity (ρ 0), Debye temperature (θ D), and the prefactor (C) obtained from the fits of the resistivity data using Eq. (1).
3.4. Magnetic properties
Figure 5 shows the temperature dependences of the magnetic susceptibility for the samples. The magnetic susceptibility data were measured in the field cooling (FC) and zero-field cooling (ZFC) modes. Only the FC data are displayed in Fig. 5 as the ZFC data nearly coincide with the ZC ones. It can be seen in Fig. 5 that Ni3Sb shows a paramagnetic– ferromagnetic phase transition around 230 K. The magnetic susceptibilities of Ni5Sb2, NiSb2, and NiSb are almost independent of temperature above 150 K, showing Pauli paramagnetic behavior as expected by our electronic structure calculations. The upturns of the susceptibilities in the low temperature region are attributable to the effect of paramagnetic impurities or paramagnetic surface states.[29, 43] There is a small kink around 275 K in the susceptibility of Ni5Sb2, which might be caused by a trace amount of ferromagnetic impurities.
We have fit the magnetic susceptibility data to a modified Curie– Weiss law,
where C is the paramagnetic Curie constant, θ is the Curie– Weiss temperature which represents the magnetic exchange interactions between the spins, and χ 0 is the temperature-independent susceptibility. The solid lines in Fig. 5 are fits to the modified Curie– Weiss law. The related parameters obtained from the fits are listed in Table 4. The Curie temperature of Ni3Sb was determined to be 229 K from the fit. The temperature intercept of (χ 0– χ 0)− 1 versus the T plot (the inset in Fig. 5(a)) also gives the same Curie temperature.
In the Ni– Sb alloys, the Pauli paramagnetism of the conduction electrons makes a major contribution to χ 0. Since the Pauli paramagnetic susceptibility is proportional to the DOS at the Fermi levels N(EF), the χ 0 values from the fitting analysis have the same variation trend with the calculated N(EF). The negative values of the Curie temperature for Ni5Sb2, NiSb2, and NiSb suggest the presence of weak antiferromagnetic exchange interactions. The Curie constant C = Nμ 2/3kB is a measure of the paramagnetic ion concentration, (N = number of magnetic ions/mol, μ = magnetic moment of the ion, and kB = Boltzmann’ s constant). Assuming the magnetic ions were Ni2+ (with spin-only effective magnetic moment μ = 2.83 μ B), the Ni2 + concentrations derived from the Curie constants are less than 1.5 ppb in the Ni5Sb2, NiSb2, and NiSb samples.
Fig. 5. Temperature dependence of the magnetic susceptibility χ of Ni3Sb (a), Ni5Sb2 (b), NiSb (c), and NiSb2 (d) measured with an applied field of 1 T. The measured data points are presented as unfilled circles. The solid lines are fits to the modified Curie– Weiss law with parameters given in Table 4. The arrow in Fig. 5(a) indicates the Curie temperature determined from the fit. The inset in Fig. 5(a) shows the (χ – χ 0)− 1 versus the T plot for Ni3Sb. The unit 1 Oe = 79.5775 A· m− 1.
Table 4.
Table 4.
Table 4. Susceptibility parameters obtained from fits using Eq. (2).
Sample
χ 0/(10− 3 emu/mol· Oe)
C/(10− 3 K· emu/mol· Oe)
θ /K
Ni3Sb
0.255
27
229
Ni5Sb2
0.289
1.20
– 12.3
NiSb
0.011
0.55
– 2.6
NiSb2
0.015
0.70
– 19. 0
Table 4. Susceptibility parameters obtained from fits using Eq. (2).
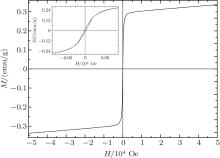
Fig. 6. Magnetization hysteresis loop for the Ni3Sb sample measured at 50 K. The inset shows an enlarged portion of the loop in the vicinity of zero fields.
To confirm the ferromagnetism of Ni3Sb after the magnetic phase transition, the magnetization versus magnetic field curve of the Ni3Sb sample was measured at 50 K with an applied field in the range of − 5 T to 5 T. The obtained curve is shown in Fig. 6. Ni3Sb at 50 K is obviously ferromagnetic for the magnetization versus magnetic field curve showing a well-defined hysteresis loop. The coercive field (Hc), the saturated magnetization (Ms), and the remnant magnetization (Mrem) were determined to be Hc = 22 Oe, Ms = 0.337 emu/g, and Mrem = 0.0163 emu/g. Therefore, we can conclude that Ni3Sb has weak ferromagnetism below the Curie temperature 229 K. The ferromagnetism of Ni3Sb at low temperature is consistent with the prediction from the first-principle electronic structure calculations.
4. Conclusions
In order to search for possible superconductors in the Ni– Sb binary alloys, we measured the low-temperature electrical resistivities and susceptibilities of Ni3Sb, Ni5Sb2, NiSb2, and NiSb polycrystalline samples and calculated their electronic structures. They exhibit a metallic type of electrical conductivity, and the s– d interband scattering is the dominant scattering mechanism responsible to their electrical resistivity. Ni5Sb2, NiSb2, and NiSb are found to be Pauli paramagnetic metals. The upturns of their susceptibilities in the low temperature region are attributable to the effect of paramagnetic impurities or paramagnetic surface states. Ni3Sb has a paramagnetic– ferromagnetic phase transition at 229 K. The electrical and magnetic properties observed experimentally are consistent with those predicted by the first principle calculations. Although no superconductivity has been found down to 2 K in these binary Ni– Sb compounds, we believe that more superconductors will be found in ternary and multi-elements systems containing Ni and Sb.
HeT, HuangQ, RamirezA P, WangY, ReganK A, RogadoN, HaywardM A, HaasM K, SluskyJ S, InumaraK, Zand bergenH W, OngN P and CavaR J2001Nature41154DOI:10.1038/35075014[Cited within:1][JCR: 38.597]
... Y, Tm, Er, Ho or Lu)[1,2] has been discovered, extensive studies were performed successfully in the search for new Ni-based superconductors ...
1
1995
0.0
0.0
... Y, Tm, Er, Ho or Lu)[1,2] has been discovered, extensive studies were performed successfully in the search for new Ni-based superconductors ...
1
2001
38.597
0.0
... In 2001, a new superconductor MgCNi3[3] with an antiperovskite structure was found with Tc around 8#cod#x00A0 ...
1
2007
2.087
0.0
... Subsequently, superconductivity was also found in CdCNi3,[4] ZnNNi3,[5] and CuNNi3[6] with the antiperovskite structure ...
1
2009
2.087
0.0
... Subsequently, superconductivity was also found in CdCNi3,[4] ZnNNi3,[5] and CuNNi3[6] with the antiperovskite structure ...
1
2013
0.0
0.0
... Subsequently, superconductivity was also found in CdCNi3,[4] ZnNNi3,[5] and CuNNi3[6] with the antiperovskite structure ...
1
2007
4.593
0.0
... -type structure, such as LaONiP,[7,8] LaNiOAs,[9] and LaNiBiO1 #cod#x2212 ...
1
2008
1.671
0.0
... -type structure, such as LaONiP,[7,8] LaNiOAs,[9] and LaNiBiO1 #cod#x2212 ...
1
2008
2.04
0.0
... -type structure, such as LaONiP,[7,8] LaNiOAs,[9] and LaNiBiO1 #cod#x2212 ...
1
2012
0.0
0.0
... x,[10] were found soon after the discovery of superconductivity in LaOFeP ...
1
2006
10.677
0.0
... [11] In addition, CeNi0 ...
1
2011
0.0
0.0
... 8Bi2[12] and LaNi0 ...
1
2013
0.718
0.0
... 9Bi2[13] are superconductors and they share the same space group with the #cod#x2018 ...
1
1996
1.534
0.0
... [14] ...
1
1953
0.0
0.0
... For example, both NiBi and NiBi3 are superconductors,[15,16] and they are the only two intermediate phases in the Ni#cod#x2013 ...
1
2000
2.087
0.0
... For example, both NiBi and NiBi3 are superconductors,[15,16] and they are the only two intermediate phases in the Ni#cod#x2013 ...
1
2007
0.691
0.0
... [17] Because Sb and Bi belong to the same group in the periodic table, we conjectured that some Ni#cod#x2013 ...
2
2008
1.433
0.0
... [18,19] The Ni3Sb, NiSb, and NiSb2 phases crystallize with the well-known Cu3Ti, NiAs, and FeS2 type structure respectively, whereas Ni5Sb2 crystallizes in a unique type of structure ...
... [18] It can be seen from Fig ...
1
2011
0.0
0.0
... [18,19] The Ni3Sb, NiSb, and NiSb2 phases crystallize with the well-known Cu3Ti, NiAs, and FeS2 type structure respectively, whereas Ni5Sb2 crystallizes in a unique type of structure ...
1
1994
2.39
0.0
... [20#cod#x2013 ...
1
1978
0.0
0.0
1
1972
1.913
0.0
... 22] There is very scarce information in the literature about their low-temperature physical properties ...
1
1996
2.355
0.0
... [23] Bulk NiSb and nanosized Ni5Sb2, NiSb, and NiSb2 have been studied as promising electrode materials in lithium-ion batteries recently ...
1
2007
4.675
0.0
... [24#cod#x2013 ...
1
2013
1.224
0.0
1
2007
2.39
0.0
1
2005
2.39
0.0
... 27] To the best of our knowledge, only the low-temperature resistivity and susceptibility of NiSb were studied previously ...
1
1978
0.71
0.0
... [28,29] Besides, we have incomplete information about the physical properties of NiSb2 ...
2
2004
1.826
0.0
... [28,29] Besides, we have incomplete information about the physical properties of NiSb2 ...
... [29,43] There is a small kink around 275#cod#x00A0 ...
1
2012
0.0
0.0
... [30] NiSb2 nanocrystals are ferromagnetic ...
1
2008
2.072
0.0
... [31] At present, knowledge about the low-temperature physical properties of Ni3Sb and Ni5Sb2 is obviously lacking ...
1
1999
3.343
0.0
... [32] The grain morphology of the samples was examined using a scanning electron microscope (FE-SEM, Hitachi S4800), and the chemical compositions were analyzed by an energy-dispersive x-ray spectroscopy (EDX) attachment ...
1
2005
1.241
0.0
... We employed the CASTEP (Cambridge Serial Total Energy Package) program[33] for the electronic structure calculations ...
1
1996
7.943
0.0
... [34] The ultrasoft pseudopotentials[35] with a plane wave cutoff energy of 330#cod#x00A0 ...
1
1990
0.0
0.0
... [34] The ultrasoft pseudopotentials[35] with a plane wave cutoff energy of 330#cod#x00A0 ...
1
1979
7.943
0.0
... eV were used for the calculations of Ni3Sb, NiSb2, and NiSb, and the norm-conserving pseudopotential[36] is used for Ni5Sb2 with cutoff energy of 860#cod#x00A0 ...
1
1972
1.913
0.0
1
1994
2.39
0.0
1
1968
0.0
0.0
1
1938
0.0
0.0
... neisen formula,[40#cod#x2013 ...
1
1969
6.583
0.0
1
2013
1.534
0.0
... 42] ...
1
1993
1.527
0.0
... [29,43] There is a small kink around 275#cod#x00A0 ...
Low-temperature physical properties and electronic structures of Ni3Sb, Ni5Sb2, NiSb2, and NiSb *
[Luo Xiao-Ninga),b), Dong Chengb)†, Liu Shi-Kaia), Zhang Zi-Pinga), Li Ao-Leib), Yang Li-Hongb), Li Xiao-Chuanb)]


 , Liu Shi-Kai