Liu Lei, Hou Qi-Yue, Zhang Yi, Jing Qiu-Min, Wang Zhi-Gang, Bi Yan, Xu Ji-An, Li Xiao-Dong, Li Yan-Chun, Liu Jing. Structural and magnetic transition in stainless steel Fe-21Cr-6Ni-9Mn up to 250 GPa* . Chinese Physics B, 2015, 24(6): 066103
Permissions
Structural and magnetic transition in stainless steel Fe-21Cr-6Ni-9Mn up to 250 GPa*
Liu Leia)†, Hou Qi-Yuea), Zhang Yia), Jing Qiu-Mina), Wang Zhi-Ganga), Bi Yana), Xu Ji-Ana), Li Xiao-Dongb), Li Yan-Chunb), Liu Jingb)
National Key Laboratory of Shock Wave and Detonation Physics, Institute of Fluid Physics, China Academy of Engineering Physics, Mianyang 621900, China
Institute of High Energy Physics, Chinese Academy of Science, Beijing 100049, China
*Project supported by the National Natural Science Foundation of China (Grant Nos. U1230201, 11274281, and 11304294), the Industrial Technology Development Program, China (Grant No. 9045140509), and the Funds from the Chinese Academy of Sciences (Grant Nos. KJCX2-SW-N03 and KJCX2-SW-N20).
Abstract
Stainless steel Fe-21Cr-6Ni-9Mn (SS 21-6-9), with ∼21% Cr, ∼6% Ni, and ∼9% Mn in weight percentage, has wide applications in extensive fields. In the present study, SS 21-6-9 is compressed up to 250 GPa, and its crystal structures and compressive behaviors are investigated simultaneously using the synchrotron angle-dispersive x-ray diffraction technique. The SS 21-6-9 undergoes a structural phase transition from fcc to hcp structure at ∼12.8 GPa with neglectable volume collapse within the determination error under the quasi-hydrostatic environment. The hcp structure remains stable up to the highest pressure of 250 GPa in the present experiments. The antiferromagnetic-to-nonmagnetic state transition of hcp SS 21-6-9 with the changes of inconspicuous density and structure, is discovered at ∼50 GPa, and revealed by the significant change in c/ a ratio. The hcp SS-21-6-9 is compressive anisotropic: it is more compressive in the c-axis direction than in the a-axis direction. Both the equations of states (EOSs) of fcc and hcp SS 21-6-9, which are in accordance with those of fcc and hcp pure irons respectively, are also presented. Furthermore, the c/ a ratio of hcp SS 21-6-9 at infinite compression, R∞, is consistent with the values of pure iron and Fe–10Ni alloy.
Iron alloys are of fundamental interest in material science, geophysics, and industrial applications. During the past several decades, great efforts have been devoted to studying the high pressure and high temperature physical properties of pure iron and its light elements alloys, which are major constituents of the Earth’ s liquid outer core and the solid inner core, in order to shed light on the geophysical and geochemical models of the Earth interior.[1– 3]
Stainless steel Fe-21Cr-6Ni-9Mn (SS 21-6-9) with ∼ 21% Cr, ∼ 6% Ni, and ∼ 9% Mn in weight percentage, is a stable austenitic stainless steel alloyed with nitrogen to achieve higher strength. The content values of Cr and Ni increase the stacking fault energy of SS 21-6-9 and result in a good resistance to hydrogen embrittlement.[4] Thermo-mechanical processing increases the dislocation density of SS 21-6-9, causing ductility improvement with internal hydrogen.[5] Due to its high yield strength, excellent anticorrosion, and good resistance to hydrogen embrittlement, SS 21-6-9 is widely used in various fields, especially in controllable nuclear fusion study, vehicle design, petrochemical industry, aviation industry, superconducting engineering, etc.
Several studies on the velocity history and shear stress of SS 21-6-9 under extreme loading were reported.[6, 7] Huang et al. determined the Hugoniot, Hugoniot elastic limit, and shock velocity of SS 21-6-9 under single-gas-gun loading.[6] Whiteman and Millett obtained the longitudinal and lateral stress of SS 21-6-9 under shock loading.[7] They discovered that the shear strength of SS 21-6-9 increased with the augment of pressure. However, the structural properties and compressive behaviors of SS 21-6-9 under static pressure loading have still been limited to date, though they are very important inputting parameters for industrial design.
In the present study, the SS 21-6-9 is compressed up to 250 GPa by the diamond anvil cell (DAC) and its structure and compressive behaviors are determined by an in situ synchrotron angle-dispersive x-ray diffraction (ADXRD) technique. It is discovered that the SS 21-6-9 underwent a structural phase transition from the face-centered-cubic (fcc) to the hexagonal-closed-packed (hcp) structure at ∼ 12.8 GPa. The hcp structure is stable up to the highest pressure of 250 GPa in the present study. The magnetic state transition from antiferromagnetic to nonmagnetic state, revealed by the c/a ratio anomaly at ∼ 50 GPa, is discovered in hcp SS 21-6-9. The equation of state (EOS), and the anisotropic compressive behaviors of SS 21-6-9 are also reported.
2. Experiment details
Two runs of in situ ADXRD experiments in non- and quasi-hydrostatic environments were conducted respectively at the High-Pressure Station, 4W2 beamline at Beijing Synchrotron Radiation Facility (BSRF). In Run A, a pair of beveled diamond anvils with a culet size of 50 μ m was mounted on a symmetric cell to generate high pressures up to 250 GPa. The SS 21-6-9 sample cut from bulk materials (20.53% Cr, 8.95% Mn, 7.64% Ni, and 0.29% N in weight percent), was loaded into a 40-μ m diameter chamber, which was drilled into a pre-indented Re gasket. The Mo powder purchased from Alfa Aesar, USA, with a typical particle size of 2 μ m (purity of 99.9%) was loaded together with the sample in the chamber as the pressure gauge.[8] In Run B, the T301 stainless steel with an initial thickness of 250 μ m was pre-indented to ∼ 30 μ m by a DAC with 400-μ m diameter flat culets used as the gasket. A 120-μ m diameter sample chamber was drilled into the center of the pre-indented gasket. The ruby chips were loaded together with the SS21-6-9 piece in the sample chamber as the pressure calibration.[9] Silicone oil was also loaded as the pressure transmitting medium (PTM). The incident x-ray was monochromatized to 20 keV with a wavelength of 0.6199 Å by using double crystals (silicon 220) in both runs of experiments. The beam size was focused to 15 μ m (vertical)× 28 μ m (horizontal) (the full width at half maximum, FWHM) by Kirkpatrick– Baez mirrors. The diffraction patterns were collected by an image plate detector (MAR345) located at 267.67 mm from the sample. The CeO2 standard from the National Institute of Standards and Technology was used to calibrate the distance from the sample to the detector and the tilts of the detector. All the measurements were performed at room temperature. The two-dimensional (2D) diffraction patterns were integrated by Fit2D[10] to obtain the 2θ – intensity curves for further analysis.
3. Results and discussion
3.1. Structural phase transition
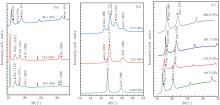
The selected diffraction patterns in two runs are illustrated in Fig. 1. The peak widths of SS 21-6-9 are obviously larger than those of Mo, due to the residual stress in the bulk material of SS 21-6-9 arising from the thermo-mechanical processing. The solid circle and diamond symbols indicate the peaks from the fcc and hcp structures, respectively. The unlabeled peaks in Run A are from the pressure gauge material Mo. The structural phase transition of SS 21-6-9 from the fcc to hcp structure has been discovered in both runs, though the onset pressures of the phase transition are different from each other. The (101) peak of hcp SS 21-6-9 appears first at 10.7 GPa in Run A, whereas in Run B the (100) peak of hcp SS 21-6-9 appears first at 12.8 GPa. The discrepancy in the onset pressure of the structural phase transition is because the non-hydrostatic stress environment facilitates the fcc– hcp structural phase transition in Run A. The non-hydrostatic effect on structural phase transition has been discovered in several materials: the shear stress facilitates the bcc– hcp structural phase transition in pure iron[11, 12] and induces the α − ω + β transformation in Zr; [13] the non-hydrostatic stress environment also had influence on the stable structure of GaSb[14] and InSb.[15] Consequently, we consider that the onset of the fcc– hcp structural phase transition is at about 12.8 GPa under the quasi-hydrostatic stress environment.
Fig. 1. Selected diffraction patterns under different pressures in Run A ((a) and (c)) and Run B (b). The solid circles and diamond symbols indicate the diffraction peaks form the fcc and hcp phase of SS 21-6-9 respectively. The unmarked peaks in panels (a) and (c) are from the pressure gauge Mo. The widths of SS 21-6-9 peaks are larger than that of Mo because of residual stress in the bulk material of SS 21-6-9.
However, the fcc structure is quite stubborn during the structural phase transition. The fcc and hcp structures coexist in a pressure interval of ∼ 8.4 GPa, i.e., from 12.8 GPa to 21.2 GPa in Run B of the present experiment. This sluggish transition from fcc to hcp structures is also observed in pure iron and Fe-rich alloy by Uchida et al.[16] and Mao et al.[17] Mao et al.[17] considered that the Ni diffusion plays a significant role in the structure transition. This sluggish structure transition provides an important clue for the kinetics of the fcc– hcp transformation. The SS 21-6-9 maintains the hcp structure up to the highest pressure of 250 GPa in the present experiments.
3.2. Equation of state
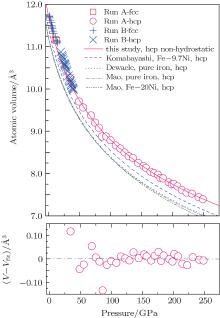
The (100) and (101) diffraction peaks are used to directly calculate the a and c parameters of hcp SS 21-6-9, then the atomic volume and the c/a ratio. The atomic volume as a function of pressure of SS 21-6-9 is illustrated in Fig. 2. It is discovered that the volume decreases continuously with increasing the pressure. No obvious volume collapse across the phase boundary has been observed within the accuracy of present experiments. The volume collapse across the fcc– hcp boundary in Fe– Ni alloy is approximately 1%– 3% under the condition of high pressure and high temperature, and the volume collapse becomes larger at higher pressures and temperatures.[17] Therefore, this volume collapse would be subtle at ambient temperature, similar to the SS 21-6-9. The SS 21-6-9 is compressed by ∼ 36.9% at the highest pressure of 250 GPa in the present experiment. The P– V data of SS 21-6-9 is least-squares fit with the Vinet EOS[18] to obtain the bulk modulus and its pressure derivative,
Fig. 2. Plots of average atomic volume of SS 21-6-9 versus pressure. The solid line represents our fitting result to Vinet EOS. The EOSs of pure hcp-iron determined by Mao et al.[21] and Dewaele et al., [22] Fe-rich Ni alloy determined by Mao et al.[21] and Komabayashi et al.[27] are also illustrated together for comparison. The lower panel shows the difference between the present experimental and fitting results of hcp SS 21-6-9.
Table 1.
Table 1.
Table 1. Comparison of the parameters of EOS of hcp structural SS-21-6-9, pure iron and Fe-rich Ni alloys. The parameters V0 (volume), K0 (bulk modulus), and (pressure derivative of bulk modulus) are obtained by least-squares fitting of the P– V data points to the 3-order Birch– Murnaghan (BM) and Vinet EOS formulas, respectively. The bold values are fixed during the fitting procedure. Values in parentheses are the uncertainties.
aThe data points determined below 18 GPa are excluded to avoid the interference due to the fcc– hcp phase transition; bThe data obtained by Jephcoat[20] and Mao[21] are combined in the EOS fitting procedure; cAnnealed by laser heating for 5 min– 10 min; dThe bulk modulus and its pressure derivative are fixed at K0 = 163.4 GPa and , reported by Dewaele et al.[22]; eObtained under high temperature; fBased on ruby pressure scale corrected for softer medium by Jacobsen.[30]
Table 1. Comparison of the parameters of EOS of hcp structural SS-21-6-9, pure iron and Fe-rich Ni alloys. The parameters V0 (volume), K0 (bulk modulus), and (pressure derivative of bulk modulus) are obtained by least-squares fitting of the P– V data points to the 3-order Birch– Murnaghan (BM) and Vinet EOS formulas, respectively. The bold values are fixed during the fitting procedure. Values in parentheses are the uncertainties.
where V, V0, K0, and are the volume at the pressure P, the volume at atmospheric pressure, the bulk modulus, and the pressure derivative of bulk modulus, respectively. The least-squares fitting yields K0 = 135.1 GPa, , and V0 = 11.920 Å 3 for the fcc structure. The bulk modulus of fcc SS 21-6-9 is a little larger than that of pure iron.[19] However, the bulk modulus of fcc iron was determined at high temperature, which may soften the material. The compressive behavior of fcc SS 21-6-9 resembles that of fcc pure iron taking the temperature effect into account.
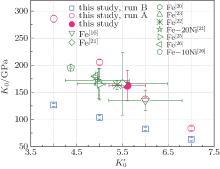
Fig. 3. Trade-off diagram of K0 versus of SS21-6-9 with hcp structure. The solid circle represents our fitting result without any constraint. The results of pure iron determined by Jephcoat et al., [20] Mao et al., [21] Dubrovinsky et al., [23] Uchida et al., [16] Dewaele et al.[22] Ono et al., [25] and Sakai et al., [26] are presented by empty symbols for comparison. Also plotted are the results of Fe– 20Ni alloy[21] and Fe– 10Ni[26] for comparison with our SS 21-6-9 result.
For the high pressure hcp structure, the parameters K0 = 162.51 GPa, , and V0 = 11.697 Å 3 under the non-hydrostatic environment, and K0 = 126.72 GPa, (fixed), and V0 = 12.319 Å 3 under the quasi-hydrostatic environment, are obtained, respectively. The fitting results of hcp SS 21-6-9 are also shown in Fig. 2 by the solid line. The EOS parameters of hcp SS 21-6-9 are compared with those of hcp pure iron and Fe-rich Ni alloys in Table 1. The trade-offs between K0 and of hcp SS 21-6-9 under quasi- and non-hydrostatic compressions are shown in Fig. 3, together with the previous results. The non-hydrostatic bulk modulus K0 is larger than the quasi-hydrostatic one, owing to the larger discrepancy between the determined strain and the real strain under the non-hydrostatic stress compression.[32] Our non-hydrostatic results are consistent with Mao[21] and Dewaele’ s[22] results, whereas we obtain a larger atomic volume at ambient pressure. This consistency indicates that the alloy elements do not change the compressive behavior of pure iron significantly, just expands the atomic volume. Nevertheless, Mao et al. considered that up to 20 wt% Ni did not lead to an obvious effect on the hcp iron unit cell volume.[21]
3.3. c/a ratio
To study the compressive behaviors of hcp SS 21-6-9 along different directions, the lattice constants of a and c of hcp structure varying with pressure are least-squares fit with a similar Vinet equation to obtain the modulus of the a and c axis,
where a and c are the values of the crystal parameters at pressure P, a0, and c0 are the values of a and c at ambient pressure, Ka and Kc are the bulk moduli along the a-axis and c-axis directions, and are the pressure derivatives of bulk modulus along the a and c directions, respectively. Because of the large scatter of the results in the non-hydrostatic run, only results derived from the quasi-hydrostatic experiment are included in the fitting procedure. The least-squares fitting yields Ka = 138.6 GPa and (fixed) for a, and Kc = 104.9 GPa and (fixed) for c. These results indicate that the hcp SS 21-6-9 is compressive anisotropic: it is more compressible in the c-axis direction than in the a-axis direction. Consequently, the c/a ratio of hcp SS-21-6-9 decreases with pressure increasing.
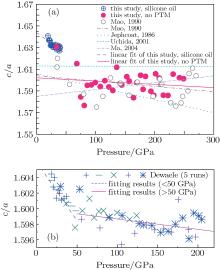
Previous study indicated that the elastic anisotropy of hcp Fe accounted for the seismic anisotropy in the Earth' s inner core: experimental study revealed that the c/a ratio of hcp Fe increases with temperature rising, but far below the value of ideal hcp structure 1.6299, which results in largely elastic anisotropy in the Earth' s inner core.[1] The c/a ratio of hcp SS 21-6-9 determined in the present study as a function of pressure is illustrated in Fig. 4 by comparing with the previous results of hcp Fe. An interesting result, i.e., the c/a ratio of SS 21-6-9 below ∼ 50 GPa (3.9 × 10− 4/GPa) decreases with the increase of pressure more than 10 times faster than that above ∼ 50 GPa (3.0 × 10− 5/GPa) (Table 2) without obviously changing the density and structure, is discovered as illustrated in Fig. 4. A similar phenomenon, i.e., the c/a ratio decreases more rapidly below ∼ 50 GPa (1.6 × 10− 4/GPa[22]) than those above ∼ 50 GPa (1.3 × 10− 5/GPa, [22] 4.9 × 10− 5/GPa, [21] 1.2 × 10− 4/GPa, [20] 1.6 × 10− 6/GPa, [16]) also exists in hcp pure iron as shown in the results presented by Dewaele et al., [22] which has been the most accurate result of hcp pure iron to date. However, they did not pay enough attention to this c/a anomaly. Later, Ono et al.[25] determined the c/a ratio of pure iron with increasing pressures carefully by laser heating annealing to minimize the pressure inhomogeneity and to overcome any potential kinetics. They also discovered the significant change of the c/a ratio at ∼ 55 GPa, which is ascribed to the antiferromagnetic-to-nonmagnetic state transition. The spin direction of the antiferromagnetic state is perpendicular to the c axis, which causes the c axis to be more compressible than the a axis. Consequently, the transition of the magnetic state in hcp SS 21-6-9 includes a change in the c/a ratio responding to compression.[25] Recently, Sakai et al.[26] replicated the c/a anomalies in pure iron and Fe– 10Ni alloy. Consequently, we consider the antiferromagnetic-to-nonmagnetic state transition is responsible for the significant change of the c/a ratio in hcp SS 21-6-9, similar to what was discovered in pure iron by Ono et al.[25] The large scatter of the c/a ratio after the magnetic state transition in our and other results[9, 25] arises from the influence of differential stress and the transition hysteresis.[25] The anomaly of c/a at the initial stage of the bcc– hcp phase transition is also discovered, which is due to the interference of the mixing phases.[20, 33, 34]
Fig. 4. (a) Variations of c/a ratio of SS 21-6-9 with pressure. The dash and solid lines represent the linear fitting results of our quasi- and non-hydrostatic results, respectively (c/a = 1.644 − 3.9 × 10− 4P (GPa) (quasi-hydrostatic), c/a = 1.602 − 0.3 × 10− 4P (GPa) (non-hydrostatic)). The results of pure iron determined by Mao et al. (c/a = 1.604 − 4.9 × 10− 5P (GPa)), [21] Jephcoat et al. (c/a = 1.606 − 1.2 × 10− 4P (GPa)), [22] Uchida et al. (c/a = 1.613 − 1.6 × 10− 6P (GPa)), [16] and Ma et al. (c/a = 1.585+ 6.3 × 10− 5P (GPa))[31] are also shown for comparison. (b) The c/a ratio of pure iron determined by Dewaele et al., [22] where the dash and solid lines represent the linear fitting results below and above 50 GPa respectively.
Table 2.
Table 2.
Table 2. Parameters of linear fitting to the c/a ratio (c/a = A − B × P) of pure iron and Fe-rich alloys.
Table 2. Parameters of linear fitting to the c/a ratio (c/a = A − B × P) of pure iron and Fe-rich alloys.
Fitting the c/a data to the Bolzmann sigmoidal function (c/a = R∞ + A/(1 + exp((P − B)/C)), [24] where A, B, C are fitting constants), we obtain the c/a ratio at infinite compression R∞ = 1.597. This result agrees well with those of pure iron (1.598[26]) and Fe– 10Ni alloy (1.603[26]). Sakai et al. considered that the R∞ value of Fe– 10Ni alloy is slightly larger than that of pure iron, [26] whereas we consider the difference is due to the scatter of the experimental data points. The R∞ value, an important parameter for understanding the anisotropy of the Earth’ s inner solid core, needs to be carefully determined in future study.
4. Conclusions
The SS 21-6-9 is compressed up to 250 GPa by DAC and its structure and EOS are determined. Structural transformation from the fcc to hcp structure is discovered at about 12.8 GPa under the quasi-hydrostatic environment. The fcc structure remains stable up to the highest pressure in the present experiments. The bulk modulus of the SS 21-6-9 in the fcc phase is a little larger than that of fcc iron, whereas the bulk modulus of the SS 21-6-9 in the hcp phase agrees well with that of hcp iron. For the hcp phase, the c axis is more compressive than the a axis. The compressive behavior of the SS 21-6-9 is similar to that of pure iron. The magnetic state transition from antiferromagnetic to nonmagnetic state is discovered in hcp SS 21-6-9 at ∼ 50 GPa.
DewaeleA, LoubeyreP, OccelliF, MezouarM, DorogokupetsP I and TorrentM2006Phys. Rev. Lett. 97215504DOI:10.1103/PhysRevLett.97.215504[Cited within:4][JCR: 7.943]
... [4] Thermo-mechanical processing increases the dislocation density of SS#cod#x00A0 ...
1
1972
0.5
0.0
... [5] Due to its high yield strength, excellent anticorrosion, and good resistance to hydrogen embrittlement, SS#cod#x00A0 ...
2
1994
0.0
0.0
... [6,7] Huang et al ...
... [6] Whiteman and Millett obtained the longitudinal and lateral stress of SS#cod#x00A0 ...
2
2010
0.0
0.0
... [6,7] Huang et al ...
... [7] They discovered that the shear strength of SS#cod#x00A0 ...
1
1992
0.71
0.0
... [8] In Run B, the T301 stainless steel with an initial thickness of 250#cod#x00A0 ...
2
1986
3.174
0.0
... [9] Silicone oil was also loaded as the pressure transmitting medium (PTM) ...
... [25] The large scatter of the c/a ratio after the magnetic state transition in our and other results[9,25] arises from the influence of differential stress and the transition hysteresis ...
1
1996
0.0
0.0
... The two-dimensional (2D) diffraction patterns were integrated by Fit2D[10] to obtain the 2#cod#x03B8 ...
1
2006
2.355
0.0
... hcp structural phase transition in pure iron[11,12] and induces the #cod#x03B1 ...
1
2004
7.943
0.0
... hcp structural phase transition in pure iron[11,12] and induces the #cod#x03B1 ...
1
2009
7.943
0.0
... [13] the non-hydrostatic stress environment also had influence on the stable structure of GaSb[14] and InSb ...
1
1999
1.489
0.0
... [13] the non-hydrostatic stress environment also had influence on the stable structure of GaSb[14] and InSb ...
1
1999
2.186
0.0
... [15] Consequently, we consider that the onset of the fcc#cod#x2013 ...
2
2001
3.174
0.0
... [16] and Mao et al ...
... 6/GPa,[16]) also exists in hcp pure iron as shown in the results presented by Dewaele et al ...
3
2006
0.0
0.0
... [17] Mao et al ...
... [17] considered that the Ni diffusion plays a significant role in the structure transition ...
... [17] Therefore, this volume collapse would be subtle at ambient temperature, similar to the SS 21-6-9 ...
1
1987
3.174
0.0
... 21-6-9 is least-squares fit with the Vinet EOS[18] to obtain the bulk modulus and its pressure derivative, ...
1
1989
0.71
0.0
... [19] However, the bulk modulus of fcc iron was determined at high temperature, which may soften the material ...
2
1986
3.174
0.0
... 4/GPa,[20] 1 ...
... [20,33,34] ...
3
1990
3.174
0.0
... [32] Our non-hydrostatic results are consistent with Mao[21] and Dewaele#cod#x2019 ...
... [21] ...
... 5/GPa,[21] 1 ...
4
2006
7.943
0.0
... s[22] results, whereas we obtain a larger atomic volume at ambient pressure ...
... 4/GPa[22]) than those above #cod#x223C ...
... 5/GPa,[22] 4 ...
... ,[22] which has been the most accurate result of hcp pure iron to date ...
1
2000
7.943
0.0
1
2008
0.0
0.0
... B)/C)),[24] where A, B, C are fitting constants), we obtain the c/a ratio at infinite compression R#cod#x221E ...
5
2010
2.204
0.0
... [25] determined the c/a ratio of pure iron with increasing pressures carefully by laser heating annealing to minimize the pressure inhomogeneity and to overcome any potential kinetics ...
... [25] Recently, Sakai et al ...
... [25] The large scatter of the c/a ratio after the magnetic state transition in our and other results[9,25] arises from the influence of differential stress and the transition hysteresis ...
... [25] The large scatter of the c/a ratio after the magnetic state transition in our and other results[9,25] arises from the influence of differential stress and the transition hysteresis ...
... [25] The anomaly of c/a at the initial stage of the bcc#cod#x2013 ...
4
2014
0.0
0.0
... [26] replicated the c/a anomalies in pure iron and Fe#cod#x2013 ...
... 598[26]) and Fe#cod#x2013 ...
... 603[26]) ...
... 10Ni alloy is slightly larger than that of pure iron,[26] whereas we consider the difference is due to the scatter of the experimental data points ...
1
2012
1.304
0.0
1
2011
0.0
0.0
1
1992
3.174
0.0
1
2008
2.204
0.0
1
2004
0.0
0.0
1
2013
1.148
1.2429
... [32] Our non-hydrostatic results are consistent with Mao[21] and Dewaele#cod#x2019 ...
1
1998
0.0
0.0
... [20,33,34] ...
1
2014
0.0
0.0
... [20,33,34] ...
Structural and magnetic transition in stainless steel Fe-21Cr-6Ni-9Mn up to 250 GPa*
[Liu Leia)†, Hou Qi-Yuea), Zhang Yia), Jing Qiu-Mina), Wang Zhi-Ganga), Bi Yana), Xu Ji-Ana), Li Xiao-Dongb), Li Yan-Chunb), Liu Jingb)]


 , Hou Qi-Yue