

Extra-seasonal prediction of summer 500-hPa height field in the area of cold vortices over East Asia with a dynamical-statistical method*
[Zhao Jun-Hua)†  , Yang Liu
a), b) , Hou Weia) , Liu Ganga), c) , Zeng Yu-Xinga), c) ]
, Yang Liu|
|


†Corresponding author. E-mail: zhaojh@cma.gov.cn
*Project supported by the National Natural Science Foundation of China (Grant No. 41375078), the National Basic Research Program of China (Grant Nos. 2012CB955902 and 2013CB430204), and the Special Scientific Research Fund of Public Welfare Profession of China (Grant No. GYHY201306021).
The cold vortex is a major high impact weather system in northeast China during the warm season, its frequent activities also affect the short-term climate throughout eastern China. How to objectively and quantitatively predict the intensity trend of the cold vortex is an urgent and difficult problem for current short-term climate prediction. Based on the dynamical-statistical combining principle, the predicted results of the Beijing Climate Center’s global atmosphere–ocean coupled model and rich historical data are used for dynamic-statistical extra-seasonal prediction testing and actual prediction of the summer 500-hPa geopotential height over the cold vortex activity area. The results show that this method can significantly reduce the model’s prediction error over the cold vortex activity area, and improve the prediction skills. Furthermore, the results of the sensitivity test reveal that the predicted results are highly dependent on the quantity of similar factors and the number of similar years.
The cold vortex, which occurs in the northeast China (NCCV) and its surrounding area, is not only an important part of East Asian atmospheric circulation but also a unique and important weather system affecting the climate of northeastern China.[1, 2] Therefore, the cold vortex has been widely investigated by meteorologists since the 1980s, including its formation mechanism, index definition, statistical characteristics, weather and climate impacts, and other aspects. Tao[3] previously pointed out that the cold vortex is a circulation pattern which causes rainstorms and thunderstorms in northern and northeastern China. The active low-potential closure system at the height of 500-hPa (with a cold trough) in northeastern China is defined as the cold vortex by Zheng et al.[4] As suggested by Sun et al., [5] 42% of the summer days (JJA) in northeast China are influenced by the cold vortex, and this characteristic exhibits significant inter-annual variability. The amounts of cold vortex events are an important cause of floods, drought, and low temperature disasters in the northeastern region.[6] The previous studies have mainly focused on the formation, maintenance, evolutionary process, and possible physical mechanisms of a specific cold vortex.[7– 9] These efforts undoubtedly paved the way to understand the cold vortex and provide a prediction basis for it, but most of these efforts have focused on the weather significance. Through further research, scholars have begun to realize that the NCCV plays a significant role in short-term climate anomalies. For example, He et al.[10] indicated that frequent summer NCCV activities have a significant “ climate effect” which not only affects the monthly mean temperature of the lower troposphere in the northeastern region, but also impacts the precipitation in the East Asian rainy season. Therefore, it is of great significance to pay more attention to the research regarding the impact of the summer NCCV on the climate and its prediction over China.
Some encouraging results have been obtained in terms of short-term climate prediction since the 1950s, with the development and application of various mathematical statistical methods and numerical models, especially those involving the research and application of ENSO. However, the current practical prediction level is still not high enough and it produces instable predictions. One important reason for this is the inaccurate prediction of the mid-high latitude circulation patterns. At the Chinese Flood Prediction Session in March every year, ENSO, the West Pacific subtropical high (WPSH), East Asian summer monsoon, and Eurasian mid-high-latitude circulation (including blocking high and NCCV) have been the focus of discussion. In contrast, the prediction of the NCCV is a weak link, which is mainly manifested as the extremely complex formation mechanism and change characteristics of the NCCV, and statistical and diagnostic studies are more commonplace, while predictive research is quite scarce. However, the prediction technique of the numerical models is mainly reflected in the tropics and the ocean, while the technique is very ineffective in the mid-high latitudes.[11] Therefore, how to objectively predict the summer NCCV is an urgent problem, and presents a difficulty for current short-term climate prediction. Recent research shows that the dynamical-statistical combination is an effective way to improve the accuracy of short-term climate prediction.[12] Extensive research has been carried out throughout the world concerning how to effectively combine dynamics and statistics. Among these studies, the use of historical data and information for the prediction of model errors is a compelling research direction.[13] Based on climate model prediction combined with the mathematical statistical method, Chou[14] discussed a theoretical combination of dynamics and statistics in long-term prediction. On this basis, many scholars have developed similar error correction methods which are applicable to seasonal dynamical prediction, and predictive tests have also been conducted.[15– 18] The results of these tests show that this method can effectively improve the prediction technique of tropical precipitation and circulation, but the prediction technique is still very ineffective in the mid- to high-latitude circulation pattern. The development of the summer precipitation dynamical-statistical prediction (DSP) method, i.e., the application of similar-year model error information to realize the prediction of climate model prediction errors in predictive years, may effectively improve the predicted results of the model in recent years.[19– 27] In the 2009– 2012 Chinese summer precipitation predictions, the average of the anomaly correlation coefficient (ACC) of DSP is 0.16, and the predictions are quite stable.[28] In addition, dynamical-statistical seasonal prediction tests were conducted at the 500-hPa height field in the summer Eurasian mid-high-latitude blocking high-pressure areas by Zhao et al., [29] and the results can also effectively improve the model’ s prediction skill.
Based on this, it is necessary to use the new data collected in recent years, along with the results of the numerical models and the DSP principles, to improve the predictive ability of the model on the NCCV. Experiences have shown that the NCCV is mainly active in northeastern China and its surrounding areas, of which the main characteristic is the lower geopotential height at the 500-hPa height field. Therefore, the 500-hPa height anomaly of this area is taken as the object of the DSP. In the present study, according to the DSP principle, more comprehensive data, the global atmosphere– ocean coupled model (CGCM) return developed by the National Climate Center (NCC) in 1983– 2013, and predictive information are used to explore similar historical data. Meanwhile, the key influence factors are determined through the correlation test performed among climatic factors, prediction objects, and model errors. The selected factors are then used to select historical similarity for a dynamical-statistical extra-seasonal prediction test on the 500-hPa height field anomaly in the summer NCCV region.
In this study the monthly mean geopotential height data from NCEP/NCAR reanalysis datasets are used. The monthly 500-hPa height field of the 31a return and prediction in 1983– 2013 generated by the Beijing Climate Center (BCC)’ global atmosphere– ocean coupled model (CGCM) has a horizontal resolution of 2.5 × 2.5° . The ensemble mean results from June to August every year of 48 initial fields reported from the end of February are selected, and the initial NCEP/NCAR reanalysis data of 00Z during the last eight days of February are used as the initial values of the atmospheric model, and the initial value of the ocean is the BCC ocean assimilated data through perturbation.[30] In addition, 74 monthly circulation characteristic indices provided by NCC and 40 monthly climatic indices provided by NOAA are used in this paper. The time period of these two data is from January 1983 to February 2013. In this study, the 30-year average value in 1983– 2012 is taken as the climate state. Dynamical-statistical independent sample prediction refers to the retrospect test, excluding the data of the prediction years and the posterior years.
In general, the numerical prediction is proposed as the initial value of the partial differential equation, which can be mathematically expressed as[17]
where ψ (x, t) is the model prediction variable, x and t denote the spatial coordinate and time, respectively, and L is the differential operator of ψ , corresponding to the actual numerical model. In addition, t0 is the initial time, and ψ 0 is the initial value.
The previous experience of long-term operational prediction shows that under similar initial field and boundary conditions, the evolution of the atmospheric conditions also has certain similarities within a certain range of time scales.[16] Therefore, in the similar dynamical mode, the current prediction field ψ can be considered as the history similarity 


where E is the error operator of the model. Equation (2) is combined with Eq. (1) through a series of transformations, [18] and then the model prediction results can be obtained as follows:

where p̂ (ψ 0) is the prediction result obtained under the similar estimation of the error term, P(ψ 0) is the prediction result of the current initial value ψ 0 by the numerical prediction model, 

The estimated model prediction error can be obtained by the rational use of the model error information implied in the historical observations. This is because the historical observations can be treated as a series of special solutions of the climate dynamical system. Although the mathematical-physical model used for describing the climate system cannot be determined, the special solutions of this model are known. In addition, the similar initial conditions correspond to the deterministic special solutions. Thus, the special solutions are found for the prediction test on the model errors based on the similarity of the initial conditions. The estimation of the model errors can be achieved in two ways: the first is carried out in the model integration process, belonging to the internal combination of dynamics and statistics; and the second is to conduct post-correction processing on the model prediction results after the completion of the model integration, belonging to the external combination of dynamics and statistics. Neither method requires any changes in the dynamical framework of the model, but the theoretical guidance lacks the appropriate correction time on the model error in the case of former integration. If the correction is too frequent, on one hand, the amount of computation will be increased and, on the other hand, the calculation error caused by excessive computing may induce larger model errors, whereas a large number of tests are required to determine the model correction times through experience. Compared with the internal combination, the external combination can achieve a similar improvement effect with less time and effort. Therefore, the error estimation method in this study belongs to the external combination of dynamics and statistics.
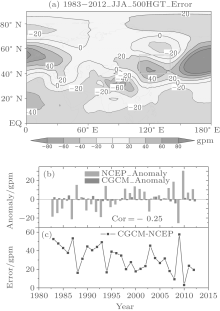
Figure 1 shows the characteristics of CGCM summer 500-hPa geopotential height error (CGCM minus NCEP) in 1983– 2012. As shown in the spatial distribution of the 30-year averaged error field, the height field of the model is lower in the tropical and sub-tropical regions to the south of 40° N, and higher in the most mid-high-latitude regions to the north of 40° N. Especially in the area from northeast China to the northwest Pacific, the height field is higher by 20 gpm or more. In the concerned NCCV regions (green box area in Fig. 1(a)), the height field of the model is significantly higher. As shown in Fig. 1(b), there is a large inter-annual variation in the region of cold vortex of NCEP 500-hPa height anomalies, with a maximum positive anomaly of 30.3 gpm and a minimum negative anomaly of − 25.3 gpm, resulting in a difference of more than 55 gpm. While the inter-annual variation in the height anomaly predicted by CGCM is smaller, with a difference of only 8 gpm between the maximum and the minimum. Moreover, a weak inter-annual correlation with an average of the 500-hPa height field in the NCCV regions exists between the NCEP and CGCM, and the correlation coefficient of 30 years is − 0.25. The inter-annual change in the regional average model errors is also relatively significant, while the change trend is roughly opposite to the NCEP.
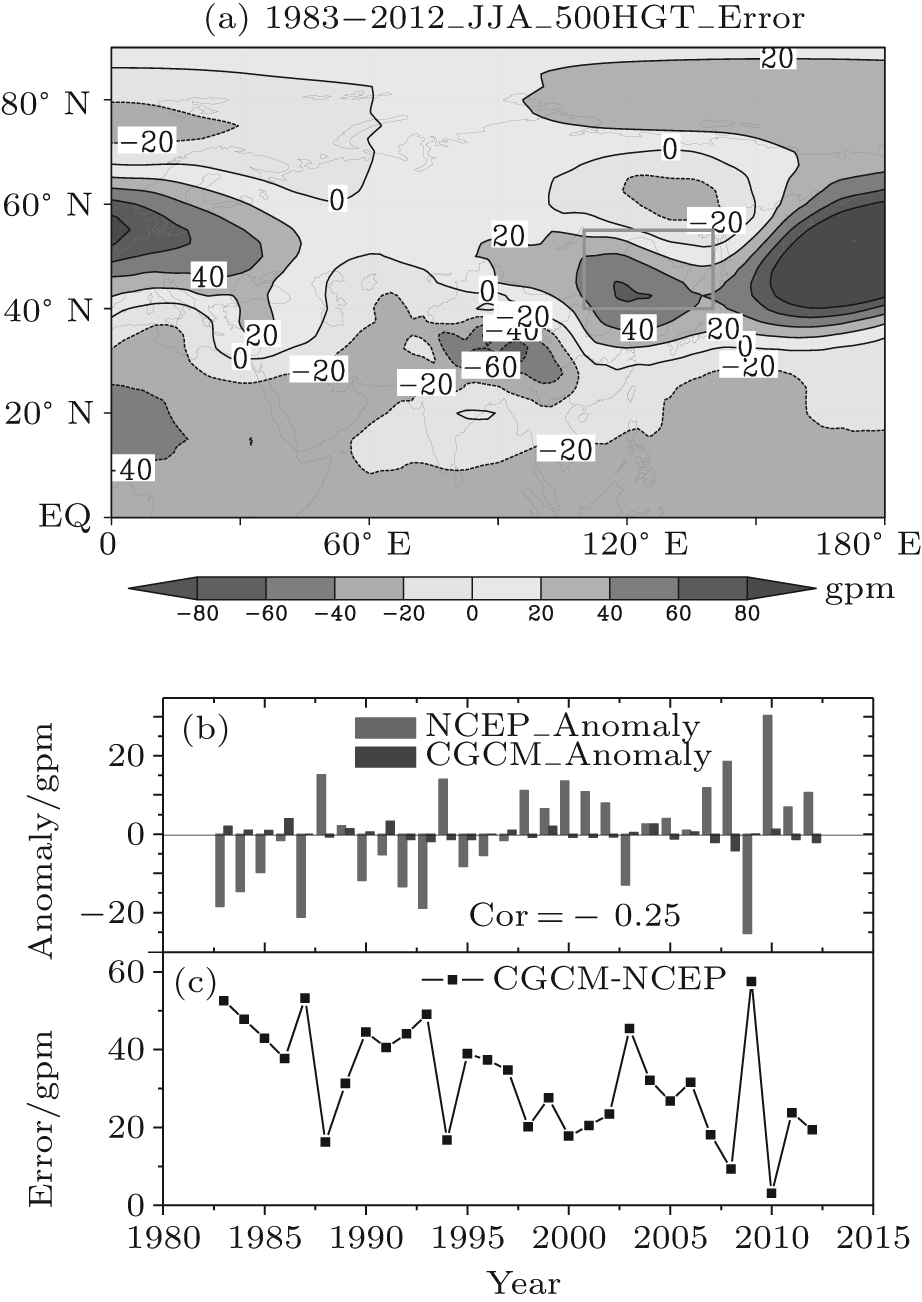 | Fig. 1. Summer 500-hPa geopotential height error characteristics of CGCM. (a) Spatial distribution of 30-year average error field. (b) Inter-annual change of regional height anomaly in NCCV, the red column is geopotential height of NCEP, which stands for observation, while the blue column is geopotential height of CGCM. (c) Inter-annual change of regional error in NCCV, that is CGCM minus CGCM. |
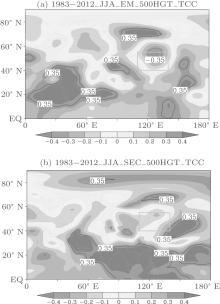
As viewed from the spatial distribution of time correlation coefficient (TCC) at the summer 500-hPa height field in 1983– 2012 obtained through the CGCM model and NCEP reanalysis, the TCC in the tropical and sub-tropical regions is substantially positive with zonal distribution, while it is lower in the regions outside the sub-tropical region, and the positive and negative value areas are scattered. The regions passing the reliability test are mainly located in the subtropical of the northern Hemisphere, and the concerned NCCV region is a negative value center. Since the model prediction results have varying degrees of system deviation (or climate drift) in different regions, a systematic error correction (SEC) is required for the model prediction results, i.e., the average model error of the prediction year minus that of the prior year. As viewed from the 30-year height field after the SEC and TCC distribution of the NCEP, the TCC is increased significantly in the tropics, the northern subtropical region, the Arctic, and other regions. Especially in the area from the west Pacific to the Indian Ocean, the TCC passes the reliability test, but it is still not high in the NCCV area. Kang[11] also pointed out that the prediction techniques of the numerical model are mainly reflected in the tropics and the ocean, and are very ineffective in the mid-high latitudes, which is also a current prevalent problem throughout the world.
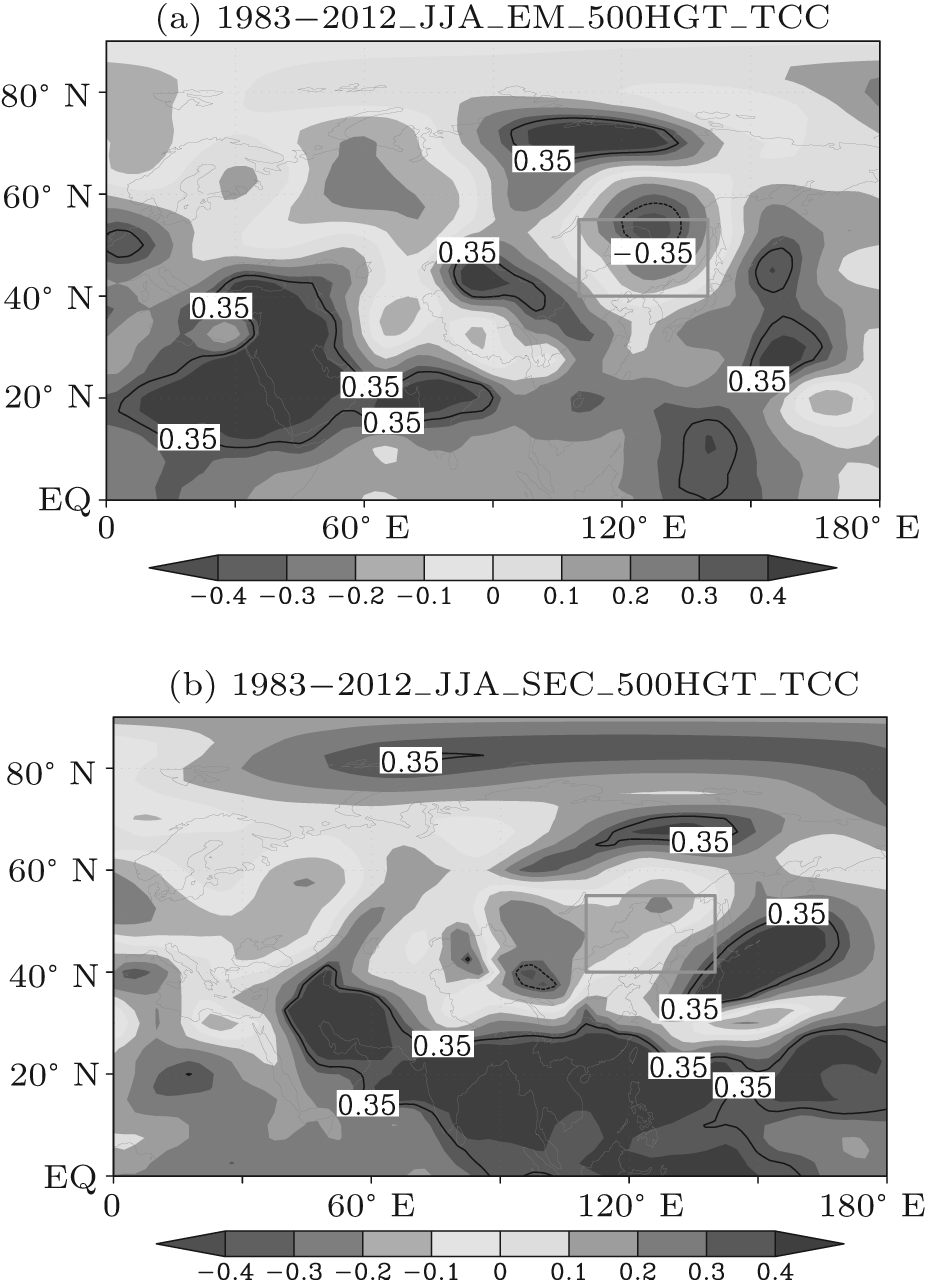 | Fig. 2. Time correlation coefficients of summer 500-hPa height field between CGCM model and NCEP reanalysis in 1983– 2012. (a) TCC between CGCM model results and NCEP, (b) TCC between SEC and NCEP; the contour represents the t test level with 0.05 reliability. |
The above analysis shows that the prediction skills of CGCM on the summer height field are mainly reflected in some tropical and subtropical regions, while in the mid-high latitudes, especially in the NCCV and its surrounding area, the prediction technique is less effective. Based on this, the research regarding targeted DSP strategies and schemes has been carried out for the height field in the key northeastern cold vortex area, and extra-seasonal prediction testing of the actual operational model has been conducted, in order to predict the circulation field in the key areas, thereby increasing the prediction level of precipitation and other elements.
In the DSP process, the historical similarity is first selected from the initial information, then the historical error information is extracted to form the estimation of current prediction error for the correction of the original prediction. The selection of historical similarity is an important link of DSP prediction. Different time and spatial scales of prediction require the use of targeted similar selection schemes. For extra-seasonal prediction at the height field in the summer NCCV area, it is considered to use a generalized initial value, i.e., the key climate factors in the pre-winter element field of model initial value are selected as the similar selection indices, among which the physical basis is the significant rhythm phenomenon for 3– 6 months in the atmosphere during the long-term weather processes.[31] Among these, 114 pre-winter climatic factors are used as the similar selection conditions, including sea surface temperature, atmospheric circulation, and so on. These factors are able to characterize the change characteristics of the primary climate system mode from different angles. The model’ s prediction error is closely related to the changes in climate system state, i.e. the error changes with the state, which has a great relationship with the internal model error dependent on the state variables. When the climatic factors are positively (negatively) correlated to the prediction errors, as the factor index increases (decreases), the prediction error corresponding to the model also tends to increase, and vice versa. Therefore, the simulation ability of the climate model in the case of the factor with larger amplitude is gradually deteriorated, reflecting the fact that the model may not able to adequately describe the physical mechanism of this climate mode. The correlation test then is further carried out between the factors sensitive to the model errors and the regional height field. The pre-winter factor set with impacts and physical significance to the height field in summer NCCV area are diagnosed, and then taken as the similar selection indices.
The following is a specific process of the DSP scheme. (i) The observational and model simulations of the summer averaged 500-hPa height are selected from the 30-year data of NCEP and CGCM, respectively. The annual error is then calculated. Similarly, the winter averages of 114 climate factors of every winter are selected from 1982/1983 to 2011/2012. (ii) The correlation coefficients of 114 pre-winter climatic factors with the average model error field in the summer NCCV area and NCEP height field in 1983– 2012 are calculated, and the factors with both correlation coefficients reaching the t test level of 0.05 reliability are taken as a key factor set. (iii) The Euclidean distance between the prediction year factor and the historical factor is used to select historical similar years for independent sample tests, so as to select the factor with maximum ACC as the final predictor.
Table 1 shows the first six factors with greater correlation coefficients between the regional average summer 500-hPa height field model error and climatic factors in the NCCV area, as well as the correlation coefficients between these factors and the regional average NCEP height field. It can be seen from Table 1 that the influence factors of the summer 500-hPa height field in the NCCV area mainly include the Atlantic and Pacific sea surface temperatures, the polar vortex index in the northern Hemisphere, and so on. These six factors are selected as the similar selection factors of the prediction error field in the NCCV area.
| Table 1. Climatic factors influencing summer 500-hPa height field in NCCV. |
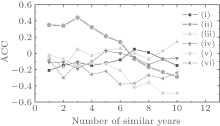
Figure 3 shows the changes in the ACC of the six factors in the DSP average of 500-hPa height anomaly in the NCCV area during 2002– 2012 with the numbers of similar years, in which the ACC returned by Niñ oa is the highest of the six factors. When the similar year is three, the ACC reaches a maximum of 0.45. Thereafter, the ACC is gradually reduced with the increase in the number of similar years and the ACCs returned by the remaining five factors are all low. Previous studies have also indicated that earlier North Pacific SST anomalies may be one of the factors leading to the summer NCCV anomaly. Therefore, in the following sections, the Niñ oa index is selected as the predictors, and there are three similar years.
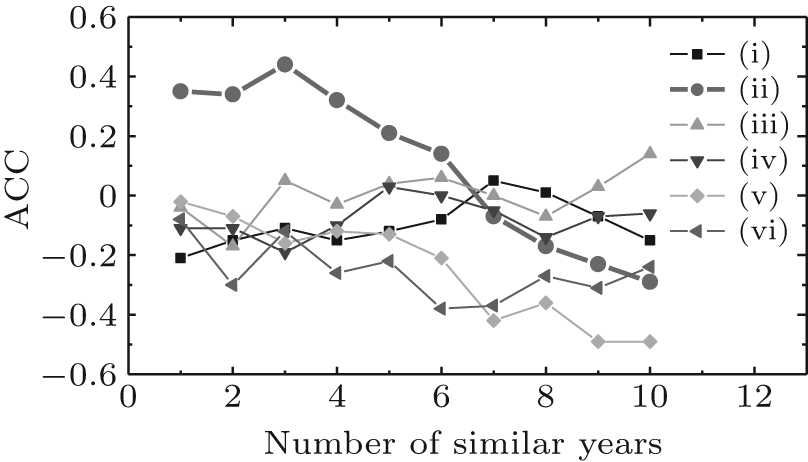 | Fig. 3. Change of returned 11-year average ACC with the number of similar years. (i)– (vi) are the six factors shown in Table 1. |
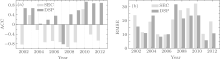
Figure 4 shows the annual variation of ACC and root mean square error (RMSE) of summer mean 500 hPa height anomaly from 2002 to 2012 over the NCCV area, which are returned by SEC and independent sample of DSP. It can be seen from Fig. 4 that the ACC returned by the 11-year DSP in the NCCV area is higher than the 10-year SEC, that in 2007 is slightly lower than the SEC, and the 11-year average ACC is 0.45, which is significantly increased compared with that of − 0.44 returned by the SEC. The 11-year RMSE returned by the DSP is lower in eight years, and slightly higher than the SEC in 2004, 2006, and 2007, in which the 11-year average is 16.8, significantly lower than the average of 19.4 returned by the SEC. Overall, the DSP return effect has been significantly improved with more stable returns than the SEC, and only a small number of years see no obvious improvement, which is not only related to the model prediction level but also reflects the fact that the relationship between the physical factors and the model errors is not very stable with limited data length. It only selects the optimal similar years under the conditions, rather than the absolute similar years.
In summer of 2009, the NCCV was active and frequent with an abnormally lower regional height field, when a correspondingly rare cold damage had occurred in northeastern China during the previous 15 years.[32] The height field of the SEC prediction region is higher in the east and lower in the west, and the characteristic of no abnormally lower regional height field is predicted. The ACCs are predicted as − 0.74, and the RMSE is 28.81. However, the DSP basically predicts the distribution patterns of negative anomaly of the regional height field, and positive anomaly only exists in the regional northeast height field, with the predicted ACC of 0.58 and RMSE of 23.50.
 | Fig. 4. The annual variations of (a) ACC and (b) RMSE of summer mean 500 hPa height anomaly from 2002 to 2012 over the NCCV area, which are returned by SEC and independent sample of DSP. |
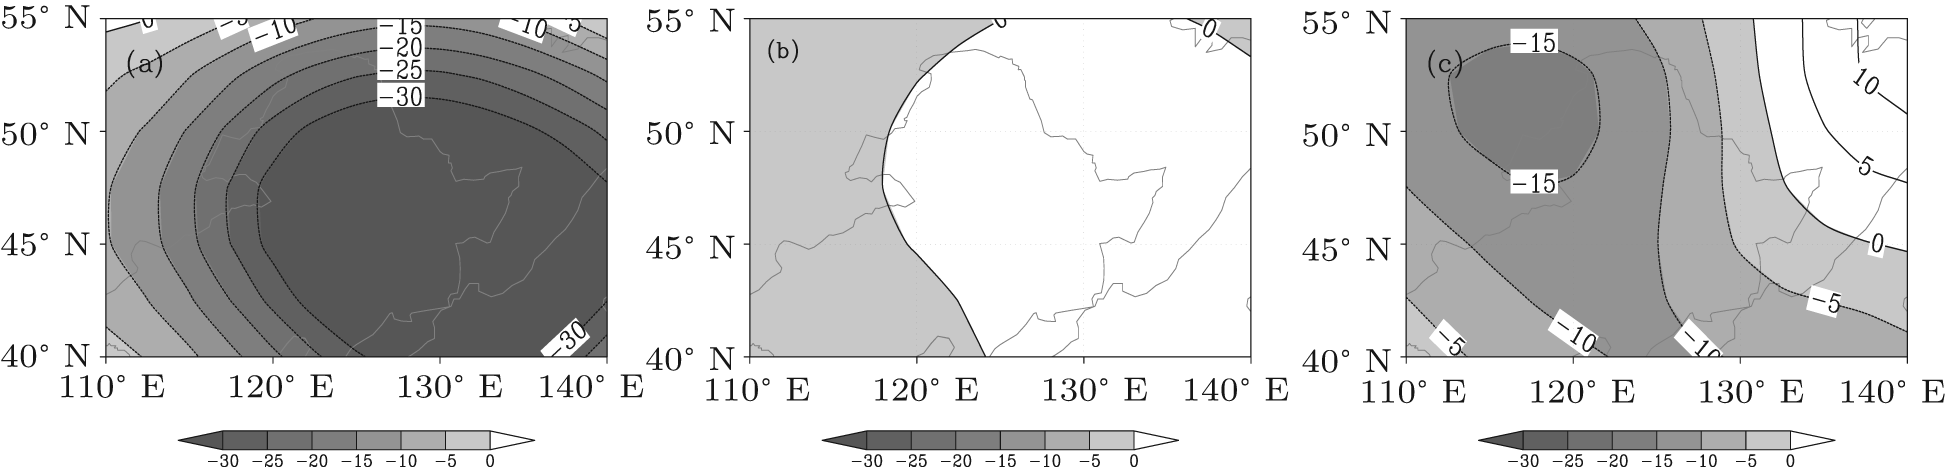 | Fig. 5. Summer 500-hPa height field anomaly (unit: gpm) in NCCV in 2009: (a) NCEP, (b) SEC, (c) DSP. |
Figure 6 shows the 500-hPa height field observations and the actual prediction situation of the NCCV area in the summer of 2013. It can be seen from Fig. 6 that the central-western NCCV area in summer of 2013 is controlled by negative anomalies, which is conductive to the cold vortex activities. The SECs are all positive anomalies, the DSP predictions are all negative anomalies, which is conducive to summer cold vortex activities, the ACC is predicted as − 0.10, and the RMSE is 13.31. However, the DSP basically predicts the distribution patterns of negative anomaly of the regional height field, and the positive anomaly only exists in the regional northeastern height field, with a predicted ACC of 0.55 and RMSE of 11.05.
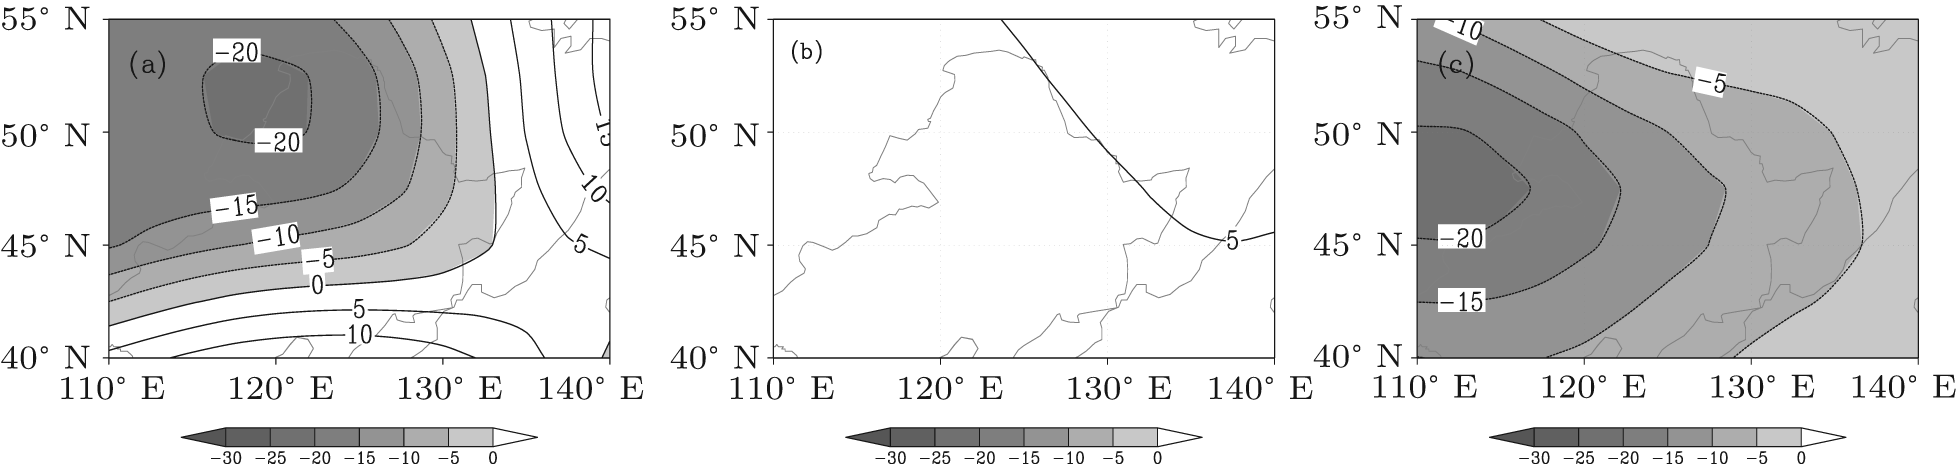 | Fig. 6. Summer 500-hPa height field anomaly (unit: gpm) in NCCV in 2013: (a) NCEP, (b) SEC, (c) DSP. |
According to the predictions of the summer NCCV trend, it is predicted to be rainy in the summer in northeastern China. The DSP can more accurately grasp the summer NCCV trend, providing a strong diagnosis basis for precipitation prediction.
The number of the NCCV has a major influence on the climate of eastern China, while the current short-term climate model is inefficient to predict the mid-high-latitude circulation. Therefore, new research regarding the prediction strategies and methods with dynamical-statistical combination in the mid-high latitudes is very important and meaningful to improve the accuracy of short-term climate prediction. In this study, based on the earlier research concerning dynamical similar prediction strategies and the concept of using historically similar information to predict model prediction error, the predictions of the actual operational model and extensive historical data are used for the dynamical-statistical extra-seasonal prediction testing of averaged 500-hPa height field anomaly in key NCCV areas in summer. For the return test or actual prediction test, their results are relatively ideal, showing that this method can effectively reduce the model prediction error and improve prediction skills.
Due to limited space, this study only provides the single-factor prediction test scheme of summer NCCV, while the adjustment of the summer monthly cold vortex trend and configuration of the sub-tropical and other systems are key factors for determining summer drought or flood. Since there are many factors impacting the NCCV, only one single factor method could lead to instable and insignificant predictions. Therefore, multi-factor combined prediction schemes and strategies are needed in future work. In addition, with the further enrichment of historical data and constant improvement of numerical models, historical data may more effectively describe the actual atmosphere state in the prediction period, while numerical models can also provide a greater amount of useful information, so that the DSP method may be used more widely.[33– 36]
| 1 |
|
| 2 |
|
| 3 |
|
| 4 |
|
| 5 |
|
| 6 |
|
| 7 |
|
| 8 |
|
| 9 |
|
| 10 |
|
| 11 |
|
| 12 |
|
| 13 |
|
| 14 |
|
| 15 |
|
| 16 |
|
| 17 |
|
| 18 |
|
| 19 |
|
| 20 |
|
| 21 |
|
| 22 |
|
| 23 |
|
| 24 |
|
| 25 |
|
| 26 |
|
| 27 |
|
| 28 |
|
| 29 |
|
| 30 |
|
| 31 |
|
| 32 |
|
| 33 |
|
| 34 |
|
| 35 |
|
| 36 |
|