


Dielectric behaviors at microwave frequencies and Mössbauer effects of chalcedony, agate, and zultanite*
[Paralı Leventa)†  , Şabikoǧlu İsrafil
b) , Tucek Jiric) , Pechousek Jiric) , Novak Petrc) , Navarik Jakubc) ]
, Şabikoǧlu İsrafil|
|

 , Şabikoǧlu İsrafil
†Corresponding author. E-mail: levent.parali@cbu.edu.tr
*Project supported by the Project LO1305 and Operational Program Education for Competitiveness-European Social Fund of the Ministry of Education, Youth and Sports of the Czech Republic (Grant No. CZ.1.07/2.3.00/20.0155), and the Internal Student Grant IGA of Palacky University in Olomouc, Czech Republic (Grant No. IGA PrF 2014017).
In this study, dielectric properties within 8–12 GHz microwave frequencies, inductively coupled plasma-atomic emission spectrometry, Fourier transform infrared spectrometry, synchronized two thermal analyses, and57Fe Mössbauer spectroscopy analysis of chalcedony, agate, and zultanite samples from Turkey are presented. Agate and chalcedony show the same nine vibrational absorption peaks obtained unlike zultanite from FTIR spectra in the 350 cm−1 to 4000 cm−1 range, ε′ values of chalcedony, agate and zultanite derived at 10.5 GHz were 4.67, 4.41, and 7.34, respectively, ε′ and ε″ values of the studied samples at the microwave frequencies are related to the percentage weight of their constituent parts in their chemical compositions.57Fe Mössbauer spectroscopy results confirm the existence of iron-containing islands in the crystal structure of zultanite, agate, and chalcedony samples, equipped them with magnetic features typical for magnetic nanoparticles including superparamagnetism. The presence of iron-containing islands significantly affects the magnetic, dielectric, and optical properties of studied samples that are not observed for pure minerals without any foreign inclusions.
In natural minerals, the electrical properties of heterogeneous systems are an important research topic because they are significantly affected by sample bulk concentrations, variations in the chemical compositions, water saturation, and crystalline structures. In particular, various microstructures are evolved in the crystal lattice of mineral systems during their formation modify electrical features of heterogeneous systems. In the microwave frequency region, most natural minerals possess accurate dielectric values that are unchanging according to frequency. For this reason, to monitor dielectric properties of natural minerals in detail, microwave frequencies are often employed.[1] For instance, the precise dielectric properties of natural minerals at microwave frequency are required for their use in planning ground-penetrating radar surveys for imaging subsurface and in mapping of the surface deposited minerals.[2– 5] Microwaves are non-ionizing electromagnetic waves, the frequency of which covers the field of the electromagnetic spectrum ranging from 0.3 GHz to 300 GHz. Corresponding to the wavelengths ranging from 1 m to 1 mm (between radio waves and infrared radiation).[6]
The dielectric constant of a material is defined as ε * = ε ′ – jε ″ , where j is the complex unit (i.e., (− 1)1/2), ε ′ and ε ″ are the real and imaginary parts of the dielectric constant. Another parameter commonly used to assess the dielectric loss is the loss tangent (tanδ ), which is determined as the phase difference between the alternating field and the reorientation of the dipoles in the material, which is defined as tanδ = ε ″ /ε ′ .[7]
In this paper the dielectric properties of chalcedony, agate, and zultanite minerals at microwave frequencies were explored. Furthermore, ICP-AES, FTIR, and TGA/DTA properties of these minerals were investigated for the purpose of associating those properties with their dielectric characteristics. In addition, 57Fe Mö ssbauer spectroscopy was employed for analysis of iron containing fractions present in the samples identifying the evolution of magnetic phenomena typical for magnetic nanoparticles, including superparamagnetism. The presence of foreign iron-bearing inclusions significantly alters the band structure of minerals resulting in the emergence of the new physical features.
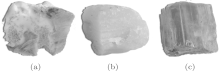
Chalcedony, agate, and zultanite (Anatolian Diaspore) mineral samples were obtained from natural sources in Turkey. More specifically, the chalcedony sample comes from the Sarı cakaya-Eskiş ehir region, the agate sample originates from the İ ö nü -Eskiş ehir region, and the zultanite (known as Anatolian Diaspore before trademarked in 2005 as zultanite)[8] sample comes from the Milas-Muǧ la region (see Fig. 1).
 | Fig. 1. Cross section of all minerals: (a) chalcedony, (b) agate, and (c) zultanite. |
Chemical analyses of the samples were conducted using inductively coupled plasma-atomic emission spectroscopy (ICP-AES) for trace elements, and WST-SIM to determine ignition losses. These analyses were performed and certified with the code number IZ12158284, under contract by the accredited ALS Chemex Laboratory in Canada.
The dielectric properties (ε ′ and ε ″ values) of the samples were monitored using a Hewlett– Packard 8410A Series Vector Network Analyzer (VNA) for X-band frequencies (8– 12 GHz.) at room temperature. An X-band rectangular wave guide used as the sample holder (WR 90 wave guide size: 22.86 mm × 10.16 mm). Each sample was cut by a diamond wheel cutter to achieve plates with dimensions of about 22.8 mm × 10.16 mm and with a thickness of ∼ 2.5 mm; the surfaces of samples were polished to secure the best conductivity. The measurement system was calibrated with open-circuit and short-circuit calibration methods, ε ′ and ε ″ values were determined at the microwave region from measured values of magnitude and phase shift of the reflection parameter (S11) and transmission parameter (S21) and by using the procedure improved by Hewlett Packard Corporation.[9]
The Fourier transform infrared (FTIR) absorption spectra of the samples in the mid-infrared region were measured at room temperature employing a Perkin Elmer FT-IR system. Samples were pestled by mixing 1/100 weight of the studied mineral and potassium bromide (KBr) in the mortar. All of the measurements are reported in the spectral range of 350– 4000 cm− 1.
The thermal properties of the studied samples were evaluated on a Perkin Elmer Diamond TGA/TDA instrument. A weighed amount of the sample to be analyzed was placed in a cylindrical alumina crucible mounted on one of the alumina rods, which were 2 mm in diameter. The sample was heated from room temperature up to 1400 ° C at a constant rate of 5 ° C/min in a dynamic air atmosphere
The 57Fe Mö ssbauer spectra of studied samples were measured at room temperature employing a MS2007 Mö ssbauer spectrometer based on virtual instrumentation technique, [10, 11] operating at a constant acceleration mode and equipped with a 57Co(Rh) source. The acquired Mö ssbauer spectra were processed (i.e., noise filtering and fitting) using the MossWinn software program. The isomer shift values were referred to α -Fe foil sample at room temperature.
Chemical analyses of chalcedony, agate silica (SiO2) varieties, and zultanite aluminum oxide (Al2O3) showed that the loss on ignition (LOI) with respect to their silanol (SiOH) and hydroxyl group water content amounts to 3.84%, 4.39%, and 15.0% for chalcedony, agate, and zultanite, respectively (see Tables 1 and 2). It is obviously seen that the LOI value for zultanite is significantly higher than that observed for chalcedony and agate.
| Table 1. Chemical analyses results of chalcedony, agate, and zultanite. |
| Table 2. ALS Chemex Laboratory' s analysis codes. |
From the FTIR spectra, sample composition, structural point defects, structural bonds, and information on coordination number of ions and other mineral species can be derived.[12] FTIR measurements were conducted to indicate vibration ranges of hydroxyl (in particular, the peak from 4000 cm− 1 to 2500 cm− 1 comes from O– H stretching vibration), [13] the water species both free and bound molecular (H2O), silica and alumina mineral building components and contents, structural bonds and point defects, etc.[14– 16] Therefore, the initial included water in all mineral species can be separated into three groups, i.e., the hydroxyl (OH) group located at structural defects, surface hydroxyls hydrogen bonded to each other (H— O– H), and free molecular water (H2O). In addition, Al– O and Si– O stretching modes can be identified.
Chalcedony and agate have nine vibrational absorption peaks located in the range of 350 cm− 1– 4000 cm− 1 (see Fig. 2). The vibration peaks at 459 cm− 1 and 562 cm− 1 can be attributed to the vibration places of mineral host elements or impurities in the minerals.[14, 15] In addition, Schmidt and Frö hlich[17] reported that the vibration peak at 555 cm− 1 (very close or the same peak at 562 cm− 1) can be assigned to Si– O vibrations from non-bridging oxygen apices of SiO4 tetrahedra. The peaks at 693 and 790 cm− 1 can be attributed to symmetric stretch of Si– C, [18] the peak that 1893 cm− 1 can be attributed to symmetric C– O bond, [16, 18] and the peak at 1086 cm− 1 can be assigned to the asymmetric Si≡ O≡ Si stretching. Furthermore, the peaks at 2859 cm− 1 and 2928 cm− 1 correspond to the symmetric and anti-symmetric vibration modes of CH2, respectively.[19] The peak at 3611 cm− 1 can be assigned to the vibration of free OH stretching.[20, 21]
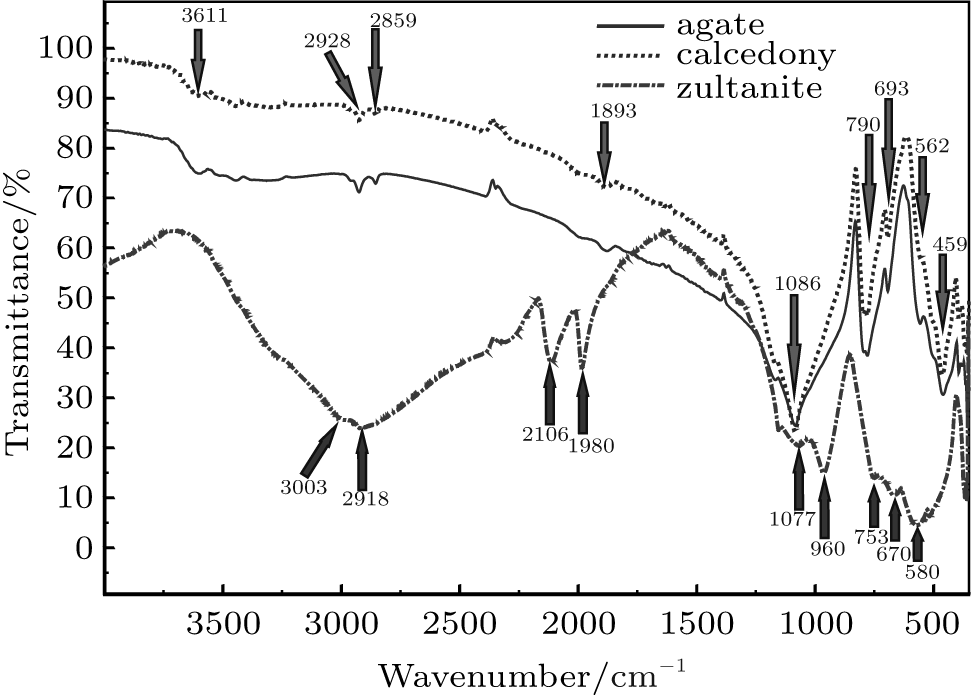 | Fig. 2. FTIR spectra of chalcedony, agate, and zultanite. |
Zultanite has several vibrational absorption peaks. The peak at 580 cm− 1 may be attributed to the vibration places of the mineral host elements, the peaks at 670, 753, 960, and 1077 cm− 1 can be related to stretching vibrations associated with a Si– O bond originated from donbassite and quartz impurities in the zultanite (Anatolian Diaspore). The peaks at 1980 and 2106 cm− 1 are the second harmonic of two peaks at 960 and 1077 cm− 1. At the same time Hatipoǧ lu et al. reported peaks at 950 and 2100 cm− 1. These peaks are very close to the given values in this work, and they are attributed to the vibration of an Al– O structure (AlO4).[22] In addition, there are two broad peaks at 2918 and 3003 cm− 1. These peaks can be related to the vibrations of OH groups in the water species.[23, 24]
The TGA technique was widely used to monitor the CO2 losses caused by decomposition of carbonates and water (H2O) release from hydroxides. The DTA technique is a solubility measurement.[22, 25] Thermal decomposition characteristics of the ore samples were initially determined by thermogravimetric analysis (TGA), which is performed by recording the changes in sample mass with respect to temperature. Differential thermal analysis (DTA) enabled understanding of heating profile in detail. Endothermic and exothermic parts of the thermal decomposition of material in air/nitrogen atmosphere were analyzed by the measurement results. Thus, chalcedony, agate, and zultanite were heated from room temperature to 1400 ° C at a constant rate of 5 ° C/min.
To calculate the water contents in the form of H2O and/or HO for all minerals, as defined in Brand et al., [26] the following formula was used:[27]

The average water contents in chalcedony, agate, and zultanite samples were found to be 1.29, 1.30, and 1.39 wt%, respectively.
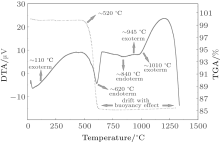
From the TGA/DTA curve of chalcedony (see Fig. 3), it is evident that there are two different mass losses at about 823 ° C and 892 ° C; the total mass loss is ∼ 3%. These mass losses may be due to dehydration of silanol (SiOH) group water.[28] The mineral is endothermic at room temperature to 1400 ° C. As can be further seen in Fig. 3, the buoyancy effect is observed during heating process at 52– 850 ° C over the smooth line.
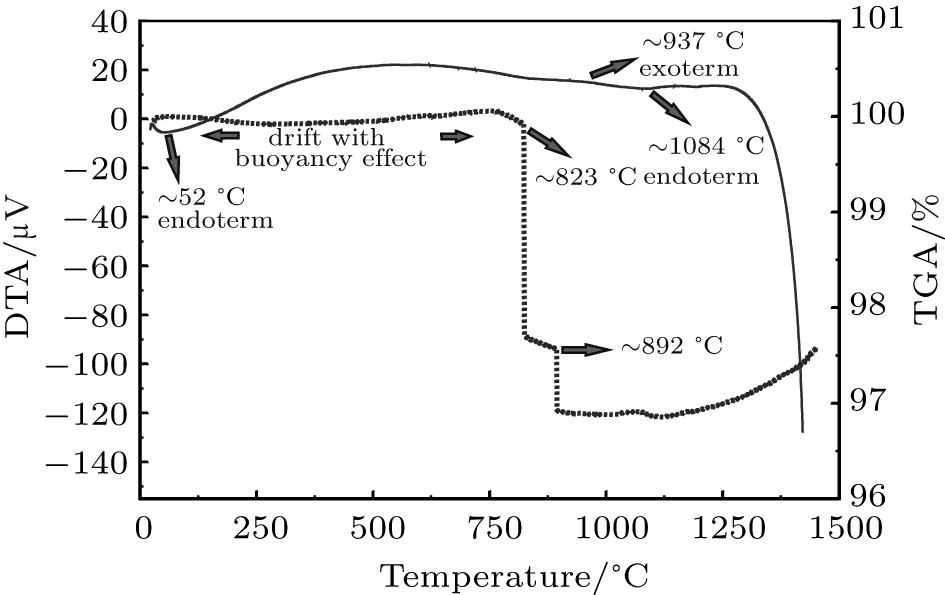 | Fig. 3. TGA/DTA analyses of chalcedony. |
Agate TGA/DTA results are depicted in Fig. 4. Agate shows a mass loss at ∼ 784 ° C; the total mass loss is ∼ 37%. The mass loss occurring at about 784 ° C is due to the condensation of hydroxyl units and the formation of H2O.[26] The deviation observed in the dotted blue lines corresponds to the effect of buoyancy.
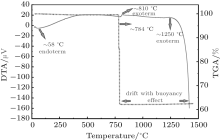
As seen in Fig. 5, zultanite shows a mass loss at ∼ 520 ° C; the total mass loss is ∼ 14.8% at 520 ° C to 625 ° C. This mass loss results from dehydroxylation.[22] Zultanite is exothermic from room temperature to 1400 ° C. The broad exothermic behavior may be attributed to the transformation of (AlOOH) minerals. The sharp endothermic peak occurring at about 600 ° C is probably due to dehydroxylation of the hydroxyl water (AlOH) content in the crystals.[22]
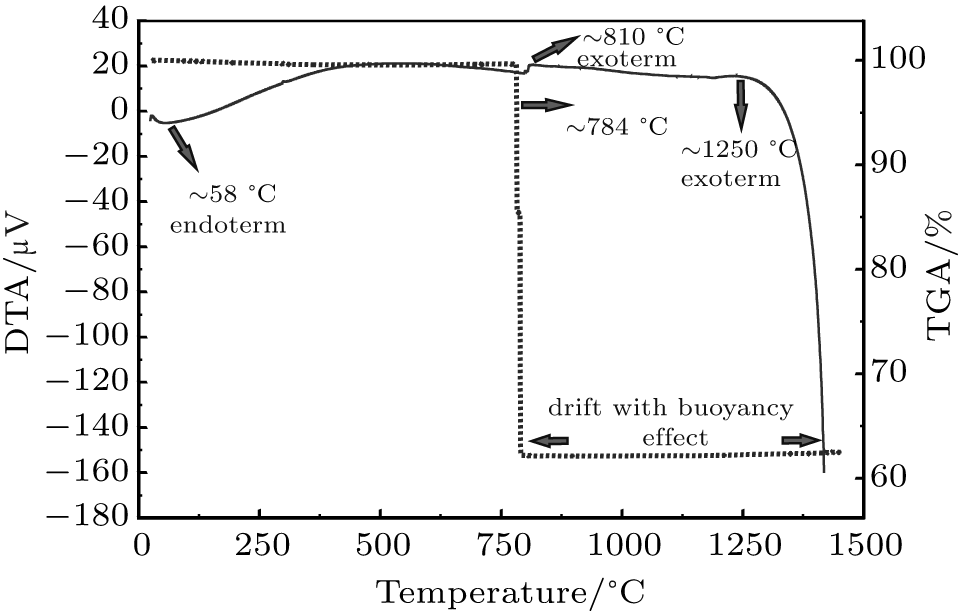 | Fig. 4. TGA/DTA analyses of agate. |
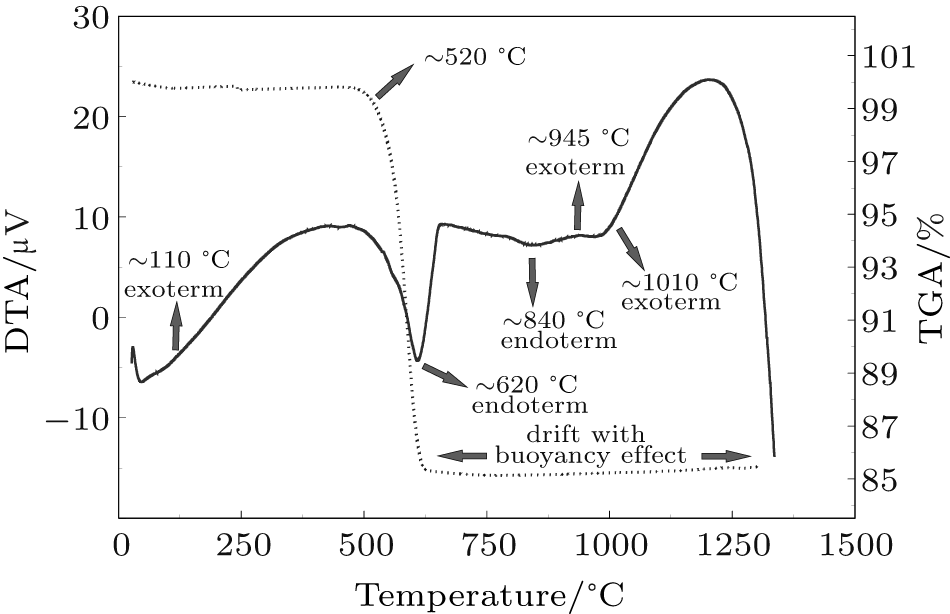 | Fig. 5. TGA/DTA analyses of zultanite. |
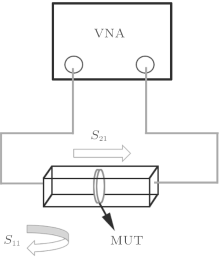
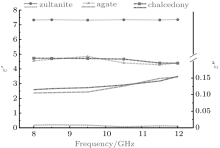
The dielectric characteristics of chalcedony, agate, and zultanite were studied using a VNA system (see Fig. 6), and the results are shown in Fig. 7. The evaluated values of ε ′ and ε ″ at 10.5 GHz are listed in Table 3.
 | Fig. 6. Scheme of measurement of scattering parameters (S11 and S21). (MUT: material under test). |
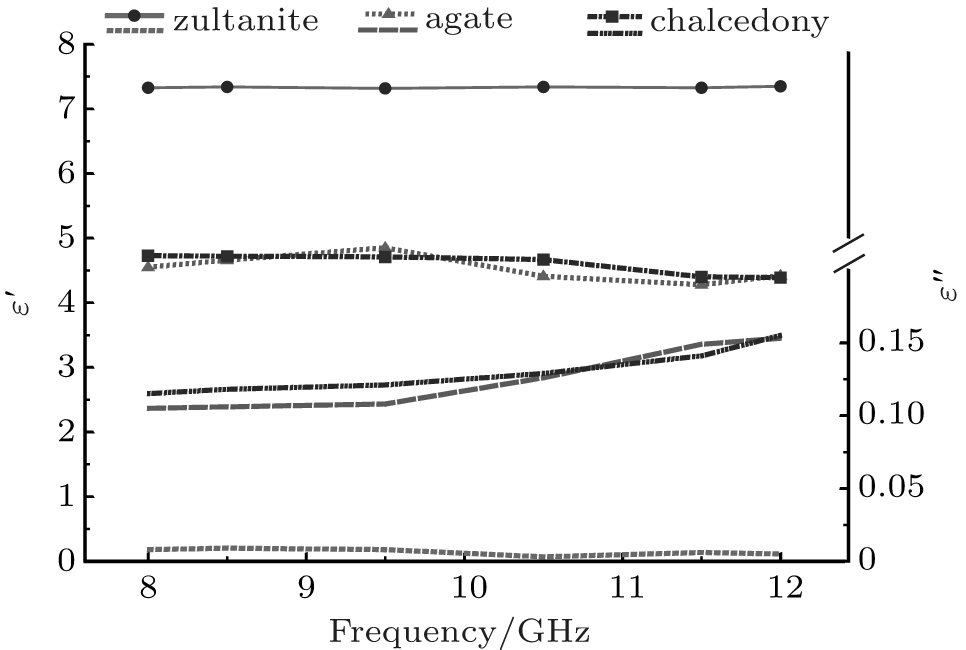 | Fig. 7. Changes of ε ′ and ε ″ of chalcedony, agate and zultanite at X-band. |
| Table 3. ε ′ , ε ″ , and tanδ values of chalcedony, agate, and zultanite at 10.5 GHz. |
Chalcedony and agate, according to their chemical analysis, have 89.3% and 91.2% SiO2 ratio, respectively. Silica-based chalcedony and agate ε ′ values were measured and were found to be equal to 4.67 and 4.41, respectively, at 10.5 GHz. microwave frequency. These results are comparable with the results reported by Fawwaz et al.[29] and Xiangyun et al.[30] who measured the ε ′ values at 0– 18 GHz microwave frequency.
The ε ′ values of chalcedony and agate samples can be more likely explained in terms of very high percentage of SiO2, and less likely by a very low percentage of Fe2O3, CaO, and MgO in the chemical composition.
The ε ″ values of chalcedony and agate were found to be 0.129 and 0.126, respectively. These results are very similar to those reported in the work by Fawwaz et al. who studied silica-based volcanic rocks for which ε ″ value amounted to 0.08 and 0.1, respectively.[29]
Zultanite shows a different chemical composition than chalcedony and agate samples. (Al2O3:75.4%, Fe2O3:1.39%, SiO2:1.28%, LOI:15%). After an extensive literature search, we found no studies related to zultanite dielectric properties at microwave frequencies. Zultanite ε ′ value at 10.5 GHz was found to be 7.34. This measurement is very similar to that of Takubo et al.[31] who reported 7.7, 8.38, and 7.27 at 1 MHz. In addition, Shannon et al.[32] reported ε ′ = 8.443 at 1 MHz frequency for diaspore coming from Turkey. Zultanite observed ε ′ value is more related to the Al2O3 percentage weight in its chemical composition and less related to the Fe2O3 and SiO2.
Zultanite ε ″ value equal to 0.003 is very close to zero with tanδ = 0.0004. In the work by Shannon et al., the diaspore tanδ values were found to 0.0007, 0.0008, and 0.0009 at 1 MHz. frequency.[32]
In order to get a deeper insight into the physicochemical properties of zultanite, agate, and chalcedony samples, 57Fe Mö ssbauer spectroscopy was employed. It is an element selective and local method when the iron nucleus acts as a probe monitoring physical and chemical features of its surroundings through hyperfine interactions of electric and magnetic nature, i.e., interactions between nucleus of iron atom and its electronic shell and surrounding lattice (neighboring atoms, local electric and magnetic fields).[33] Thus, if iron atoms are introduced into a non-iron containing material, then they convey crucial information on the local characteristics that are hardly derived by other techniques.
| Table 4. Values of the Mö ssbauer hyperfine parameters, derived from the room-temperature Mö ssbauer spectra of zultanite, chalcedony, and agate sample, where δ is the isomer shift, ε Q is the quadrupole shift, Δ EQ is the quadrupole splitting, Bhf is the hyperfine magnetic field, and RA is the spectral area of individual spectral components. |
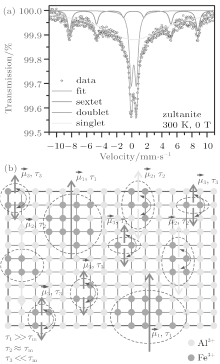
The 57Fe Mö ssbauer spectrum of zultanite sample, recorded at room temperature and without an external magnetic field is depicted in Fig. 8(a); the values of the Mö ssbauer hyperfine parameters derived from spectrum fitting are listed in Table 4. The deconvolution of the Mö ssbauer spectrum gives three spectral components, i.e., a sextet, doublet, and singlet. For all the three spectral components, the values of the isomer shift fall in the range expected for Fe3+ ions in a high-spin state (i.e., S = 5/2) in an orthorhombic crystal environment.[33] Their presence can be interpreted in terms of formation of iron-containing islands in the structure of zultanite (see Fig. 8(b)). In nature, it is frequently observed that zultanite (or diaspore, AlOOH) contains iron as a result of the Fe3+ -for-Al3+ substitution, the degree of which affects, in particular, its optical and magnetic properties.[34] These iron islands behave in a similar manner as ultrasmall magnetic particles showing a magnetic moment known as a superspin, μ .[35] The superspin may lie along particular axes favored by particle magnetic anisotropy. If the uniaxial character of magnetic anisotropy is assumed, then two energetically stable orientations of the superspin exist, i.e., up and down orientations, separated by a magnetic anisotropy barrier the high of which depends on the particle size and strength of magnetic anisotropy (i.e., contributions of individual magnetic anisotropy terms such as magnetocrystalline anisotropy, shape anisotropy, surface anisotropy, etc.).[35] If the temperature increases, for a definite particle size, then the thermal energy may exceed the anisotropy barrier energy and the particle superspin starts to thermally fluctuate between these two directions, spending a certain time in one orientation known as a relaxation time, τ . These spontaneous thermally activated reversals of particle superspin are described as superparamagnetic fluctuations and are, among others, related with the time window (characteristic measuring time) of a given experimental technique.[35, 36] If this theory is adopted, then we may assign a superspin, μ , to each iron-containing island in the zultanite structure. In each iron island, the magnetic moments of all iron atoms (ions) cooperate with each other giving a magnetically ordered structure characterized by the superspin (see Fig. 8(b)). The size of the iron island determines the height of anisotropy barrier separating energetically favorable orientations of the island superspin and hence the amount of thermal energy to overcome it. Thus, at room temperature, differently-sized iron islands show different relaxation times, τ . For the smallest iron islands, at 300 K, τ is significantly smaller than the characteristic measuring time, τ m, of the Mö ssbauer technique (∼ 10− 8 s). The island superspin shows superparamagnetic fluctuations (see Fig. 8(b)) contributing to the doublet component. For iron islands with sizes corresponding to τ ≈ τ m at 300 K (i.e., middle-sized iron islands, see Table 4), an onset of superparamagnetic relaxation (see Fig. 8(b)) is observed yielding a broad singlet component. For the largest iron islands, at 300 K, τ is significantly higher than τ m; the island superspin is blocked in one particular orientation favored by the island magnetic anisotropy (see Fig. 8(b)), thus giving a magnetically split spectral component. Thus, the appearance of sextet, doublet and singlet components can be understood in terms of size distribution of iron islands in the zultanite crystal structure and a corresponding distribution in the relaxation time. Note a high value of the hyperfine magnetic field evolved in the largest iron islands, implying the presence of strong magnetic interactions of the exchange type between Fe3+ ions mediated by oxygen anions. In other words, the existence of differently-sized iron islands in the zultanite structure significantly modifies the band structure of zultanite equipping it with magnetic, dielectric, and optical features not observed in pure zultanite.[34] The presence of mostly larger iron-containing islands may cause significant reduction in the ε ″ value.
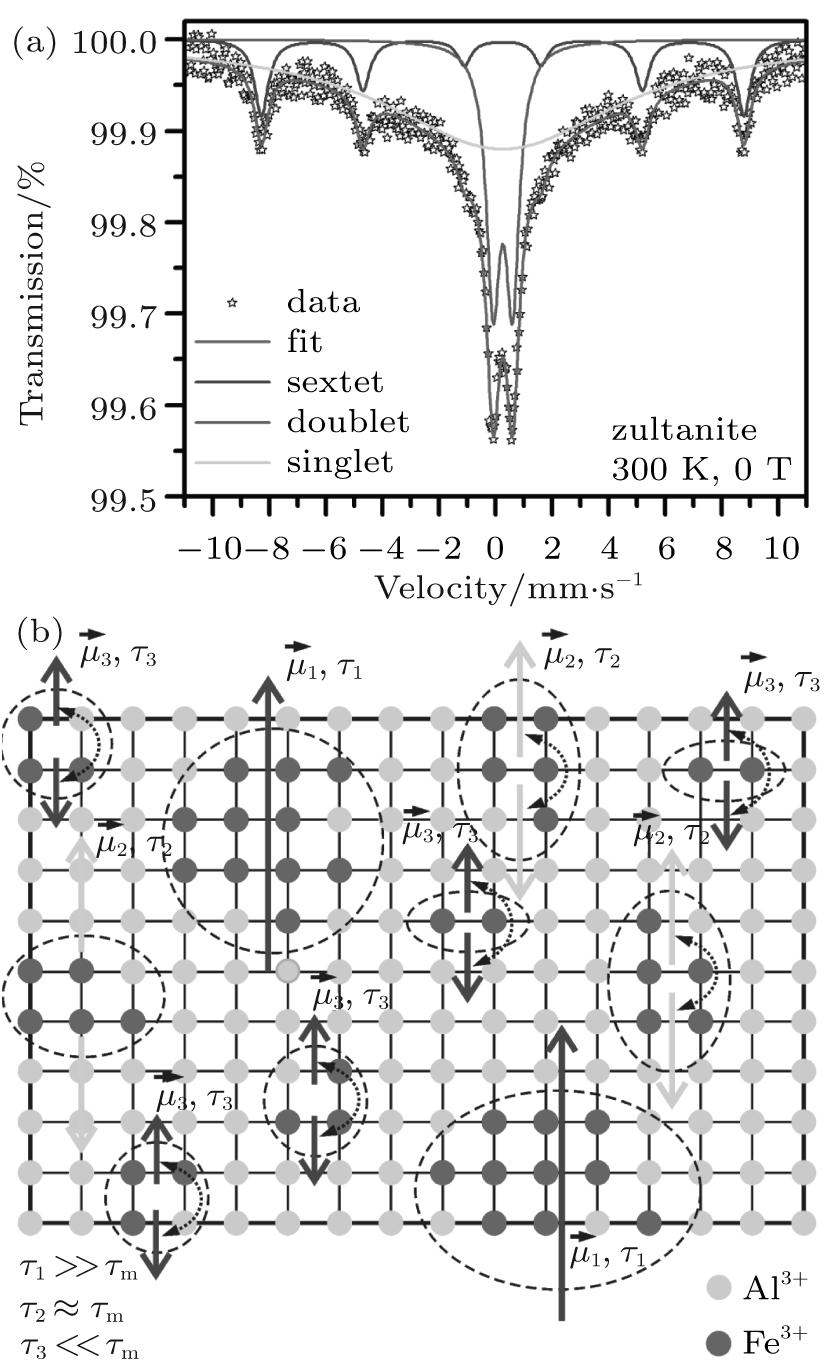 | Fig. 8. (a) Room-temperature Mö ssbauer spectrum of the zultanite sample and (b) schematic representation of iron islands inside zultanite crystal structure (O and H atoms are omitted for the sake of clarity), where μ i(i = 1, 2, 3) is the magnetic moment of iron island, τ i(i = 1, 2, 3) is the relaxation time of a iron island magnetic moment, and τ m is the characteristic time of the Mö ssbauer technique (the arrows indicate reversal of iron island magnetic moment between favored orientations). |
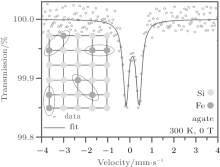
The Mö ssbauer spectrum of the agate sample, recorded at room temperature and without an external magnetic field is depicted in Fig. 9. The values of the Mö ssbauer hyperfine parameters derived from spectrum fitting are listed in Table 4. The room-temperature Mö ssbauer spectrum shows only one doublet component indicating the presence of iron-containing islands in the structure of agate (see inset in Fig. 9). Following the value of the isomer shift, they are most probably of iron (III) oxide nature.[33, 34] They are very small and their relaxation time is much smaller than τ m of the Mö ssbauer technique, thus behaving in a superparamagnetic manner. The symmetric profile of the doublet implies random distribution and spatial orientation of iron-containing islands within the crystal structure of agate (see inset in Fig. 9).[33] The relatively smallsize of iron-containing islands does not significantly alter the ε ″ value as in the case of zultanite for which much larger sized islands were observed.
 | Fig. 9. Room-temperature Mö ssbauer spectrum of the agate sample. The inset shows schematic representation of iron islands in the crystal structure of agate (O atoms are omitted for the sake of clarity). |
The Mö ssbauer spectrum of the chalcedony sample, recorded at room temperature and without an external magnetic field is depicted in Fig. 10; the values of the Mö ssbauer hyperfine parameters derived from spectrum fitting are listed in Table 4. Similarly to the agate sample, the room-temperature Mö ssbauer spectrum of the chalcedony sample displays only quadrupole split component with the values of Mö ssbauer hyperfine parameters resembling those expected for iron(III) oxide.[33, 34] The reduced value of the isomer shift most probably reflects the sensitivity of the island towards its surrounding due to its small size (i.e., the island significantly feels its local environment through hyperfine interactions). Analogously to the agate sample, the iron-containing islands show superparamagnetic behavior because the related relaxation times are smaller than τ m. However, contrary to the agate sample, the doublet profile is asymmetric implying an internal texture in the crystal lattice. This most probably arises from ordered and regular distribution of iron-containing islands (see inset in Fig. 10) resulting in the preferential orientation of the island quadrupole moment with respect to the electric field gradient tensor at the island place.[33] As already stated in the case of the agate sample, the relatively small size of iron-containing islands found in the chalcedony crystal structure does not significantly affect the ε ″ value, as observed in the zultanite sample featuring much bigger islands.
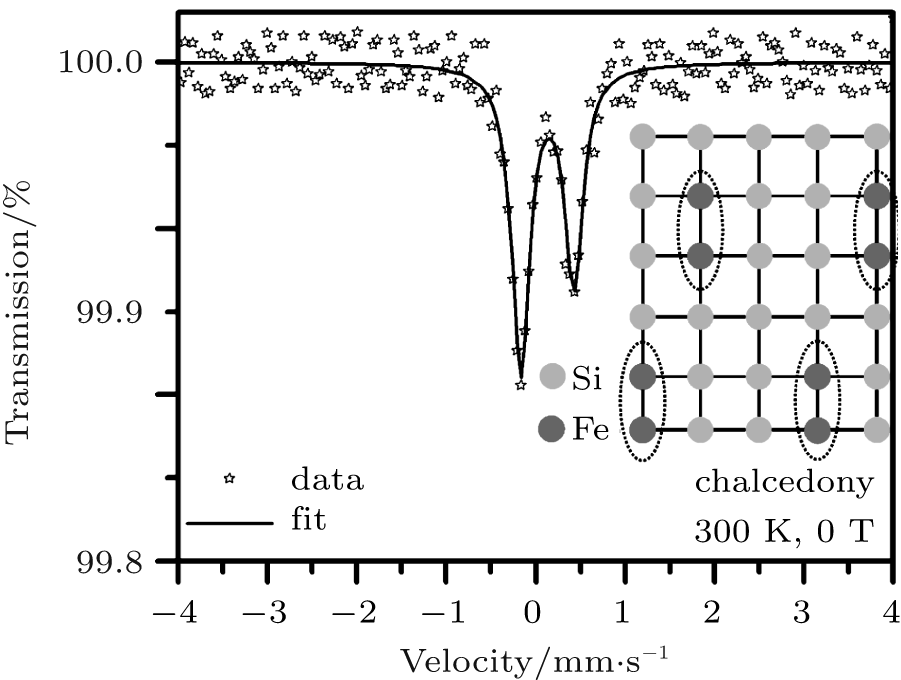 | Fig. 10. Room-temperature Mö ssbauer spectrum of the chalcedony sample. The inset shows schematic representation of iron islands in the crystal structure of chalcedony (O atoms are omitted for the sake of clarity). |
The values of ε ′ and ε ″ at X-band of microwave frequency range were obtained for chalcedony, agate, and zultanite from Turkey for the first time. SiO2 is predominant with respect to ε ′ of chalcedony and agate while Al2O3 is predominant according to ε ′ of zultanite. Chalcedony and agate have similar dielectric (ε ′ and ε ″ ) and FTIR properties. 57Fe Mö ssbauer spectroscopy results confirm existence of iron-containing islands in the crystal structure of zultanite, agate, and chalcedony equipping them with magnetic features such as superparamagnetism. It turns out that the presence of iron-containing inclusions with different size affects not only the magnetic behavior of the studied samples but also the dielectric properties, having, in particular, an influence on mineral ε ″ values. There is no correlation between the dielectric properties and LOI values.
| 1 |
|
| 2 |
|
| 3 |
|
| 4 |
|
| 5 |
|
| 6 |
|
| 7 |
|
| 8 |
|
| 9 |
|
| 10 |
|
| 11 |
|
| 12 |
|
| 13 |
|
| 14 |
|
| 15 |
|
| 16 |
|
| 17 |
|
| 18 |
|
| 19 |
|
| 20 |
|
| 21 |
|
| 22 |
|
| 23 |
|
| 24 |
|
| 25 |
|
| 26 |
|
| 27 |
|
| 28 |
|
| 29 |
|
| 30 |
|
| 31 |
|
| 32 |
|
| 33 |
|
| 34 |
|
| 35 |
|
| 36 |
|