|
|
Cross-correlation matrix analysis of Chinese and American bank stocks in subprime crisis*
|
Zhu Shi-Zhao a), Li Xin-Li a), Nie Sen b)† , Zhang Wen-Qing a), Yu Gao-Feng c), Han Xiao-Pu d), Wang Bing-Hong a),b)‡ |
|
| |
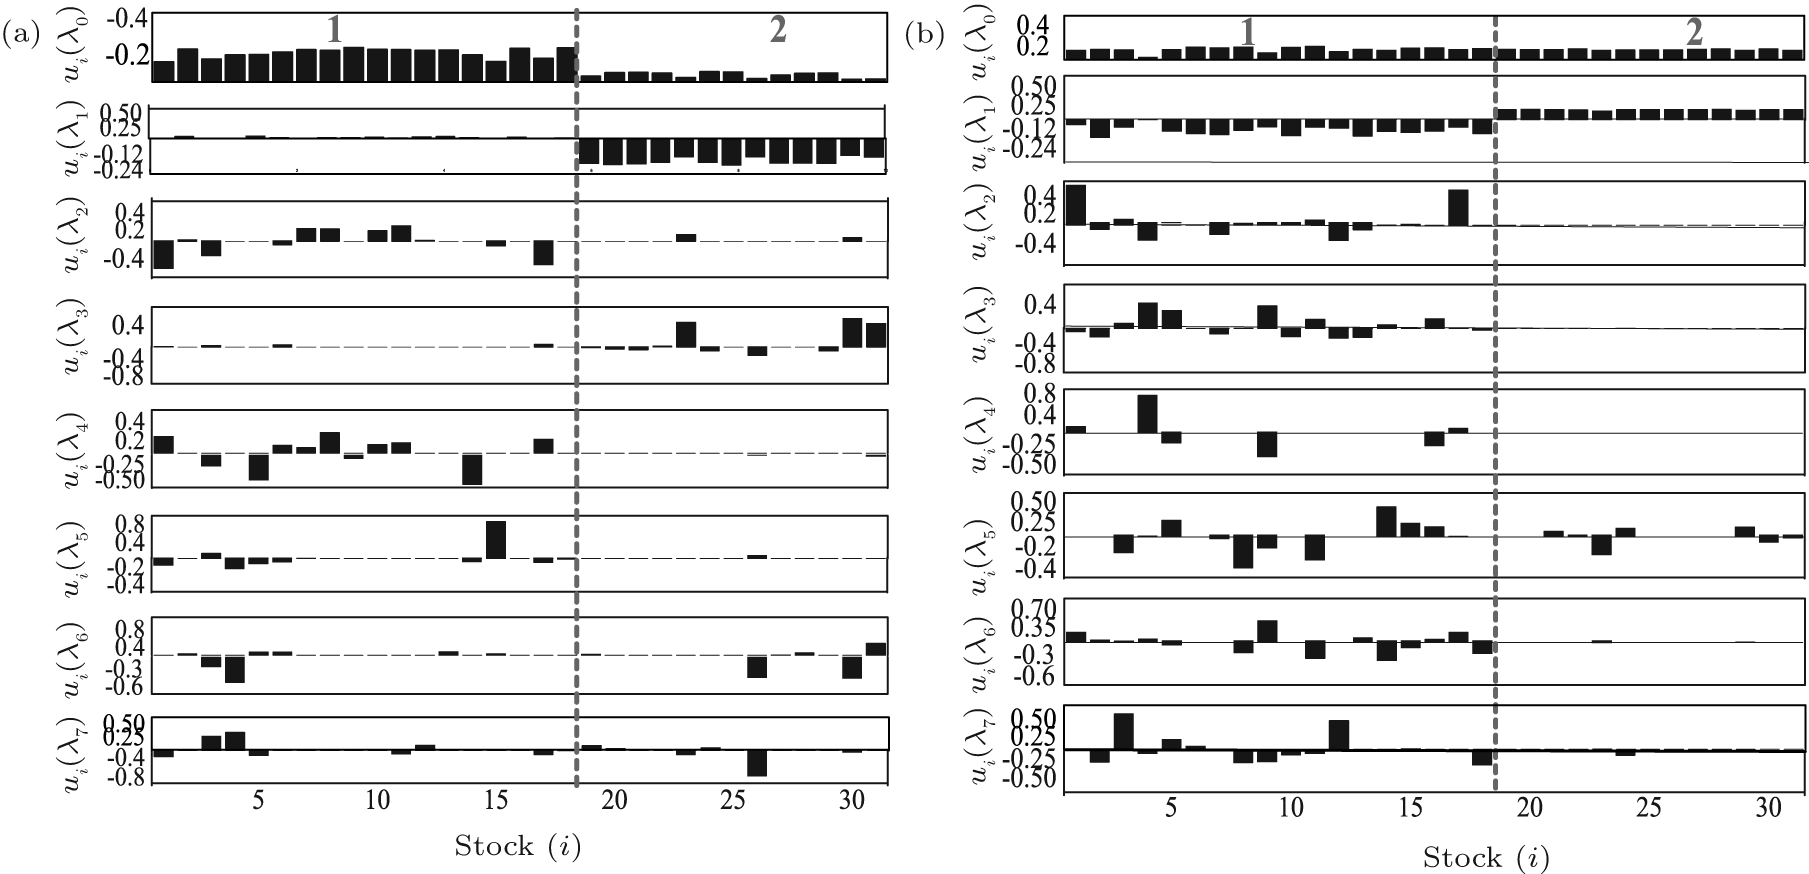
| The positive and negative components u i ( λ ) matrix C 31×31 for the eigenvectors out of threshold ∣ u i ∣≥ 0.08 corresponding to the eight largest eigenvalues of the cross-correlation matrix, where i is the stock number. Stocks have been used in accordance with their respective countries to re-sort and divide by dotted lines. (a) 2008–2010 American and Chinese bank stocks before the subprime crisis, (b) 2011–2013 American and Chinese bank stocks after the subprime crisis: number 1 means American bank stocks, and number 2 means Chinese bank stocks. |
|
|
 |
|
|