|
|
Cross-correlation matrix analysis of Chinese and American bank stocks in subprime crisis*
|
Zhu Shi-Zhao a), Li Xin-Li a), Nie Sen b)† , Zhang Wen-Qing a), Yu Gao-Feng c), Han Xiao-Pu d), Wang Bing-Hong a),b)‡ |
|
| |
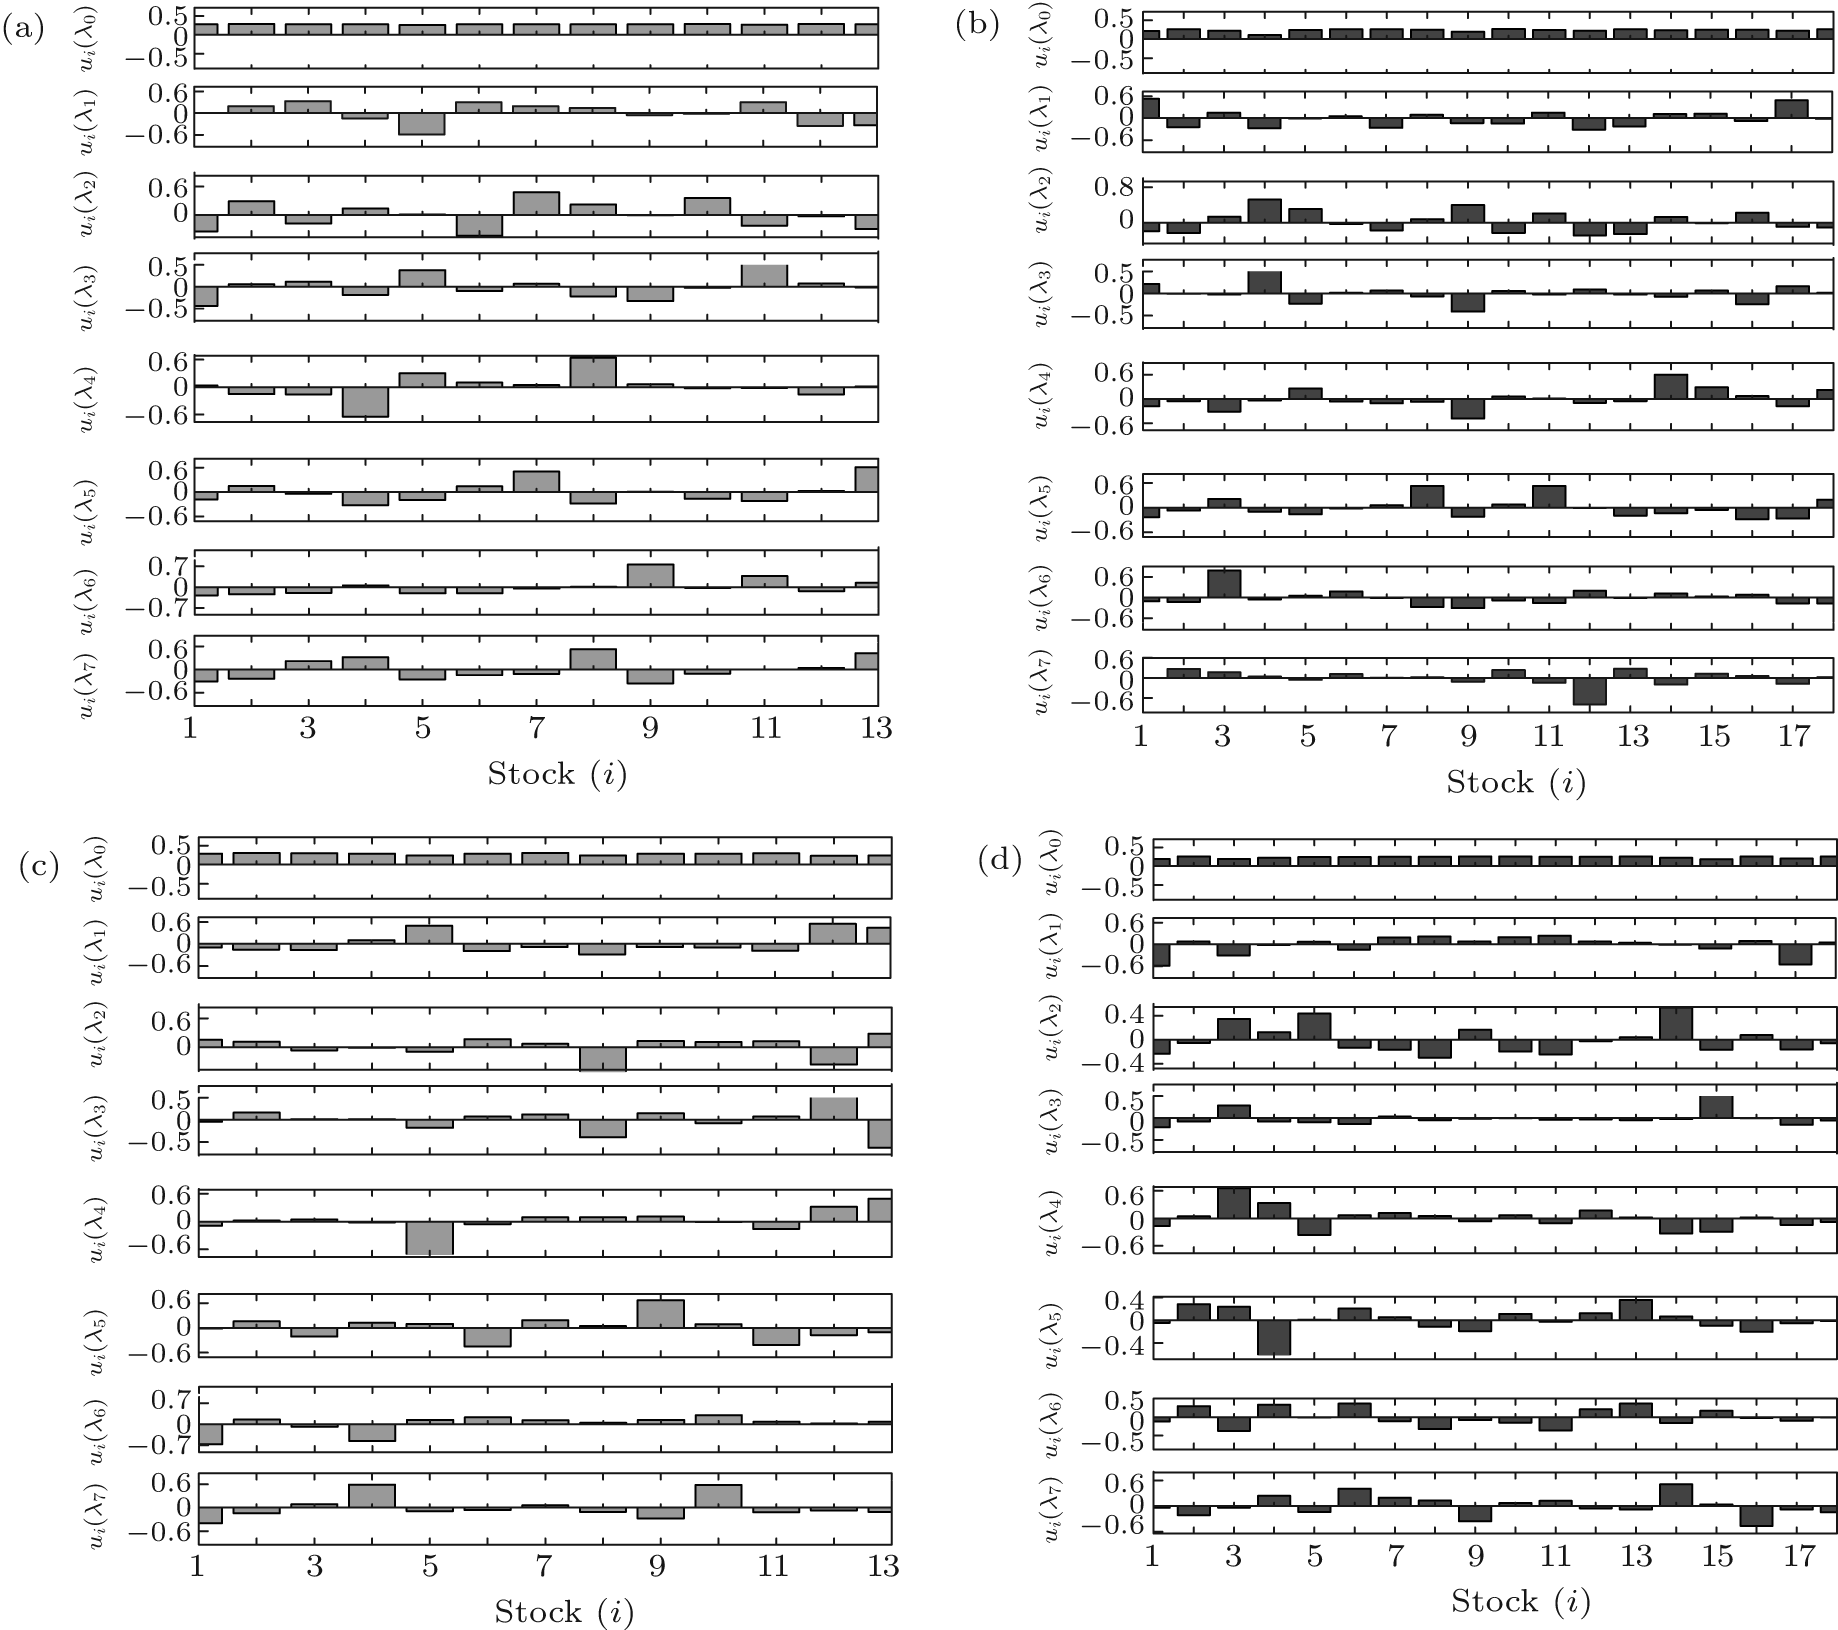
| The positive and negative components u i ( λ ) matrix C 13×13 and C 18×18 for the eigenvectors out of threshold ∣ u i ∣≥0.08 corresponding to the eight largest eigenvalues of the cross-correlation matrix, where i is the stock number. (a) 2008–2010 Chinese bank stocks before the subprime crisis, (b) 2008–2010 American bank stocks before the subprime crisis, (c) 2011–2013 Chinese bank stocks after the subprime crisis, (d) 2011–2013 American bank stocks after the subprime crisis. |
|
|
 |
|
|