
Effect of persistent high intraocular pressure on microstructure and hydraulic permeability of trabecular meshwork*
[Mei Xia), b) , Ren Lina), b) , Xu Qianga), b) , Zheng Weic)†  , Liu Zhi-Cheng
a), b)‡ ]
, Liu Zhi-Cheng]


†Corresponding author. E-mail: zhengwei@siat.ac.cn
‡Corresponding author. E-mail: zcliu@ccmu.edu.cn
*Project supported by the National Natural Science Foundation of China (Grant Nos. 31070840, 10802053, and 81201123), the Natural Science Foundation of Beijing, China (Grant No. 3122010), the Natural Science Foundation of Guangdong Province, China (Grant No. S2012040006576), the Shenzhen Science and Technology Innovation Committee, China (Grant No. KQCX20120816155352228), and the Funding Project for Academic Human Resources Development in Institutions of Higher Learning under the Jurisdiction of Beijing Municipality, China (Grant No. PHR201110506).
As the aqueous humor leaves the eye, it first passes through the trabecular meshwork (TM). Increased flow resistance in this region causes elevation of intraocular pressure (IOP), which leads to the occurrence of glaucoma. To quantitatively evaluate the effect of high IOP on the configuration and hydraulic permeability of the TM, second harmonic generation (SHG) microscopy was used to image the microstructures of the TM and adjacent tissues in control (normal) and high IOP conditions. Enucleated rabbit eyes were perfused at a pressure of 60 mmHg to achieve the high IOP. Through the anterior chamber of the eye, in situ images were obtained from different depths beneath the surface of the TM. Porosity and specific surface area of the TM in control and high IOP conditions were then calculated to estimate the effect of the high pressure on the permeability of tissue in different depths. We further photographed the histological sections of the TM and compared the in situ images. The following results were obtained in the control condition, where the region of depth was less than 55 μm with crossed branching beams and large pores in the superficial TM. The deeper meshwork is a silk-like tissue with abundant fluorescence separating the small size of pores. The total thickness of pathway tissues composed of TM and juxtacanalicular (JCT) is more than 100 μm. After putting a high pressure on the inner wall of the eye, the TM region progressively collapses and decreases to be less than 40 μm. Fibers of the TM became dense, and the porosity at 34 μm in the high IOP condition is comparable to that at 105 μm in the control condition. As a consequent result, the permeability of the superficial TM decreases rapidly from 120 μm2 to 49.6 μm2 and that of deeper TM decreases from 1.66 μm2 to 0.57 μm2. Heterogeneity reflected by descent in permeability reduces from 12.4 μm of the control condition to 3.74 μm of the high IOP condition. The persistently high IOP makes the TM region collapse from its normal state, in which the collagen fibers of the TM are arranged in regular to maintain the physiological permeability of the outflow pathway. In the scope of pathologically high IOP, the microstructure of the TM is sensitive to pressure and hydraulic permeability can be significantly affected by IOP.
Aqueous humor is secreted by ciliary epithelial cells, and then flows into the anterior chamber through the pupil, and finally out of the eye at the angle of the anterior chamber. Increased resistance to aqueous humor outflow leading to a decreased outflow facility is presumed to be a primary risk factor for most forms of glaucoma — a progressive nerve damage disease of a visual field defect. As the aqueous humor leaves the eye, it first passes through the trabecular meshwork (TM), which can be represented as a biological compressible porous material with a certain elastic modulus.[1– 3] The fluid flow through the TM and out of the eye is driven by a pressure gradient across the tissue. Thus, the pressure difference inside (intraocular pressure, IOP) and outside (episcleral venous pressure, EVP) the eye moves the aqueous humor through the TM. The TM functions like a filter positioned in front of the juxtacanalicular (JCT), which acts like a resistor. In normal IOP conditions, the major resistance to the aqueous humor outflow is contributed by the JCT, while the TM acts as a filter of cells and pigment in the aqueous humor.[4, 5]
During acute IOP elevation, structural configurations of the TM change coinciding with a reduction in the available area for the aqueous humor outflow.[6] Pressure sensitive tissues in route of aqueous humor drainage, including the more superficial (innermost region in eye) meshwork, the deeper meshwork, and the JCT connective tissue adjacent to Schlemm’ s canal, can be directly affected by IOP.[4, 7] The previous tracer studies suggest that the available area for aqueous humor filtration may vary with different perfusion pressures.[8] Meanwhile, after complete trabeculotomy, only 50% of outflow resistance was eliminated at normal IOP in enucleated human eyes (7 mmHg), and 75% of outflow resistance was eliminated at higher IOP (25 mmHg), [9, 10] suggesting that the change in outflow resistance with increasing IOP is likely associated with the pressure dependent changes in the TM and that additional sources of resistance distal to the inner wall of Schlemm’ s canal likely exist and may contribute to the increased outflow resistance with increasing IOP.
Structural abnormalities in the aqueous outflow pathway, especially in the TM and the JCT, may exacerbate elevated IOP and the development of glaucoma. It is necessary to investigate the microstructure of the TM outflow pathway as an organ system enduring high IOP. Although currently available clinical imaging technologies such as optical coherence tomography (OCT)[11, 12] and ultrasound biomicroscopy (UBM) can image Schlemm’ s canal, [13] they are unable to achieve high enough resolution to be of clinical value in most forms of glaucoma such as primary angle closure glaucoma. Confocal scanning laser ophthalmoscope (CSLO) is another important ophthalmic technique which can provide high resolution images of retina.[14] However, its performance requires an exogenous fluorescence contrast agent to enhance imaging.
In the present study, we use a second harmonic generation (SHG) microscope to image the TM region. As collagen is the major component of the TM and collagen can emit strong SHG signals, [15] a SHG microscope can help us to image the region of the TM in different depths beneath the surface by optical sectioning without conventional histologic embedding and sectioning[16, 17] and an exogenous fluorescence contrast agent. Using this non-invasive technique, we investigate the effect of acute elevated IOP on the detailed morphological changes of the porous structure and the permeability of the TM.
Enucleated rabbit eyes were obtained from purebred New Zealand white rabbits of either gender, aged 12– 14 weeks, and weighing 2.5– 3.0 kg, provided by the Experimental Animal Center of Capital Medical University. Implement excessive anesthesia death on rabbits by rapid injection of urethane into the ear vein. Then bluntly dissect the bulbar conjunctiva, cut the rectus, and finally cut together the central retinal artery, vein, and the optic nerve bundle after ligation to isolate the eyeball. We divided 28 vitro eyeballs from 14 rabbits into two groups, one was used for in situ SHG imaging in the high IOP condition (described in the next section); and the other was used as the control group of normal IOP. Globes were temporarily saved in 5 mL 4% paraformaldehyde at room temperature, then anterior segments consisting of cornea, anterior sclera, and TM with iris were prepared by cutting along the equator of the globe and placed in a culture dish. The tissue was cut into 2 or 3 segments with 1 cm width and placed with the TM side up in 5 mL of phosphate-buffered saline (PBS: 8 g/L sodium chloride, 0.2 g/L potassium phosphate monobasic, 2.16 g/L sodium phosphate dibasic heptahydrate, pH 7.4) to prevent drying. All eyes used in our study had no reported history of previous ocular diseases or surgeries. All the animal experiments reported in our study were carried out in accordance with the National Institute of Health Guide for the Care and Use of Laboratory Animals and approved by the Institutional Animal Care and Use Committee of China.
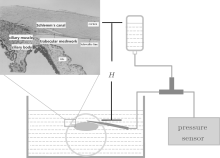
As shown in Fig. 1, an intravenous catheter was needled at the corneoscleral limbus peripheral 1 mm obliquely upward in the direction of 10° , and was slid above the iris in the direction of the pupil center until its tip reached the central anterior chamber. Then pull out the metal needle and fix well the trocar, ensuring that the inflow point is in the anterior chamber. In this study, a pressure of 60 mmHg was put on the inner wall of the globe including the region of TM overnight (approximately 16 h). The IOP can be measured by a pressure sensor connected to a three-way tube, and be regulated by the height of the liquid level (H) in the medicine flask.
 | Fig. 1. Schematic diagram of the eye perfusion system, where H represents the height difference between the liquid level in the medicine flask and the syringe needle inserted into the eye. The insert map of the histologic section is adopted from Ye et al.[18] (copy with permission); the innermost region (red solid line in insert map) corresponding to superficial TM represents depth = 0 μ m in our imaging work. |
Eyes of control condition and high IOP condition were held in 30% sucrose/PBS solution at 4 ° C for a week and subsequently embedded in an optimal cutting temperature compound and sectioned at a thickness of 100 μ m for SHG imaging. The sections of the cornea/sclera region were imaged in the sagittal plane.
A home-made SHG microscope system in Shenzhen Institutes of Advanced Technology[19] was used. Briefly, a femtosecond Ti:sapphire laser (Chameleon Ultra, Coherent Inc.) tuning at 800 nm worked as the excitation source. A 500 μ m × 500 μ m sampling area was created by scanning a pair of galvo mirrors. A water-immersion 1.00 NA objective lens (XLUMPLFLN 20X, Olympus) was used to focus the excitation beam into the sample and collect the backscattered SHG signal. A dichroic mirror of 685 nm (FF685-Di02, Semrock Inc.) was placed above the objective to reflect the SHG signal to a PMT detector (H7421-40, Hamamatsu.) Before the PMT, a 680 nm short-pass filter (FF01-680/SP-25, Semrock Inc.) was placed to remove the residual excitation laser light and a narrow bandpass filter centered at 402 nm (ET402/15x, Chroma) was used to provide a pure SHG signal. An actuator was used to control the imaging depth. The interval depth was set to 5 μ m and 1 μ m for the control and the IOP conditions, respectively. The system produced lateral and axial resolutions of about 0.3 μ m and 1.5 μ m, respectively. The first image detected by the SHG system was identified as the surface of the TM and set as 0 μ m depth.
The flow rate of the aqueous humor can be calculated by

where Δ P is the total pressure drop across the domain, and R is the overall resistance to the aqueous humor outflow which is related to the effective permeability. As a porous material, the resistance of the porous structure of the TM is determined by its hydraulic permeability. Then the permeability K must be estimated. This is accomplished by using the Carmen– Kozeny equation

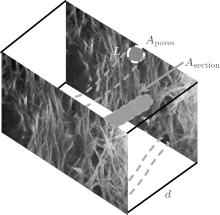
where ε is the porosity (the ratio of void volume to total volume), α is the specific surface area (the ratio of wetted pore surface area to total volume), and κ is the Kozeny constant (in this study, we use a value of 5 for the Kozeny constant[20]). The Carman– Kozeny equation thus provides a well established indirect method for estimating the permeability of a material via measurement of porosity ε and specific surface α . Our goal is to determine ε and α from the micrographs and then use Eq. (2) to compute K. We assume that, for all practical purposes, the trabecular meshwork cells are impermeable. Therefore, our attention is focused on the microstructural composition of the extracellular space as seen in SHG images in Fig. 2.
Consider a volume Vtotal of a medium that is comprised of pores in a three-dimensional space. Let Vtotal = Atotald and Vpores = Apores, averd. When d is small enough, Aores, aver = (Apores, n + Apores, n+ 1)/2, where d is the step size of the optical section (d = 5 μ m in the control condition; d = 1 μ m in the high IOP condition), Apores, aver is the average porous area of the two adjacent micrographs (Apores, n, Apores, n+ 1), Atotal is the total area of the micrograph. According to definition, ε = Vpores/Vtotal = Apores/Atotal, and α = Asection/Vtotal = L/Atotal, where Apores is the area of total pores in one micrograph, Asection is the wetted surface area of the route, and L is the edge of the fibers.
 | Fig. 2. Sketch map of the specific surface area; Apores is the area of total pores in one micrograph, Asection is the wetted surface area of the route, L is the boundary between tissues and pores, and d is the acquisition step length. |
The MATLAB software was used to adjust the overall brightness and contrast of the images. Then the area of total pores in each micrograph Apores and edge of fibers L were determined by the method proposed by Overby et al.[20]
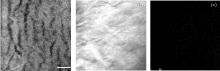
For cornea, SHG imaging was performed in the enucleated rabbit eye with the cornea toward the objective lens. Figure 3(a) shows an SHG image generated from a single scanned plane of 130 μ m below the anterior surface of the cornea. The thickness of the cornea was measured by scanning from the outermost layer of the cornea to the corneal endothelium (nearly 450 μ m of central corneal thickness). As the major refractive medium, the cornea is mainly made up of type I collagen fibers arranged regularly to maintain transparency. Tissue shrinkage appeared due to alcohols.
An SHG micrograph was obtained from sclera at a depth of 30 μ m below the external surface of sclera adjacent to the corneoscleral limbus, as shown in Fig. 3(b). The sclera contains a large amount of collagen fibrils which belong to noncentrosymmetric macromolecular structures. Compared to the cornea, the sclera appears to have denser fibers, in accordance with its function of being a protective black box of the eye.
We can see the dark region lacking a signal in Fig. 3(c) corresponding to the lens. There is no signal from the rabbit lens because the main component of the lens is water. The image was captured from 135 μ m below the anterior surface of the lens.
 | Fig. 3. SHG images of (a) cornea, (b) sclera, and (c) lens (scale bar = 25 μ m). |
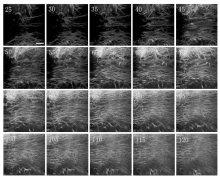
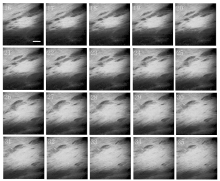
Figure 4 shows SHG optical sections from the superficial to the deeper region of TM in the control condition. The varying structural configurations provide landmarks for the tissue location from a different depth of TM. Comparing with Fig. 3(b), the component of TM is similar to that of sclera. From Fig. 4, we can see that the superficial TM is a filter made up of collagen-based connective tissue organized into a network of beams which can filter pigment and macromolecules in the aqueous humor. Between these beams, there are gaps shown as dark zones, which permit the outflow of the aqueous humor. The deeper meshwork is linking to a silk-like region with wide fluorescent bands separating small pores lacking an SHG signal. These pores vary in size from less than 10 μ m to greater than 30 μ m. Series of TM images show the transition of the channel-like configuration of a superficial meshwork to a silk-like pattern adjacent to the JCT along the tissue axis.
Although most of the resistance to the aqueous humor outflow is suggested to occur at the JCT region, [21, 22] it is also commonly believed that in the high IOP condition, the TM and the JCT tissues contribute to the resistance to aqueous humor drainage via maintenance of the normal microstructure of the TM. As the aqueous humor moves from the superficial TM to the JCT, the spaces between the beams decrease. Compared with that of the control condition in Fig. 4, the TM of the high IOP condition in Fig. 5 exhibits a compressed morphology, and its total thickness decreases. These pressure-induced changes of the TM are large enough to account for the high aqueous flow resistance, and subsequently lead to the increment of IOP as a feedback mechanism.
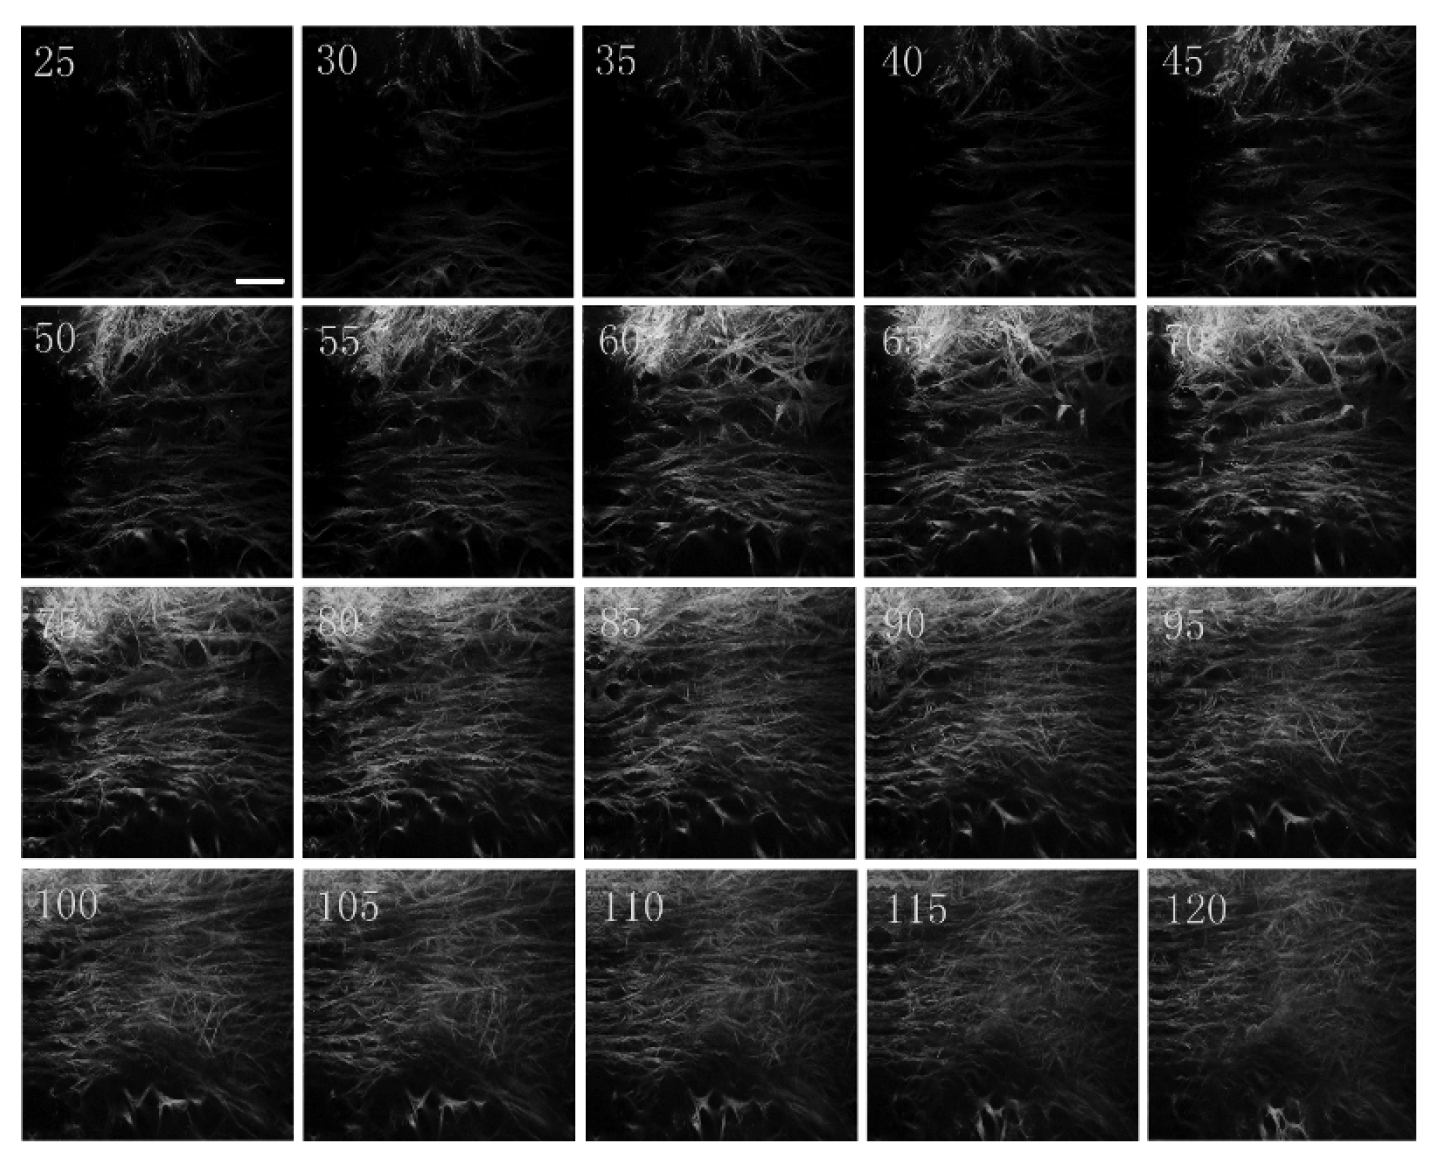 | Fig. 4. SHG optical sections of TM from different depths in the control condition; from 25 μ m beneath the superficial TM surface to 120 μ m with 5 μ m increment (scale bar = 100 μ m). The dark zones are the gaps between the fibers. |
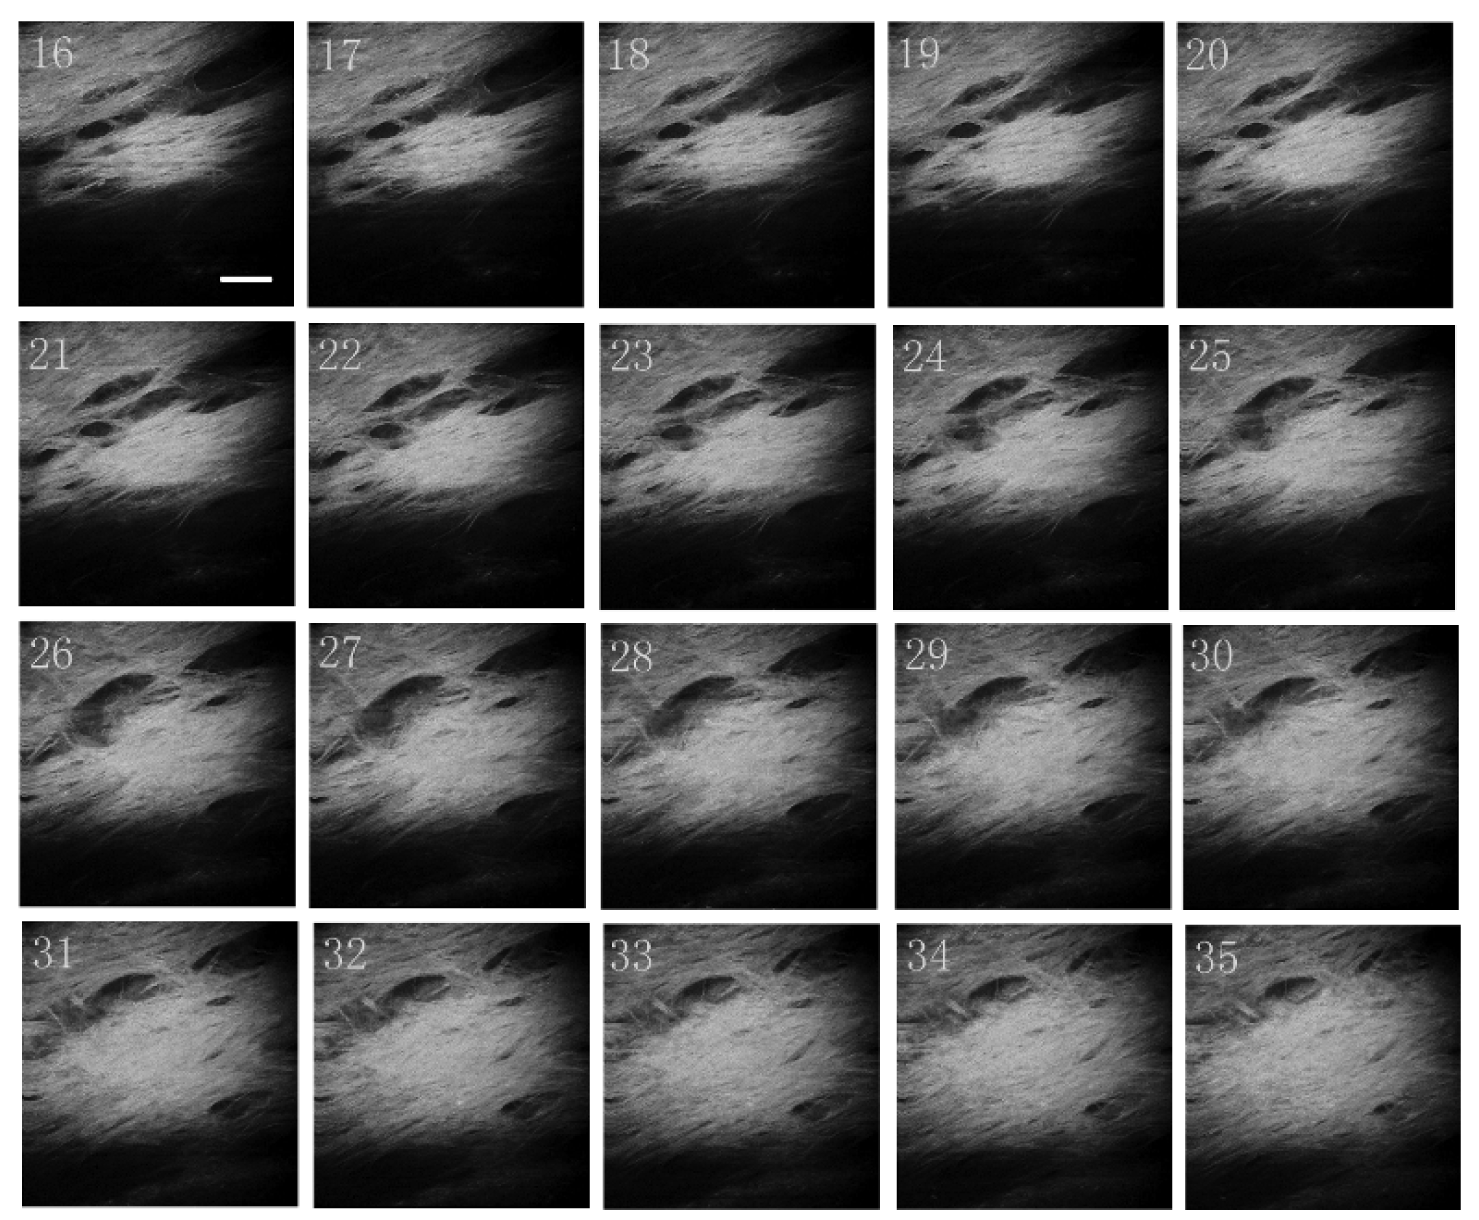 | Fig. 5. SHG optical sections of different depths of TM in the high IOP condition: from 16 μ m beneath the innermost TM surface to 35 μ m with 1 μ m increment (scale bar = 100 μ m). Dark zones are the gaps between the fibers. |
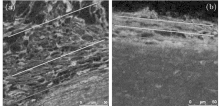
Figure 6 shows the fluorescence image of the histologic section of TM in the sagittal plane. As shown in Fig. 6(a), in the control condition, the microstructure of TM exhibits a heterogeneous character in the cross-section. In the superficial TM region exposed to the anterior chamber (near the blue line), the diameters of pores embedded in the tissue are large; the large gaps between the fibers are the outflow pathway of aqueous humor. In the deeper level of TM (near the yellow line), the tissues appear to be compact. In the high IOP condition, the hierarchical structures of TM disappear, and the porous region is depressed into a lamina of which the thickness is less than 50 m. The meshwork is found to have fluid spaces of non-uniform size, which is in confirmation of the organizational structures shown by the quick-freeze deep etching electron microscopy of Gong et al.[23]
 | Fig. 6. Histologic section of trabecular meshwork in the sagittal plane in (a) the control condition and (b) the high IOP condition. Headpiece and bottom of the figure represent the locations of the anterior chamber and sclera, respectively; blue, yellow, and red lines represent the regions of the more superficial meshwork, the deeper meshwork, and the JCT connective tissue, respectively. |
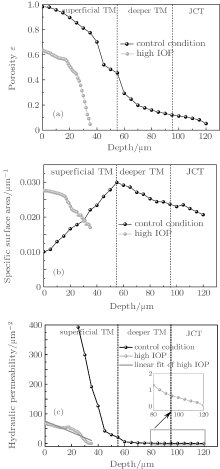
Depths of images in the control condition are classified into three parts, including the superficial TM region, the deeper TM region, and the JCT region. Due to the extreme denseness of tissue in the high IOP condition, it is difficult to unambiguously determine the boundary between tissues and pores. So in the high IOP condition, all the data are collected below 35 μ m. As can be seen from Fig. 7(a), the porosity both in the control and the high IOP conditions monotonously decreases with increasing depth. In the control condition, the graphic slope of porosity in the superficial TM region is larger than that in the deeper TM. In the high IOP condition, there is a dramatic drop of porosity. The porosity at 34 μ m in the high IOP condition is comparable to that at 105 μ m in the control condition, which indicates that the TM at the superficial depth in the high IOP condition behaves like that at the deeper depth in the control condition. In Fig. 7(b), as the depth increases, the specific surface area of the control condition firstly rises to 0.03 μ m− 1 and then goes down. There is a broadening peak around a depth of 55 μ m, suggesting that there could be an optimal location of absorptive capacity in normal TM. The curve of the specific surface area in the high IOP condition resembles the one in the control condition at the deeper TM region. Figure 7(c) shows the permeability of TM in both conditions. Hydraulic permeability which affects the outflow facility of the TM is a function of the porosity and the specific surface area. In the control condition, due to the large gap between fibers in the superficial TM region, the resistance to the aqueous humor outflow in this region can be ignored. The JCT contributes mostly to the outflow resistance. The permeability in depths of 40 μ m and 75 μ m is 120 μ m2 and 1.66 μ m2, respectively. In the high IOP condition, the pressure-induced morphological change of the TM causes decrement of permeability in the TM region, suggesting that the microstructure of the TM plays an important role in the outflow facility of the drain system in the eye. Both TM and JCT have equal contributions to the outflow resistance in the high IOP condition. The permeability in depths of 20 μ m and 34 μ m is 49.6 μ m2 and 0.57 μ m2, respectively.
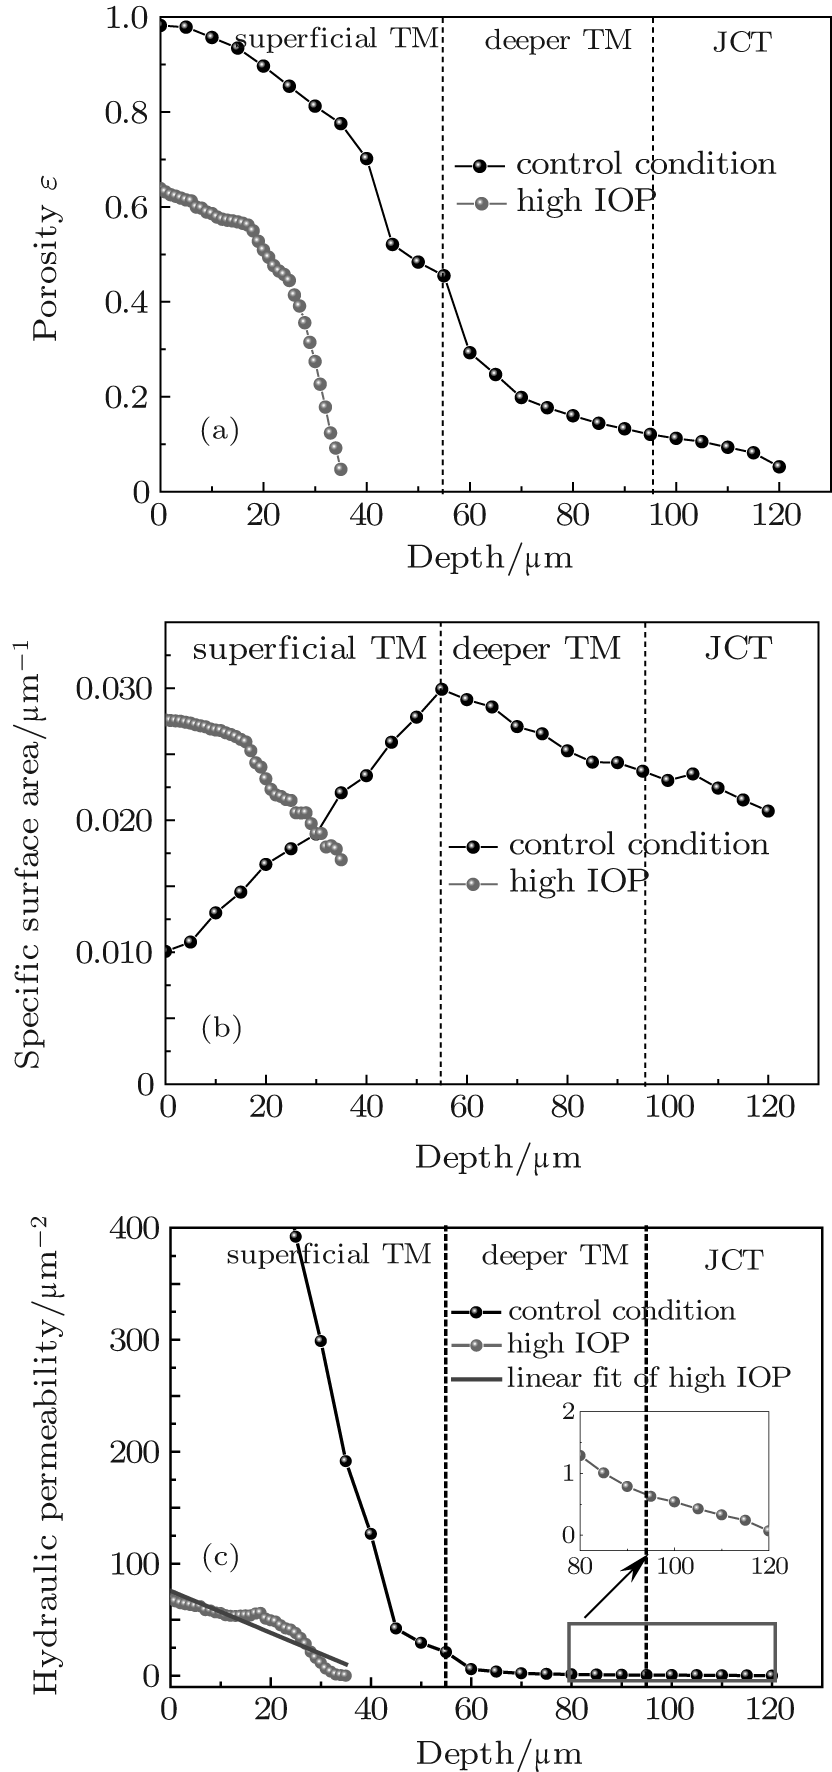 | Fig. 7. (a) Porosity, (b) specific surface area, and (c) permeability of TM in the control condition (solid line) and the high IOP condition (red dashed line). The insert in panel (c) is a partial enlarged view of the curve in the deeper TM region and JCT region. The solid blue line is the linear fit of permeability under the high IOP condition. |
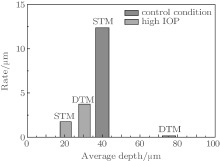
To quantify the effect of the TM heterogeneity on the hydraulic permeability of the TM region, it is desirable to estimate the local permeability on the finest scale possible. The rate of descent of permeability (Rdp), which reflects the heterogeneity of the TM tissue, is defined as the descent of permeability per unit depth. As can be seen from Fig. 7(c), in the control condition, the permeability has an approximate linear relationship with the depth in both the superficial TM (STM) and the deeper TM (DTM) regions. This allows us to calculate Rdp by choosing two arbitrary points on the curve within the corresponding region. Average depths of images were set to be 40 μ m and 75.5 μ m, corresponding to the STM region and the DTM region respectively in the control condition. As can be seen in Fig. 8, in the STM region of the control condition, at an average depth of 40 μ m, Rdp is 12.40 μ m, which is significantly greater than that (0.15 μ m) at average depths of 75.5 μ m. In the high IOP condition, strictly speaking, the tissue is compressed and tends to form a tight structure. It is hard to distinguish STM and DTM unambiguously. In order to gain the first insight into the heterogeneity of STM and DTM under the high IOP condition, we roughly select the region with depths from 15 μ m to 25 μ m to calculate Rdp of STM, while the one ranging from 25 μ m to 35 μ m to determine Rdp of DTM. The Rdp’ s reach to 1.75 μ m and 3.74 μ m for STM and DTM regions, respectively.
 | Fig. 8. Rate of descent in permeability versus average depth in control and high IOP conditions. |
The TM as a porous collagen medium with a similar component of sclera; its hydraulic conductivity could be influenced by its morphological parameters such as porosity and specific surface area. In order to determine these parameters, micrographs of the TM region must be obtained. In this study, a newly developed technique, the second harmonic generation microscopy, was used to investigate the effect of pressured induced morphological changes of TM on the hydraulic permeability of the aqueous outflow. Some advantages of SHG microscopy make it uniquely suitable for this study. First, the SHG signal is generated from the interaction of the collagen with the laser beams and the collagen is the major constituent of the TM, so the SHG microscopy provides a non-invasive high resolution imaging means to detect the TM using its intrinsic optical signal. Second, the SHG microscopy has an optical sectioning capability without destroying the tissue. In situ images are easily obtained and could be used to reconstruct the tissue in different dimensions. Third, the SHG microscope provides approximately a two-fold deeper penetration in optical scattering tissue compared with the confocal microscopy.[24]
With this technique, the microstructure of the ocular anterior segment including sclera, cornea, and lens were imaged firstly. Subsequently, the morphologies of the TM in control IOP and acute elevated IOP were examined. Imaging revealed an intricate network of interconnected trabecular fibers whose arrangement varied continuously from the superficial to deeper TM. The TM configuration exhibited a beams-structure corresponding to the previous studies detected by 3D-micro CT.[25] In the control condition, the superficial TM region showed large intertrabecular spaces between the TM beams. Most of the fluid left the eye by these conventional outflow pathways in which the TM tissue acted like a filter, removing cell debris, pigment, and reactive oxygen species from the aqueous humor before it reaches the resistant part of the pathway located near the JCT.[26] In the high IOP condition, the thickness of the TM region in our cultured animal decreased rapidly.
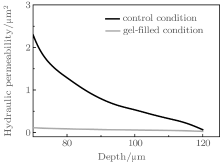
Meanwhile, our study investigated morphologic and hydraulic changes in the aqueous humor outflow pathway after acute elevated of IOP in rabbit eyes for the first time. The morphologic changes in the aqueous outflow pathway can be correlated with changes in porosity and hydrodynamic permeability of the aqueous outflow pathway after acute elevations of IOP. Based on the porous media theory, the permeability of the suppressed TM decreases significantly as the depth increases. The normal microstructure of the TM is a precondition of the physiological outflow facility. Some studies suggested that the open spaces within the TM are filled with a gel-like biopolymer consisting of proteins and long-chain carbohydrates. Using Weinbaum’ s model, [27] we compared the permeability of the control condition and that of the gel-filled model in Fig. 9. Not only the microstructure of the TM, but also the content within the TM constructure contributes some resistance to the fluid outflow.
Heterogeneity is one of the essential physiological characters which maintain the normal tissue function. In the control condition, the ratio of Rdp for STM and DTM is 82.67, which indicates that there are huge structural differences between STM and DTM regions. This ratio of Rdp between STM and DTM in the high IOP condition is significantly reduced to 0.47 in comparison with 82.67 of the control condition. And we found that the datum of Rdp under the high IOP condition can be reasonably fitted by the linear least square method, with Pearson’ s r equal to − 0.92 (Fig. 7(c)). This further suggests that the large gap of the tissue configuration between STM and DTM is nearly closed under the high IOP condition, and a uniform tissue structure tends to be established.
 | Fig. 9. Permeability of TM with and without being gel filled. |
According to the study of Battista et al., [6] a decrease in the outflow facility is associated with a reduction in the effective filtration area of the aqueous outflow, which may be regulated by structural changes in the aqueous outflow pathway. To understand how hydrodynamics and morphologic changes in the aqueous humor outflow pathway contribute to the decreased aqueous humor outflow facility after acutely elevated IOP in rabbit eyes is the first step to clarify the regulation of the outflow facility. Understanding the distribution of the TM could be beneficial to ophthalmic surgeons in placing devices aiding filtration, or optimally identifying preferred trabeculotomy or trabeculectomy sites.
In the future, we will image the TM transsclerally to provide a mechanism to study the anatomical and pathological state of the whole conventional outflow pathway in this non-invasive way in vivo, and investigate the effect of the ocular hypertension on the response for the TM. Moreover, SHG imaging of the TM may provide the ability to reconstruct 3D images and study the volumetric data of the TM. Using computational simulation, 3D construct can be achieved for performing stress and strain analysis.
By using second harmonic generation microscopic imaging, optical sections of the native TM region in an animal eye were obtained to investigate the effect of pressure-induced morphological changes on tissue hydraulic permeability. We found that anterior segment tissues exhibited variable structures in accordance with the function. The collagen fibers of the trabecular meshwork in the control condition were arranged regularly to maintain the permeability of the outflow pathway. In the high IOP condition, the TM region collapsed, and the porosity of the TM decreased. Due to its pressure sensitivity, the hydraulic permeability of the TM can be significantly affected by IOP.
We thank Dr. Lu Qing-Jun in Tongren Hospital of Beijing for valuable discussion.
| 1 |
|
| 2 |
|
| 3 |
|
| 4 |
|
| 5 |
|
| 6 |
|
| 7 |
|
| 8 |
|
| 9 |
|
| 10 |
|
| 11 |
|
| 12 |
|
| 13 |
|
| 14 |
|
| 15 |
|
| 16 |
|
| 17 |
|
| 18 |
|
| 19 |
|
| 20 |
|
| 21 |
|
| 22 |
|
| 23 |
|
| 24 |
|
| 25 |
|
| 26 |
|
| 27 |
|