
Generation of isolated attosecond pulses in bowtie-shaped nanostructure with three-color spatially inhomogeneous fields*
[Xue Shan, Du Hong-Chuan† , Xia Yue, Hu Bi-Tao‡]
, Xia Yue, Hu Bi-Tao‡]
|
|


†Corresponding author. E-mail: duhch@lzu.edu.cn
‡Corresponding author. E-mail: hubt@lzu.edu.cn
*Project supported by the National Natural Science Foundation of China (Grants Nos. 11404153, 11175076, 11135002, and 11405077) and the Fundamental Research Funds for the Central Universities of China (Grant Nos. lzujbky-2014-10, lzujbky-2014-13, and lzujbky-2014-14).
We theoretically investigate high-order harmonic generation in a two-color multi-cycle inhomogeneous field combined with a 27th harmonic pulse. By considering a bowtie-shaped gold nanostructure, the spatiotemporal profiles of enhanced plasmonic fields are obtained by solving the Maxwell equation using finite-domain time-difference method. Based on quantum-mechanical and classical models, the effect of 27th harmonic pulse, temporal profile of enhanced plasmonic field and inhomogeneity on supercontinuum generation are analyzed and discussed. As a result, broadband supercontinuum can be generated from our approach with optimized gap size of nanostructure. Moreover, these results are not sensitively dependent on the relative phase in the two-color field.
When atoms, molecules, and nanostructures are subjected to intense laser radiation, new phenomena appear as a consequence of this interaction.[1, 2] Among them, high-order harmonic generation (HHG), which has been comprehensively investigated, is a topic of great interest[3, 4] due to its potential to generate coherent light in the ultraviolet (UV) to extreme ultraviolet (XUV) spectral range.[5– 7] As a result, it represents a considerable tool to capture structure and dynamics with the spatiotemporal resolution on both the attosecond and angstrom scale.[8]
The intuitive physical mechanism behind HHG, for a single atom or molecule, has been well established in the so-called three step or simple man’ s model:[9– 11] the electron first tunnels through the atomic potential barrier suppressed by a driving laser field and it is then accelerated in the continuum, whose process is treated classically. When the electric field reverses its sign, the electron recombines with its parent ion and emits photon with the energy equal to the sum of the electron kinetic energy and the ionization potential.
In noble gases, high-order harmonic generation requires a driving intensity in the order of 1013– 1014 W/cm2, which is two orders of magnitude larger than the output of the current femtosecond oscillators. Nowadays, chirped-pulse amplification (CPA) is employed to reach the threshold intensity. However, the CPA process based on a Ti:sapphire crystal restricts the pulse repetition rate to kilohertz level or below.[12, 13] Compared with the CPA, plasmonic field enhancement offers an alternate way to achieve pulse amplification with the repetition rate at dozens of megahertz, and requires no extra cavities or laser pumping to amplify the power of the input pulse. Since the first experimental demonstration of the plasmon-driven HHG using bow-tie nanostructures, several theoretical and experimental investigations have been performed to validate the possibility of generating isolated attosecond pulses using various metallic nanostructures, such as nano-plasmonic antennas, [14– 17] metallic waveguides, [18, 19] metal[20, 21] and dielectric nanoparticles[22] or metal nanotips.[23– 27] Furthermore, the high harmonics generated from each nanostructure acts as a point-like source, enabling collimation or focusing of this coherent radiation by means of constructive interference. Despite all of these good features, the plasmon-driven HHG still suffers from several problems, such as the damage of the metal nanostructures, finite gas volume for a coherent buildup, and the actual intensity enhancement of the input pulse.
The physical mechanism of HHG based on plasmonics can be explained as follows (a full explanation can be found in Ref. [14]): when a low intensity femtosecond laser pulse couples to the plasmon mode, it triggers a collective oscillation of free charges within the metal, which makes the pulse capable of producing a strong field enhancement, while these free charges redistribute the electric field near the metal nanostructure. The enhanced field could exceed the threshold of HHG. Thus, by injecting noble gases into the spot of the enhanced field, high-order harmonics are generated. Note that the enhanced laser field is not spatially homogeneous in the region where the electron dynamics take place. In addition, the movement of the electrons in the enhanced field would be restricted in space. These two features imply strong modification in the harmonic spectra.[15– 17, 28, 29]
In this work, we investigate the feasibility of generating isolated attosecond pulses from an optimized nanostructure consisting of bowtie-shaped gold elements in a two-color multi-cycle inhomogeneous field, combined with a 27th harmonic pulse of short time duration. By setting this pulse centered at certain time, a long quantum path can be selected, which is ionized in a half optical cycle with great higher kinetic energy than that of the adjacent quantum path. As a result, an efficient broadband supercontinuum can be generated through the plateau to the cutoff with an optimized gap size. By filtering the harmonics near the cutoff region of the supercontinuum, isolated attosecond pulse can be straightforwardly obtained. Moreover, our approach is not limited to the selection of relative phase between the fundamental and control field. The rest of this paper is organized as follows. The theoretical model is first given in Section 2. Then the nanostructure is introduced in Section 3. Next, the numerical results and discussion are presented in Section 4. Finally, we summarize the conclusion in Section 5.
We assume that the incident laser pulse is linearly polarized along the x axis in our study. Since the dynamics of an atomic electron is mainly along the polarization direction, it is a good approximation to employ the time-dependent Schrö dinger equation in one spatial dimension (1D-TDSE) which reads (atomic units are used throughout)
where Vatom represents the soft Coulomb potential

which was first introduced in Ref. [30] and has been widely used in the 1D studies of laser– matter processes in atoms. We set z = 2 and a = 0.5 to match the ground ionization potential Ip = 2 a.u. of the real He+ ion. E(x, t) is the plasmonic electric field with spatial dependence. In the case of a short-pulse excitation with linear polarization which includes a set of wavelength, we find that the spatial profiles of the enhanced pulse are almost unchanged at different times. Hence, there is no need to calculate the spatial profile of each frequency, and then reconstruct them using the spectral representation of the pump pulse and the wavelength-dependent field redistribution.[31] This reduces a lot of unnecessary computation and to some extent ensures precision of the spatial dependence. Therefore, E(x, t) can be defined as a perturbation to the dipole approximation and it reads

where E(t) is the temporal profile of the enhanced pulse in the middle of the nanostructure obtained by solving the Maxwell equation. Furthermore, h(x) represents the functional form of the inhomogeneous electric field and it can be written as

where the coefficients bi are obtained by fitting the real electric field that results from the finite-domain time-difference (FDTD) simulation considering the real geometry of the bowtie-shaped nanostructure. The spatial inhomogeneity of polynomial fitting is much more accurate than that of the traditional linear function[16, 17, 28, 32– 34] or that obtained by the finite element method (FEM).[35– 37] The incident temporal electric field is given by
where E0 and ω 0 are the amplitude and frequency of the fundamental pulse, the carrier-envelope phases ϕ 0 and ϕ x of the two pulses are set to be π , and φ denotes the relative phase between the two pulses. The “ physical” temporal Gaussian envelope is given by 
Equation (1) is solved numerically by using the split-operator method.[38] To avoid spurious reflections from the spatial boundaries, the electron wave function is multiplied by a mask function of the form cos1/8 at each time step. Once the evolution of the electron wave function Ψ (x, t) of the system is obtained, the time-dependent dipole acceleration can be calculated according to Ehrenfest theorem.[39] The HHG spectrum is then obtained by Fourier transforming of the time-dependent dipole acceleration. The ionization probability is determined through P(t) = 1 − Σ n | 〈 φ n/Ψ (t)〉 | 2.
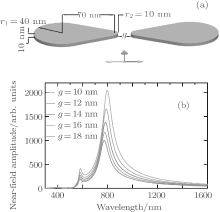
The nanostructure consists of bowtie-type gold pads separated by an air gap g. The real and imaginary parts of the wavelength-dependent dielectric function for gold in the simulation were determined using the modified Debye model.[40] The nanostructure is surrounded by air whose index of refraction is 1. Figure 1(a) depicts the geometric parameters of the nanostructure. The apices at corners are rounded with 10 nm radius of curvature to account for the limitation of current fabrication techniques and avoid nonphysical field enhancement due to the tip effect. These parameters yield a dipolar bonding resonance centered at around λ = 800 nm. This particular value of resonant wavelength was chosen according to the availability of the laser sources.
It is well known that the larger the gap is, the greater the effect of such spatial inhomogeneity will be. Meanwhile, it also makes the resonant wavelength blue shift around 10– 30 nm from the original resonance (see Fig. 1(b)). The underlying physics can be simply explained by the mechanism of electrodynamics: a large distance causes an increase of electrostatic energy because the opposite polarization charges face each other across the gap, leading to the blue shift of the surface plasmon mode. In addition, the incident pump laser propagates along the purple arrow and the polarization of it is along the red arrow.
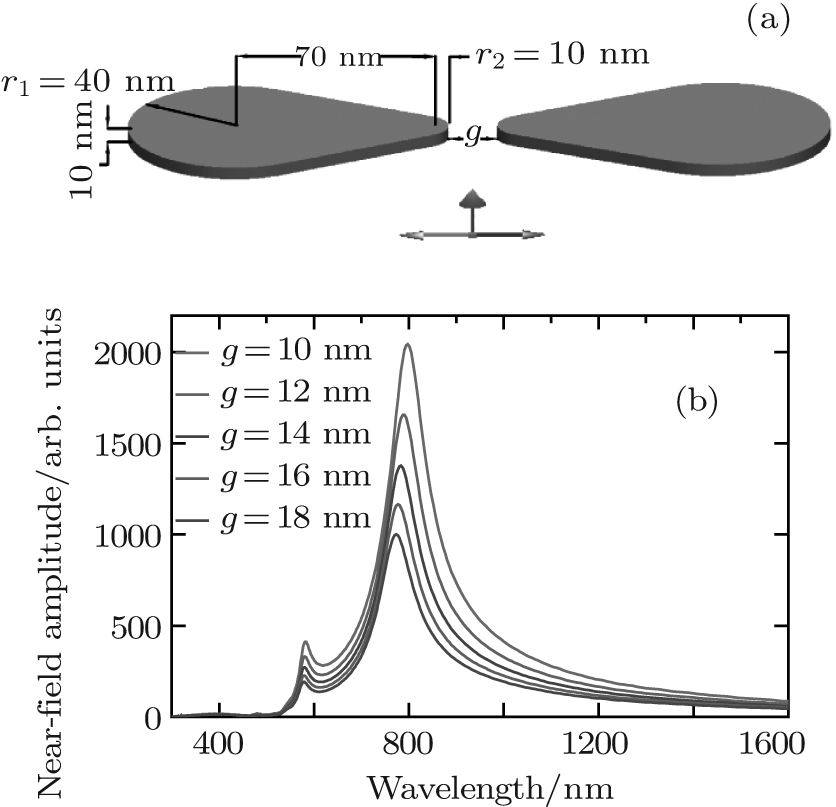 | Fig. 1. (a) Bowtie-shaped nanostructure and its geometric parameters. Incident pump pulse propagates along the direction of purple arrow; the polarization is along the direction of blue arrow. (b) Near-field amplitude spectra for different gap sizes with the amplitude of incident bandwidth pulse normalized to 1, obtained by the Fourier transforming the enhanced field. |
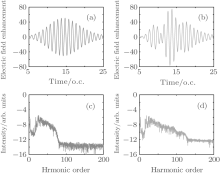
In our calculation, we have chosen multi-cycle pulses to strengthen the monochromaticity in order to get a large enhancement factor. Here we set φ as π to obtain a broadest supercontinuum. After superposition of the two pulses, energy is redistributed, and then the amplitude of the incident electric field reaches a maximum in two or three optical cycles (see Fig. 2(b)). The peak intensity of the fundamental pulse E0 is chosen to be 0.144 TW/cm2, the corresponding laser intensity is on the order of 1011 W/cm2, which will allow the plasmonic targets to withstand thermal damage.[14, 18, 41]
One can see from Fig. 2(b) that, by adding the 1000-nm pulse, the field enhancement factor exceeds 55 dB from t = 12T0 to t = 15T0 with a peak intensity of 5.898 × 10¹⁴ W/cm2 at g = 18 nm, which is sufficient to generate high-order harmonics in He+ ion. Further calculation reveals that the field enhancement degree for 1000 nm is approximately 40% of that for 800 nm, which can shape the enhanced plasmonic field for HHG control as a control field in the waveform synthesis scheme.[41– 43] Figures 2(c) and 2(d) show the harmonic spectra for the one-color 800-nm field and the two-color field. As shown in Fig. 2(d), the cutoff position can be extended remarkably in the two-color field but the harmonic intensity decreases dramatically as the order increases.[45] This may limit the application of isolated attosecond pulses. According to the three-step model, the intensity of harmonics will be greatly improved by increasing the ionization rate.
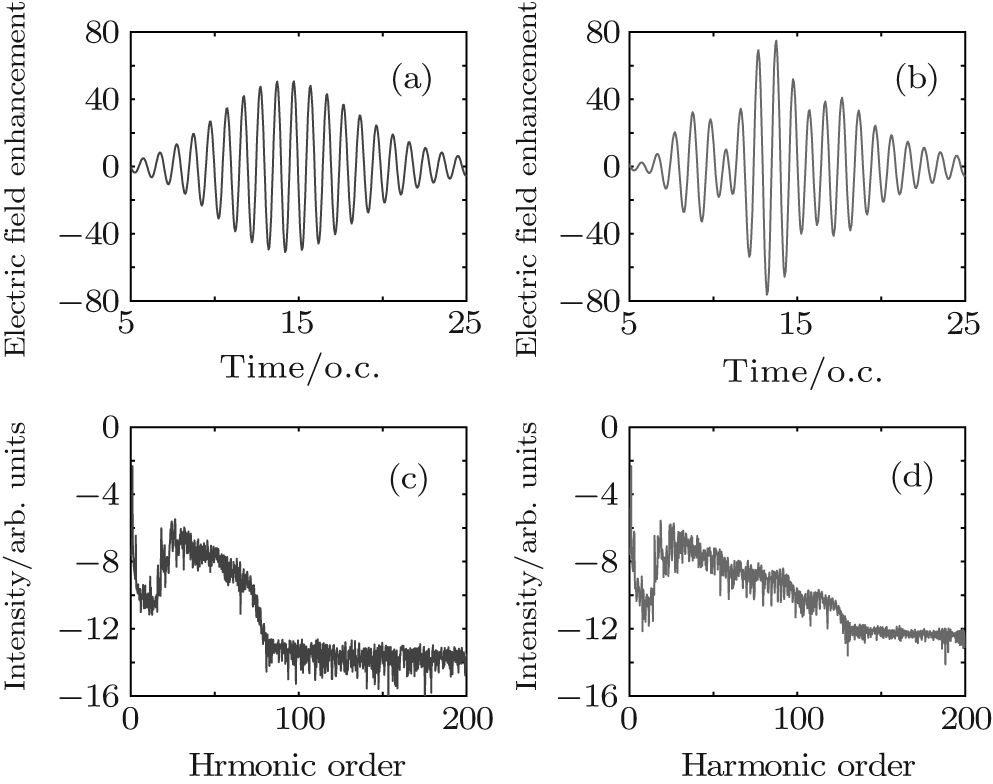 | Fig. 2. (a) and (b) Enhanced 800-nm driving field and enhanced two-color field with the incident driving field amplitude normalized to 1 at g = 18 nm. (c) and (d) Corresponding HHG spectra of the two laser fields, respectively. |
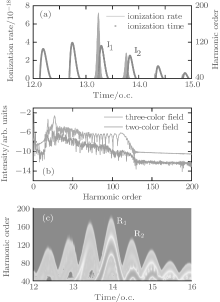
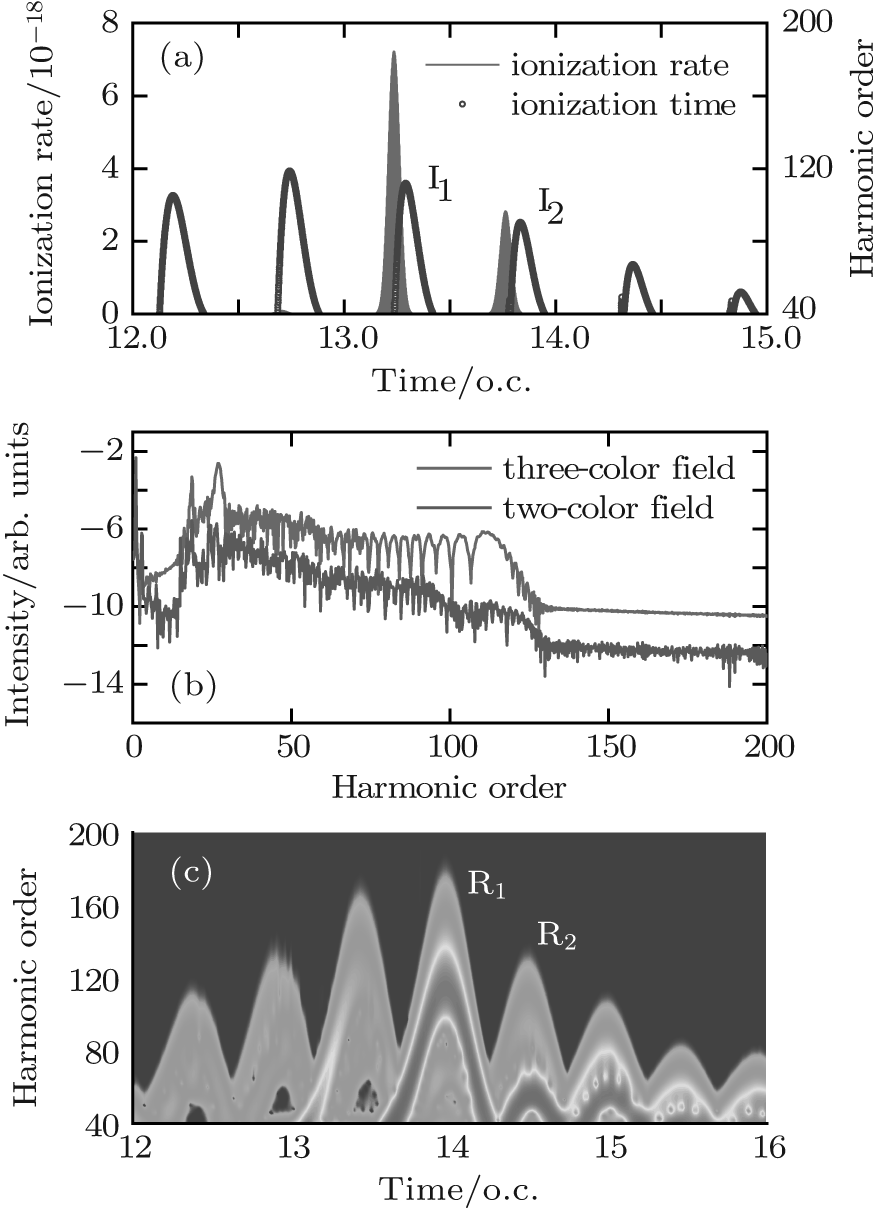 | Fig. 3. (a) The ADK ionization rate in two-color field at φ = π , and the classical ionization paths (blue dots) in the field. (b) The HHG spectrum in the two-color field alone and in combination with a 27th harmonic pulse of 1 fs time duration centered at 13.25T0. (c) The time– frequency distribution in the three-color homogeneous field. |
Figure 3(a) shows the tunnel ionization rate calculated by Ammosov– Delone– Krainov (ADK) model.[46] The dependence of harmonic order on the ionization (blue dots) time is also plotted in Fig. 3(a). The classical behavior of the electron path can be obtained by numerically solving the following Newton equation:

In the calculations we adopt a velocity Verlet algorithm.[47] The initial condition that the electron is ionized from the nucleus with zero velocity is assumed, and we only consider the electrons of the first return. The harmonic order is obtained by qω 0 = Ip + Ekin, where q represents the harmonic order, Ip is the ionization energy of the ground state for He+ , Ekin is the electronic kinetic energy derived from the laser field just before recolliding with the parent ions. One can see that ionization mainly occurs at around t = 13.24T0 and t = 13.76T0, corresponding to the ionization peaks I1 and I2 shown in Fig. 3(a). Then we add a 27th harmonic pulse centered at 13.24T0 so as to increase the ionization rate of I1. It is worth noting that the nanostructure will absorb the energy of 27th harmonic pulse and reduce the field amplitude. In our theoretical models we consider this point by using a reduction factor 0.8 to multiply the amplitude of the incident 27th harmonic pulse. For the input intensity of 2.1937× 10¹¹ W/cm2, we obtain the simulation one of 1.404× 10¹¹ W/cm2. Such a low intensity would only affect the ionization process of atoms and does not change the electronic trajectories. Alternatively, in our calculation, ionization occurs only at the center of the gap. So in practice the spatial distribution of the 27th harmonic pulse has no actual effect on the HHG process. Namely, during the high harmonic generation, the spatial inhomogeneity effect of the 27th harmonic pulse is negligible.[34] One can see that from Fig. 3(b), with the 27th harmonic pulse synthesized into the two-color field, harmonic intensity has been increased significantly, which is about four orders higher than that of the former, but the cutoff position does not change. In order to better understand the process in which the harmonic radiation, we give the time– frequency analysis diagram of the three-color field. Two dominant emission peaks marked R1 and R2 corresponding to the ionization peaks of I1 and I2 are presented in Fig. 3(c). As shown in Fig. 3(c), there are two main radiation peaks of harmonics with the order higher than 80th. Due to the lower intensity of the quantum path around t = 13.2T0, only one peak R1 with the highest order of 125th contributes to the harmonics above 80th, whereas the peak that contains two strong quantum paths results in an obvious modulation near the cutoff region. For the harmonics below 80th, the interference of R2 and other peaks leads to the irregular structure in the spectrum. We suspect that electrons would run further and gain much more kinetic energy before recombining with the parent ions in inhomogeneous field.
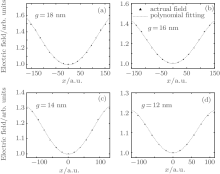
In order to validate our conjecture, we first investigate the electric field distribution for different gap sizes. In this paper, a fourth-order polynomial was used to fit the raw data which are the peak values over the entire pulse duration in different spatial points of the gap and are obtained by FDTD simulation. The polynomial functions are derived by using the “ fit polynomial” module from Origin8.6. Such a spatial distribution of enhanced pulse is definitely more accurate than the linear functional form E(x, t) = E(t)(1 + ɛ x), where ɛ is in the magnitude of around 10− 3.[16, 17, 28, 32– 34] As mentioned earlier, in the time duration, the spatial distribution in the gap remains almost unchanged in appearance. This feature is attributed to a narrow bandwidth of frequency spectrum for the two-color electric field, leading to a faint dispersion phenomena. The relative error of polynomial fitting can be controlled in the order of 10− 5 with the evolution of time. Figure 4 shows the distributions of the inhomogeneous fields for different g values and the polynomial functions are also given. The fourth-order polynomial functions from g = 18 nm to g = 12 nm are represented, respectively, as follows:
Note that the inhomogeneity becomes more and more obvious as the gap size increases. For the three-color field in combination with inhomogeneity, we then study the electron dynamics and the HHG spectrum at g = 18 nm.
 | Fig. 4. The inhomogeneous field distribution for (a) g = 18 nm, (b) g = 16 nm, (c) g = 14 nm, and (d) g = 12 nm, where the triangle points are the raw data (black triangle) obtained from the FDTD simulation and the red dash lines are curves of polynomial fitting. |
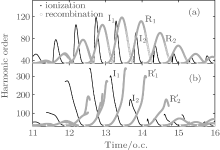
 | Fig. 5. Classical ionization (blue dots) and recombination (red circles) paths in the cases of (a) the homogeneous field and (b) the inhomogeneous field at g = 18 nm. |
Figure 5 shows the dependence of harmonic order on the ionization and recombination times in the homogeneous and inhomogeneous fields at g = 18 nm, respectively. Note that the classical recombination paths shown in Fig. 5(a) is perfectly consistent with the time– frequency distribution shown in Fig. 3(c). Compared with the homogeneous field, long paths are obviously suppressed in the inhomogeneous field. This happens because the limitation of gap size plays a crucial important role in the phenomenon, which leads to the electrons hitting the metal surfaces and being unable to return to the parent ions to emit photons. Moreover, electrons are forced to reaccelerate due to the inhomogeneity in the continuum before recombination. Then, the extra kinetic energy will be gained, which leads to a higher harmonic generation. As shown in Fig. 3(a), it can be seen from the ionization rate that only two paths mainly contribute to higher harmonics generation. The corresponding ionization and recombination peaks for homogeneous and inhomogeneous cases are marked as I1, I2, R1, R2, and 


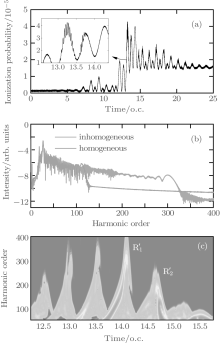
In order to verify our conclusion, we calculated the HHG spectrum in the three-color field considering inhomogeneity by adopting fourth-order polynomial fitting. In our calculation, the gap size of the gold bowtie nanostructure is set as g = 18 nm. The results are displayed in Fig. 6(b) (red solid line). For comparison, the HHG spectrum in the homogeneous case is also presented in this figure (black solid line). However, in the inhomogeneous case, we found a substantial increase in the harmonic cutoff position, which is about 170% higher than that of the former case. Above all, a smooth supercontinuum can be generated in the inhomogeneous field, as expected.
To give a clear interpretation of the spectrum, we present the time– frequency distribution in Fig. 6(c). Note that it is perfectly consistent with the classical recombination as shown in Fig. 5(b). Then two dominant emission peaks 


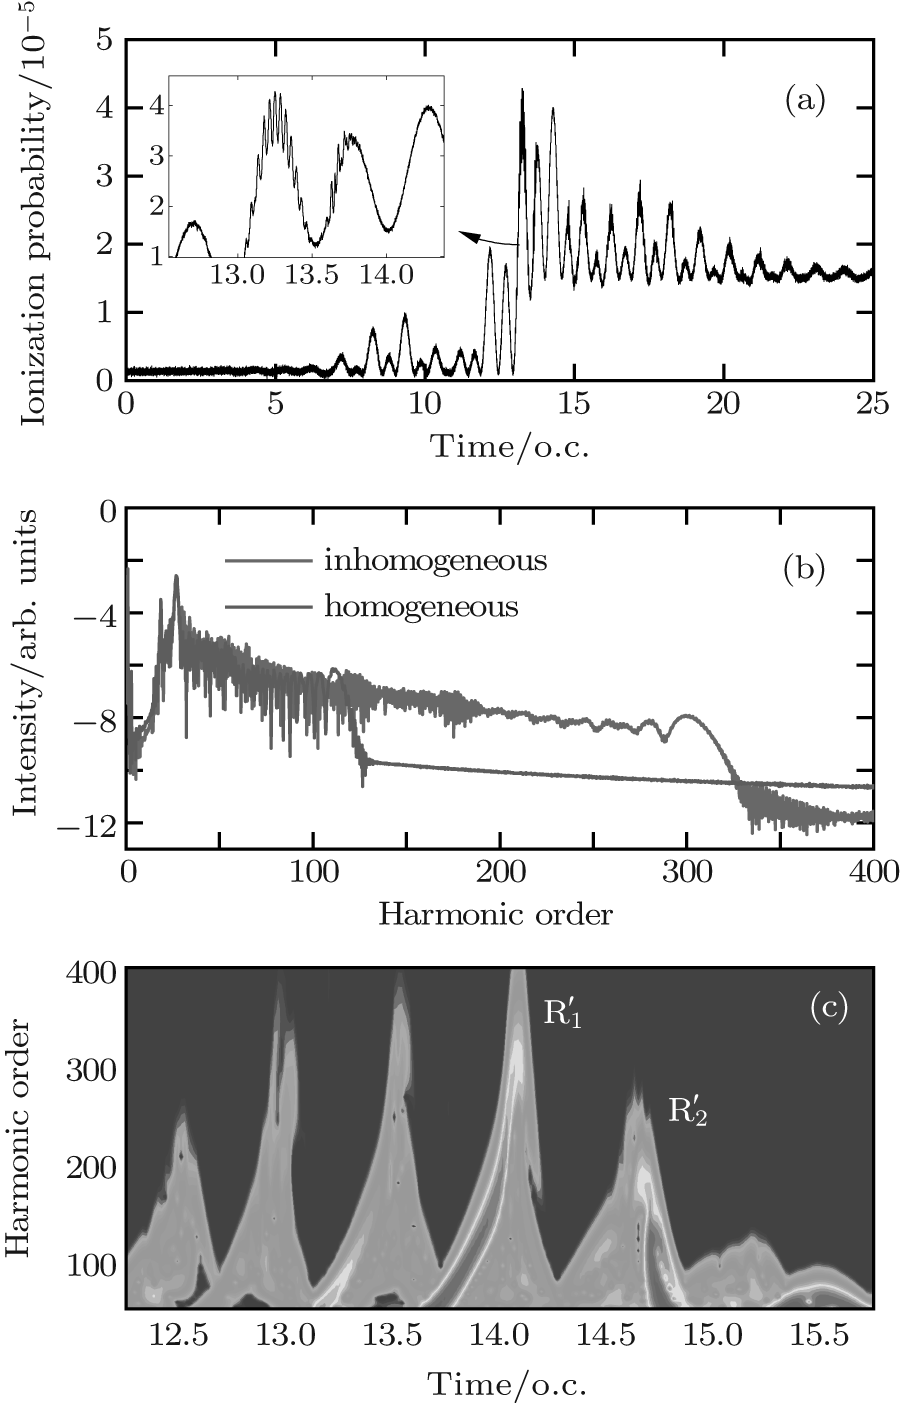 | Fig. 6. (a) The ionization probability obtained from the three-color inhomogeneous field at g = 18 nm. (b) The harmonic spectra (red line) in inhomogeneous field and the spectra (green line) in homogeneous field. (c) The corresponding time– frequency distribution in inhomogeneous field. |
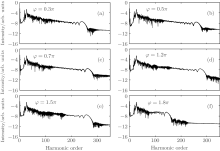
In the following, we investigate the HHG process in the three-color inhomogeneous field with different relative phases φ between the fundamental field and the control field. We add the 27th harmonic pulse appropriately in order to select specific electron trajectories. Figure 7 shows the harmonic spectra for different relative phases between driving and control pulses. It is found that the smoothed supercontinuum can be obtained regardless of relative phases, which greatly relaxes the requirement of a piezoelectric translator on phase control and is therefore more accessible experimentally.[48] One can also see from Fig. 7(f) that the cutoff position is restricted to about only 150th at φ = 1.8π , namely the peak value of 

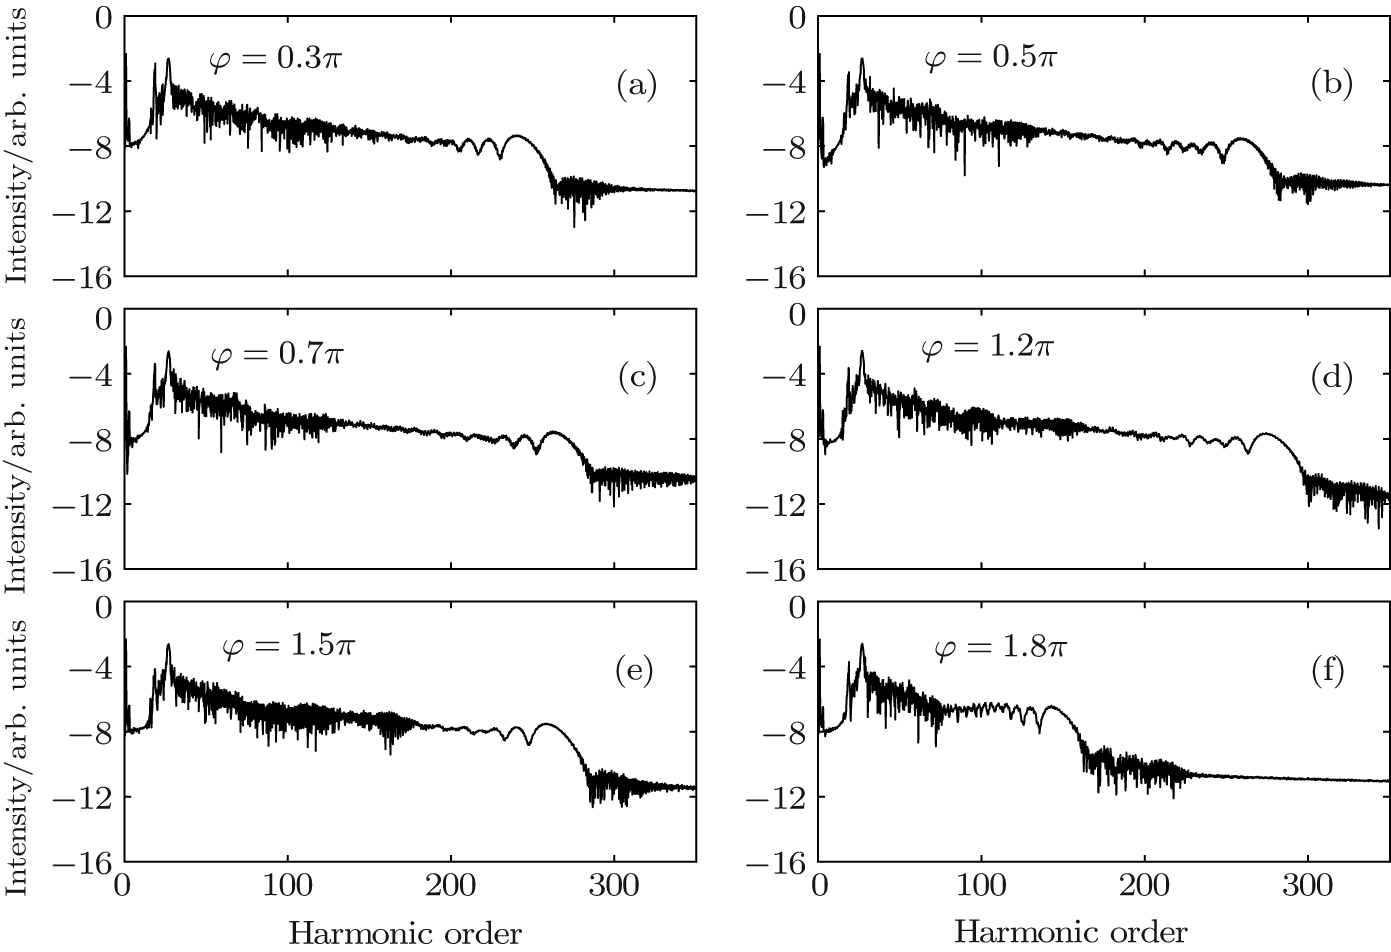 | Fig. 7. The harmonic spectra with different relative phases between driving and control pulses. |
Since the gap size plays an important role in inhomogeneity, we further discuss the dependence of the supercontinuum yield on it with the relative phase φ = π . The harmonic spectra for different g values are plotted in Figs. 8(a), 8(c), and 8(e), respectively. Figures 8(b), 8(d), and 8(f) are the corresponding time– frequency distributions. It is shown that, with the decreasing gap size, the plateau region can be significantly expanded, but the spectral modulation increased gradually. We can see from Fig. 8(b) that at g = 16 nm, the highest harmonic order of 


According to the viewpoint mentioned, as the gap size decreases, the entire ionization time of the long path of 


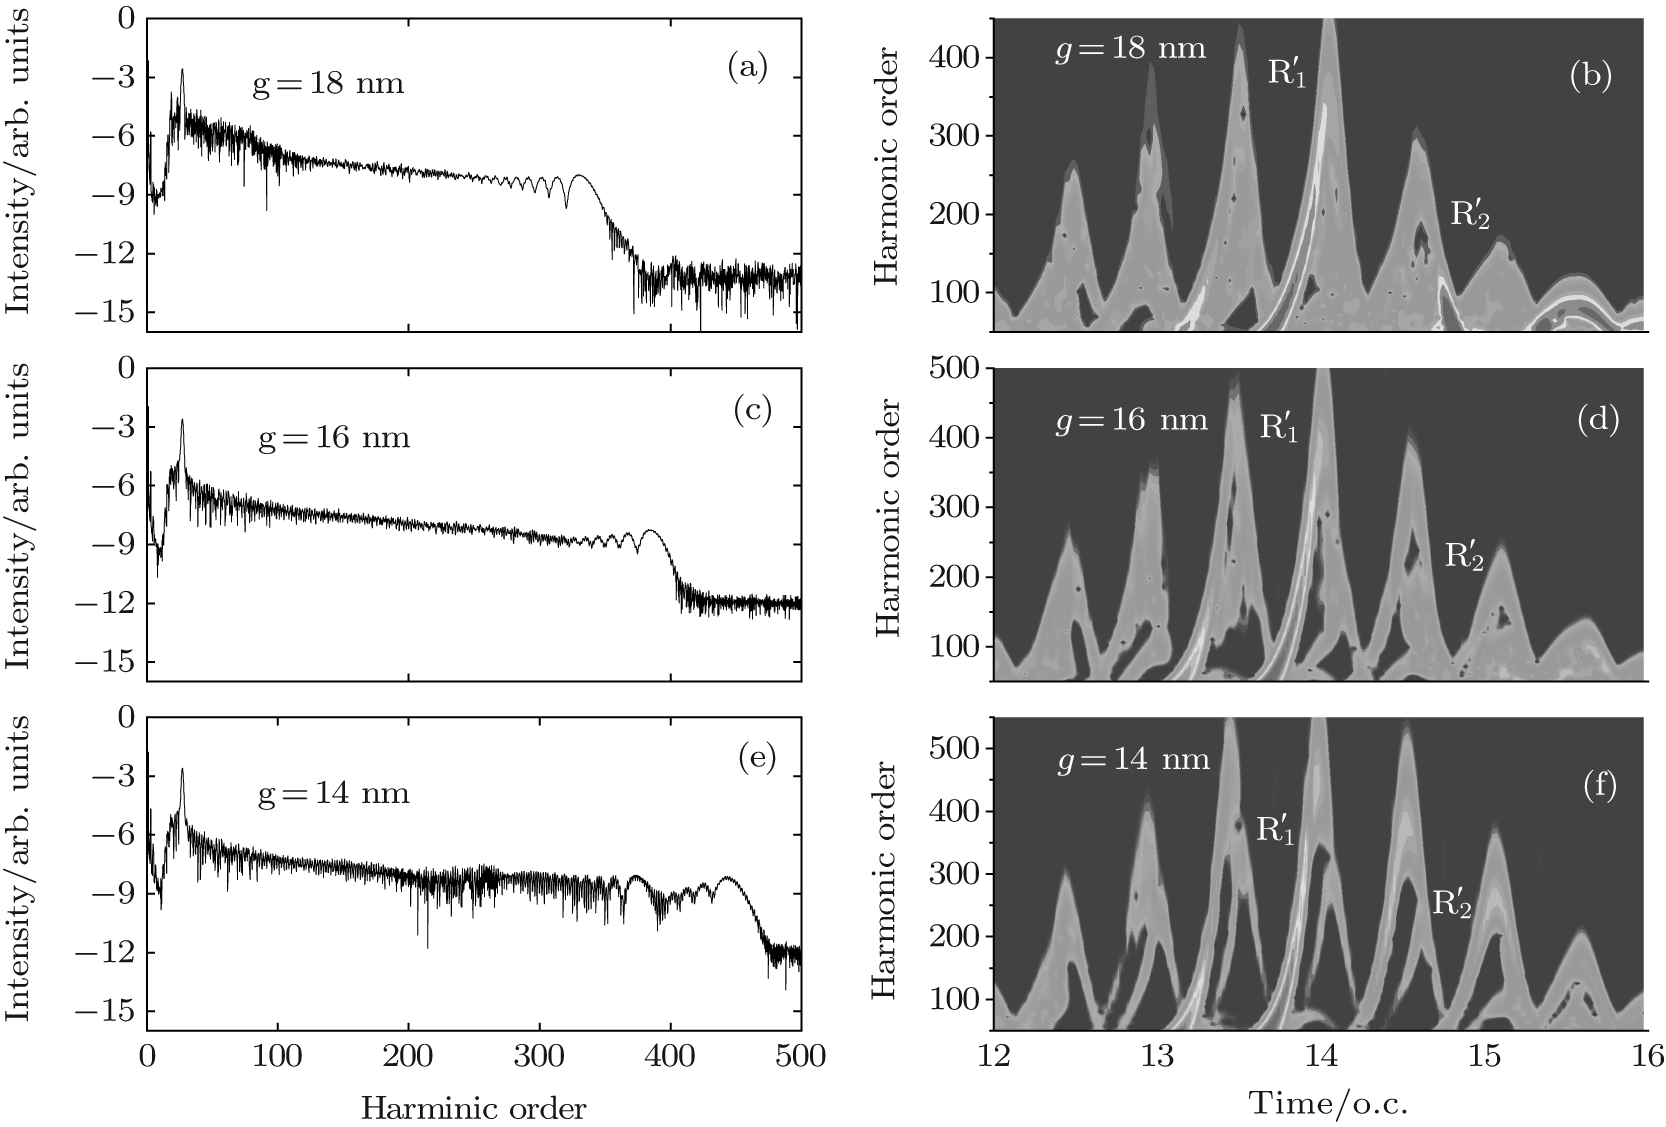 | Fig. 8. Harmonic spectra (a), (c), (e) and the corresponding time– frequency distributions (b), (d), (f) of different gap sizes in the two-color inhomogeneous field combined with 27th harmonic pulse at φ = π . |
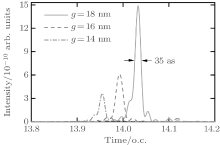
 | Fig. 9. Temporal envelopes of the attosecond pulses for different gap sizes. |
Moreover, with the decreasing gap size, the strength of the electric field in the further distance is not strong enough to reaccelerate the electrons, so that most of long paths cannot be suppressed; and the intensity of 27th harmonic pulse becomes relatively weaker than that of the enhanced two-color field, which causes a low intensity of higher harmonic radiation. These two points cause more trajectories to jointly contribute to higher harmonic generation, making the spectra irregular. In other words, it is clear that the impact of inhomogeneity on HHG spectra is great, especially in the case of a large gap size. Therefore, one should control the gap size appropriately in experiment to make the best use of inhomogeneity and field enhancement. This can be achieved by further optimizing the nanostructure.
Next, we further investigate the attosecond pulse generation in the inhomogeneous field with φ = π by superposing a number of harmonics near the cutoff of the HHG spectrum. As shown in Fig. 9, for g = 18 nm, we select the harmonics between 200th and 265th, a roughly 35-as isolated attosecond pulse (red line) with bandwidth of 100 eV can be obtained directly. Such a short isolated pulse may be valuable in probing and controlling the electronic dynamics inside atoms and molecules. As also plotted in Fig. 9, a 40-as isolated attosecond pulse (blue dash line) can be generated by superposing 250th to 300th harmonics at g = 16 nm. A 35-as isolated attosecond pulse (violet dash dot line) can also be generated by superposing 280th to 350th harmonics at g = 14 nm. The emission time of these isolated attosecond pulses are all centered at about 14T0, corresponding to the extended short path of 
In conclusion, we have theoretically investigated the electron dynamics of HHG in the multi-cycle three-color inhomogeneous field. The real spatiotemporal profile of electric field is obtained by the FDTD simulation of a bowtie-shaped gold nanostructure, which is much more accurate than the general linear function used in spatial inhomogeneity. It is found that the present of spatial inhomogeneity and space limitation can modify the ionization, acceleration, and recombination of the high-order harmonic generation apparently. By properly adding a 27th harmonic pulse with the duration of 1 fs into the field, a single quantum path can be directly selected. Further investigation indicates that supercontinuum can be obtained regardless of relative phases between the fundamental and the control field, opening a new way to obtain isolated attosecond pulse with a relaxed relative phase selection in the waveform synthesis scheme. In addition, a broadband supercontinuum can be generated by optimizing the gap size appropriately. Then, a 35-as isolated pulse can be obtained, which is useful for its application in ultrafast detection with high temporal resolution.
| 1 |
|
| 2 |
|
| 3 |
|
| 4 |
|
| 5 |
|
| 6 |
|
| 7 |
|
| 8 |
|
| 9 |
|
| 10 |
|
| 11 |
|
| 12 |
|
| 13 |
|
| 14 |
|
| 15 |
|
| 16 |
|
| 17 |
|
| 18 |
|
| 19 |
|
| 20 |
|
| 21 |
|
| 22 |
|
| 23 |
|
| 24 |
|
| 25 |
|
| 26 |
|
| 27 |
|
| 28 |
|
| 29 |
|
| 30 |
|
| 31 |
|
| 32 |
|
| 33 |
|
| 34 |
|
| 35 |
|
| 36 |
|
| 37 |
|
| 38 |
|
| 39 |
|
| 40 |
|
| 41 |
|
| 42 |
|
| 43 |
|
| 44 |
|
| 45 |
|
| 46 |
|
| 47 |
|
| 48 |
|