General design basis for a final optics assembly to decrease filamentary damage*
[Sun Xiao-Yana), b) , Lu Xing-Qianga)†  , Lü Feng-Nian
a) , Zhang Guo-Wena) , Zhang Zhena) , Yin Xian-Huaa) , Fan Dian-Yuana) ]
, Lü Feng-Nian|
|

 , Lü Feng-Nian
†Corresponding author. E-mail: xingqianglu@siom.ac.cn
*Project supported by the National Natural Science Foundation of China (Grant No. 60707019).
The high-power laser beam in the final optics assembly of high-power laser facilities is often modulated by contamination particles, which may cause local high light intensity, thereby increasing the filamentary damage probability for optical components. To study the general design basis for a final optics assembly to decrease the risk of filamentary damage, different-sized contamination particles deposited on a component surface are simulated to modulate a 351-nm laser beam based on the optical transmission theory, and the corresponding simulation results are analyzed statistically in terms of the propagation characteristic and the light field intensity distribution of the modulated laser beam. The statistical results show that component thickness and distance between components can to some extent be optimized to reduce the appearance of local high light intensity, and the general design basis of component thickness and arrangement are given for different control levels of particle sizes. Moreover, the statistical results can also predict the laser beam quality approximately under the existing optics design and environmental cleanliness. The optimized design for final optics assembly based on environmental cleanliness level is useful to prolong the lifetime of optics and enhance the output power of high-power laser facilities.
The beam quality of high-power laser facilities, such as the National Ignition Facility (NIF) laser of America, the Laser Mé gajoule (LMJ) laser of France, and the SG laser of China, is an important specification in ensuring the success of physics experiments and the safety of optical components during laser shots.[1– 3] The final optics assembly (FOA) of high-power laser facilities has minimal space, an important function, and compact optical layout, and the damage of ultraviolet optics is one of the most serious parts in laser damage, which limits the output energy of high-power laser facilities.[4– 6] Various techniques have been applied to increase the output energy of a 3ω (351 nm) laser, such as increasing damage thresholds of fused silica, managing ghost beams reasonably, protecting environment cleanliness of optical system, etc. However, material defects and poor environmental cleanliness in the process of the laser shot still badly limit the output energy.[7, 8]
In FOA, contaminant particles, a general term of micron-sized metals, oxides, material defects and so on, can primarily cause a high light intensity modulation for a laser beam, [9] generate hot-image, [10– 12] and induce filamentary damage inside components, [13, 14] which decrease the laser beam quality and the operating lifetime of the components. Most researchers have focused on analyzing the evolvement of the modulated laser beam, and the generation and growth of damage sites, [15– 17] but there are a few researchers who have looked at the general design basis for final optics assembly without increasing costs. Given that fused silica is used widely in optical system, the general design basis in this paper is based on fused silica optics.
In this paper, we simulate the light field distribution of a laser beam modulated by contamination particles as a function of propagation distance, analyze the rule of the light intensity modulation, and put forward some general design of component thickness and distance between components based on fused silica under different levels of environmental cleanliness, which aims to decrease the damage potential of components at 3ω in FOA. This article is organized as follows. Section 2 is focused on the disturbance model of contamination particles based on the optical transmission theory and statistical methods of the propagation rule of the modulated laser beam. In Section 3, we mainly simulate two situations: 1) the evolvement of light field in a component when the particles have fallen on the front-surface of the component; 2) the evolvement of light field in a downstream component when the particles have fallen on the surface of an upstream component. The corresponding optimized design based on component thickness and distance between components is provided by statistically analyzing the simulation results. Finally, the main results of the paper are summarized.
In the numerical simulation, an ideal laser pulse can be expressed as[15]

where A0 is the signal amplitude, r is the radial coordinate of cylindrical coordinates, n shows the spatial distribution of a pulse (n = 1 is Gaussian beam and n > 1 is super-Gaussian beam), σ is the half width at half maximum for the spatial distribution of a pulse, t is the time coordinate, m shows the time waveform of a pulse, and τ is the half width at half maximum for the time waveform of a pulse.
On the basis of optical transmission theory, the paraxial nonlinear Schrodinger approximation in medium is simplified as

where n0 and n2 are, respectively, the linear refractive index and nonlinear refractive coefficient of a medium, and k0 is the propagation constant. The laser propagation process in free space is depicted as

The mechanism for the light intensity modulation of contaminated fused silica is that particles affect the amplitude or phase of incident light field, [18] and the transmission function of contaminated optics can be defined as

where t(x, y, z) is the spatial distribution of optical transmittance, and φ (x, y, z) is the spatial distribution of phase distortion. Phase modulation may produce more serious laser intensification and more easily cause initial damage to optics than that of amplitude modulation, [3] so the particles with phase modulation known as “ phase particles” are selected for simulation. Moreover, there are a variety of particle shapes, so we only pay attention to particle sizes and select circular particles as examples. The circular phase particles can be simplified as two-dimensional distributions

where h is the particle thickness, r0 is the particle radius, and (x0, y0) is the horizontal center coordinate of phase modulation. The transmittance is expressed as

where θ = [2π (n − 1)h]/λ is the depth of phase modulation and 0 ≤ θ ≤ 2π .
Particle sizes in the environment have a serious effect on the quality of the laser beam. In this paper, environmental cleanliness is defined by the controlled level of particle sizes, and environmental cleanliness 2rc μ m means that the diameters of contamination particles are less than or equal to 2rc μ m. Except for particle sizes, the modulation depths of particles are also a key factor which affects the light intensity distribution. In free space, the highest intensity value only changes with modulation depths of particles and not particle sizes: the deeper modulation depths for particles with θ ∈ [0, π ]that the particle has, the higher intensity the modulation produces during the propagation process, and the relatively shorter distance the high intensity needs to be evenly dispersed by diffraction; the larger the particle sizes are, the farther the position of the highest intensity is from the particle position, and the longer propagation distance the local high intensity needs to be diffracted to an acceptable level of intensity distribution.[19] Based on the above property, for the distance design between components in environmental cleanliness 2rc μ m, we can mainly fix the particle size as 2rc μ m and change its modulation depth [θ = 2π i/30, (i = 1, 2, ..., 30)] to obtain the statistic results of 30 particles. For the design of component thickness in environmental cleanliness 2rc μ m, owing to the co-existence of diffraction and self-focusing effects in components, both the deep modulation depths and large sizes of particles have a serious effect on the laser intensity modulation, so we investigate two situations: first, we set the modulation depth θ = π and change the particle sizes [r0 = rci/30, (i = 1, 2, … , 30)]; second, we fix the particle size 2rc μ m and change the modulation depth [θ = 2π i/30, (i = 1, 2, … , 30)], which obtains statistic results of 60 particles. To analysis the simulated results, we define the intensification factor IR(z) = max [I(x, y, z)/Iin][3] and the filling factor F(z) = 〈 I(z)〉 /Imax(z) in the beam cross-section at z, where Iin is the initial light intensity, 〈 I(z)〉 is the average light intensity, and Imax(z) is the maximum value of light intensity. For a series of statistical results for different particles, the maximum intensification factor IM(z) = max[Ii, R(z)], i = 1, 2, … , N and the worst filling factor FW(z) = min[Fi(z)], i = 1, 2, … , N are defined to describe the beam quality, where N is the number of different particles.
On the basis of Eq. (2), the split-step Fourier method is used to simulate the beam propagation. The simulated Gaussian laser beam at 351 nm has a pulse full width at half the maximum of 3 ns, a circular cross-section distribution of fifth-order super-Gaussian, an average fluence of ∼ 6 J/cm2, and a diameter of 10-mm at 1% of the maximum intensity. For fused silica components, the linear refractive index is 1.4767 and the nonlinear refractive index is 3.1× 10− 16 cm2/W. The range of calculation window is set as 12 mm× 12 mm and conducted on 2048× 2048 grid points. The simulated contaminant particle is located at the center of the laser beam. Given that the light intensity distribution is uniform in the central area of the beam cross-section and the particle with a small enough size can only modulate a small local area of the laser beam, we choose the 4 mm× 4 mm beam’ s central area to analyze the parameter change of the light field pattern.
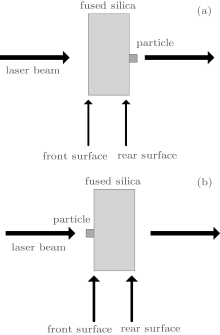
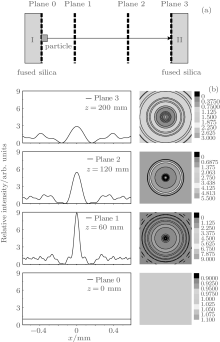
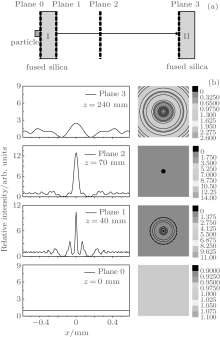
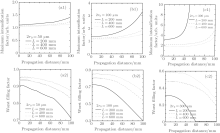
Contamination particles are always positioned at the surface of a component to disturb the incident laser beam, which is shown in Fig. 1, and we select different particle sizes (2r0 = 50, 100, 300 μ m, θ = π ) to simulate the corresponding change of the light field pattern. The situation of Figs. 1(a) and 1(b) is used to study the propagation rule of the modulated beam in free space and in components mainly, respectively, which is relative to the design of distance between optics and component thickness. For Fig. 1(a), the disturbed laser beam propagates in free space directly, and the intensification factor and the light intensity distribution along the z axis are plotted in Fig. 2. Under diffraction effects, these particles with different sizes cause the same maximum value of intensification factor approximate nine and different modulation ranges in the beam cross-section. With the increase of particle sizes, the modulation for the light field pattern becomes more severe, and it requires a longer distance to smooth out the high-contrast intensity modulation by diffraction effects. Similarly, figure 3 shows the simulated light-intensity modulation in a component for the situation of Fig. 1(b): the modulated laser beam propagates in the component directly and generates a light modulation higher than that in the free because of the co-existence of diffraction and self-focusing effects, for which the distribution shape of local high light-intensity is related to the phenomenon of filamentary damage. For the 50-μ m and 100-μ m particles, the generated light intensity modulation is relatively high but not enough to induce strong small-scale self-focusing. For the 300-μ m particles, the light intensity modulation is so strong in the initial propagation process that the small-scale self-focusing is induced obviously, which easily causes filamentary damage for components in the later propagation process. Based on the above simulation results, the front-surface particles can cause more severe light modulation than the rear-surface particles do, so the component thickness should be optimized first and then the distance between the optics should be based on the foundation of the optimized component thickness.
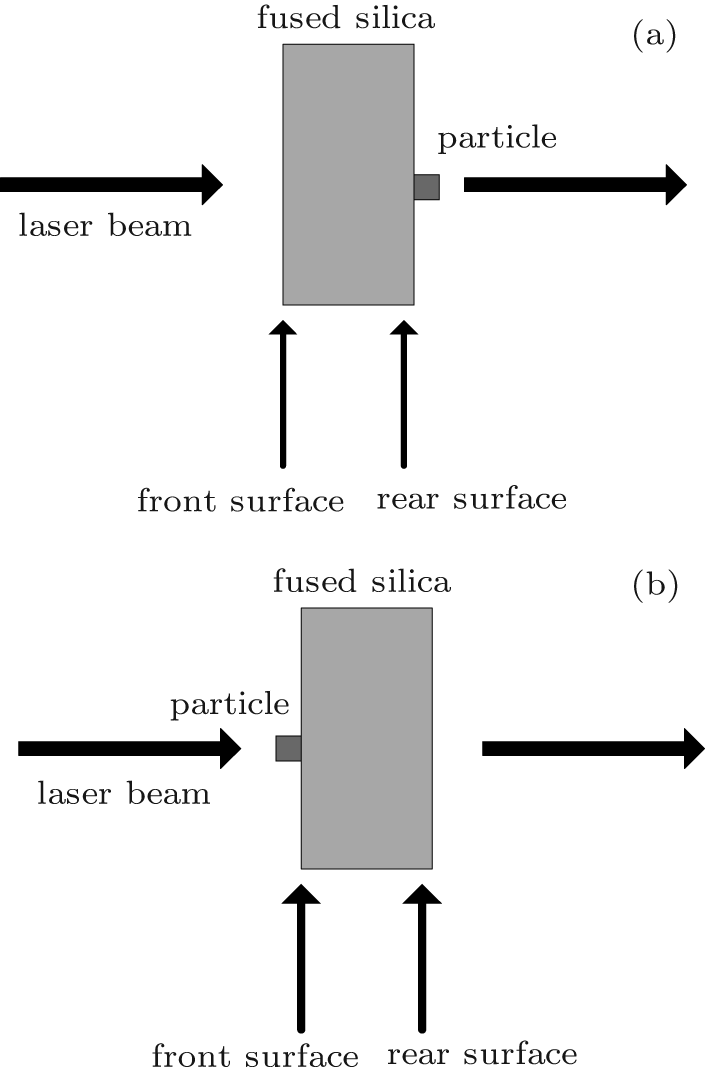 | Fig. 1. Schematic diagram of a contamination particle on the (a) rear-surface and (b) front-surface of a component. |
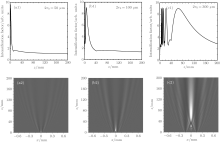
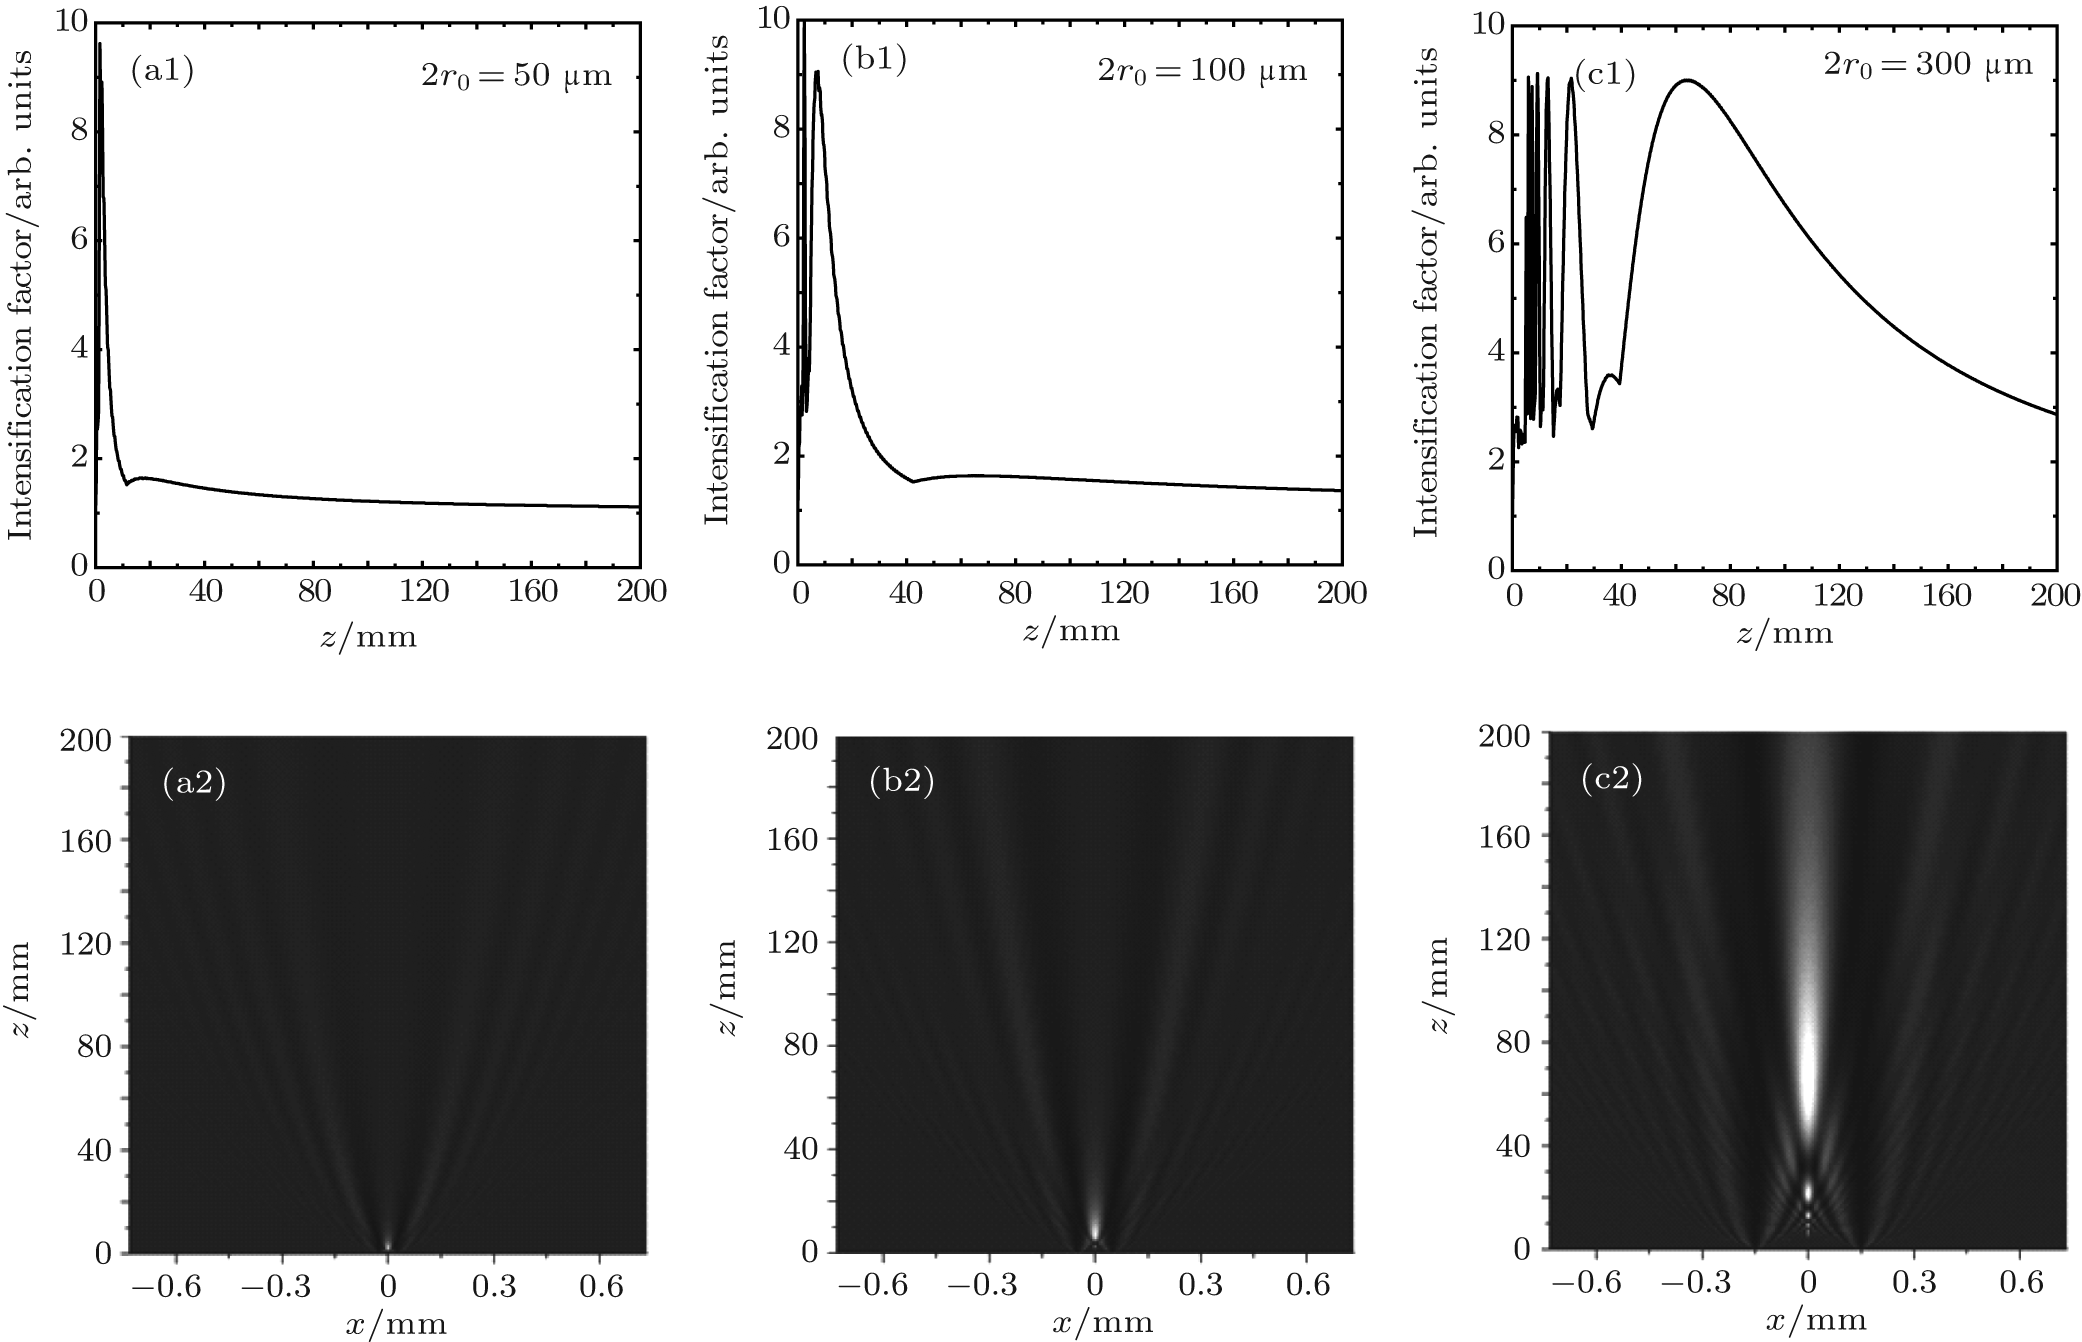 | Fig. 2. Intensification factor ((a1), (b1), and (c1)) and light-intensity distribution ((a2), (b2), and (c2)) along the z axis in free space from a circular particle of sizes 50 μ m ((a1) and (a2)), 100 μ m ((b1) and (b2)), and 300 μ m ((c1) and (c2)) on the rear-surface of a fused silica component. |
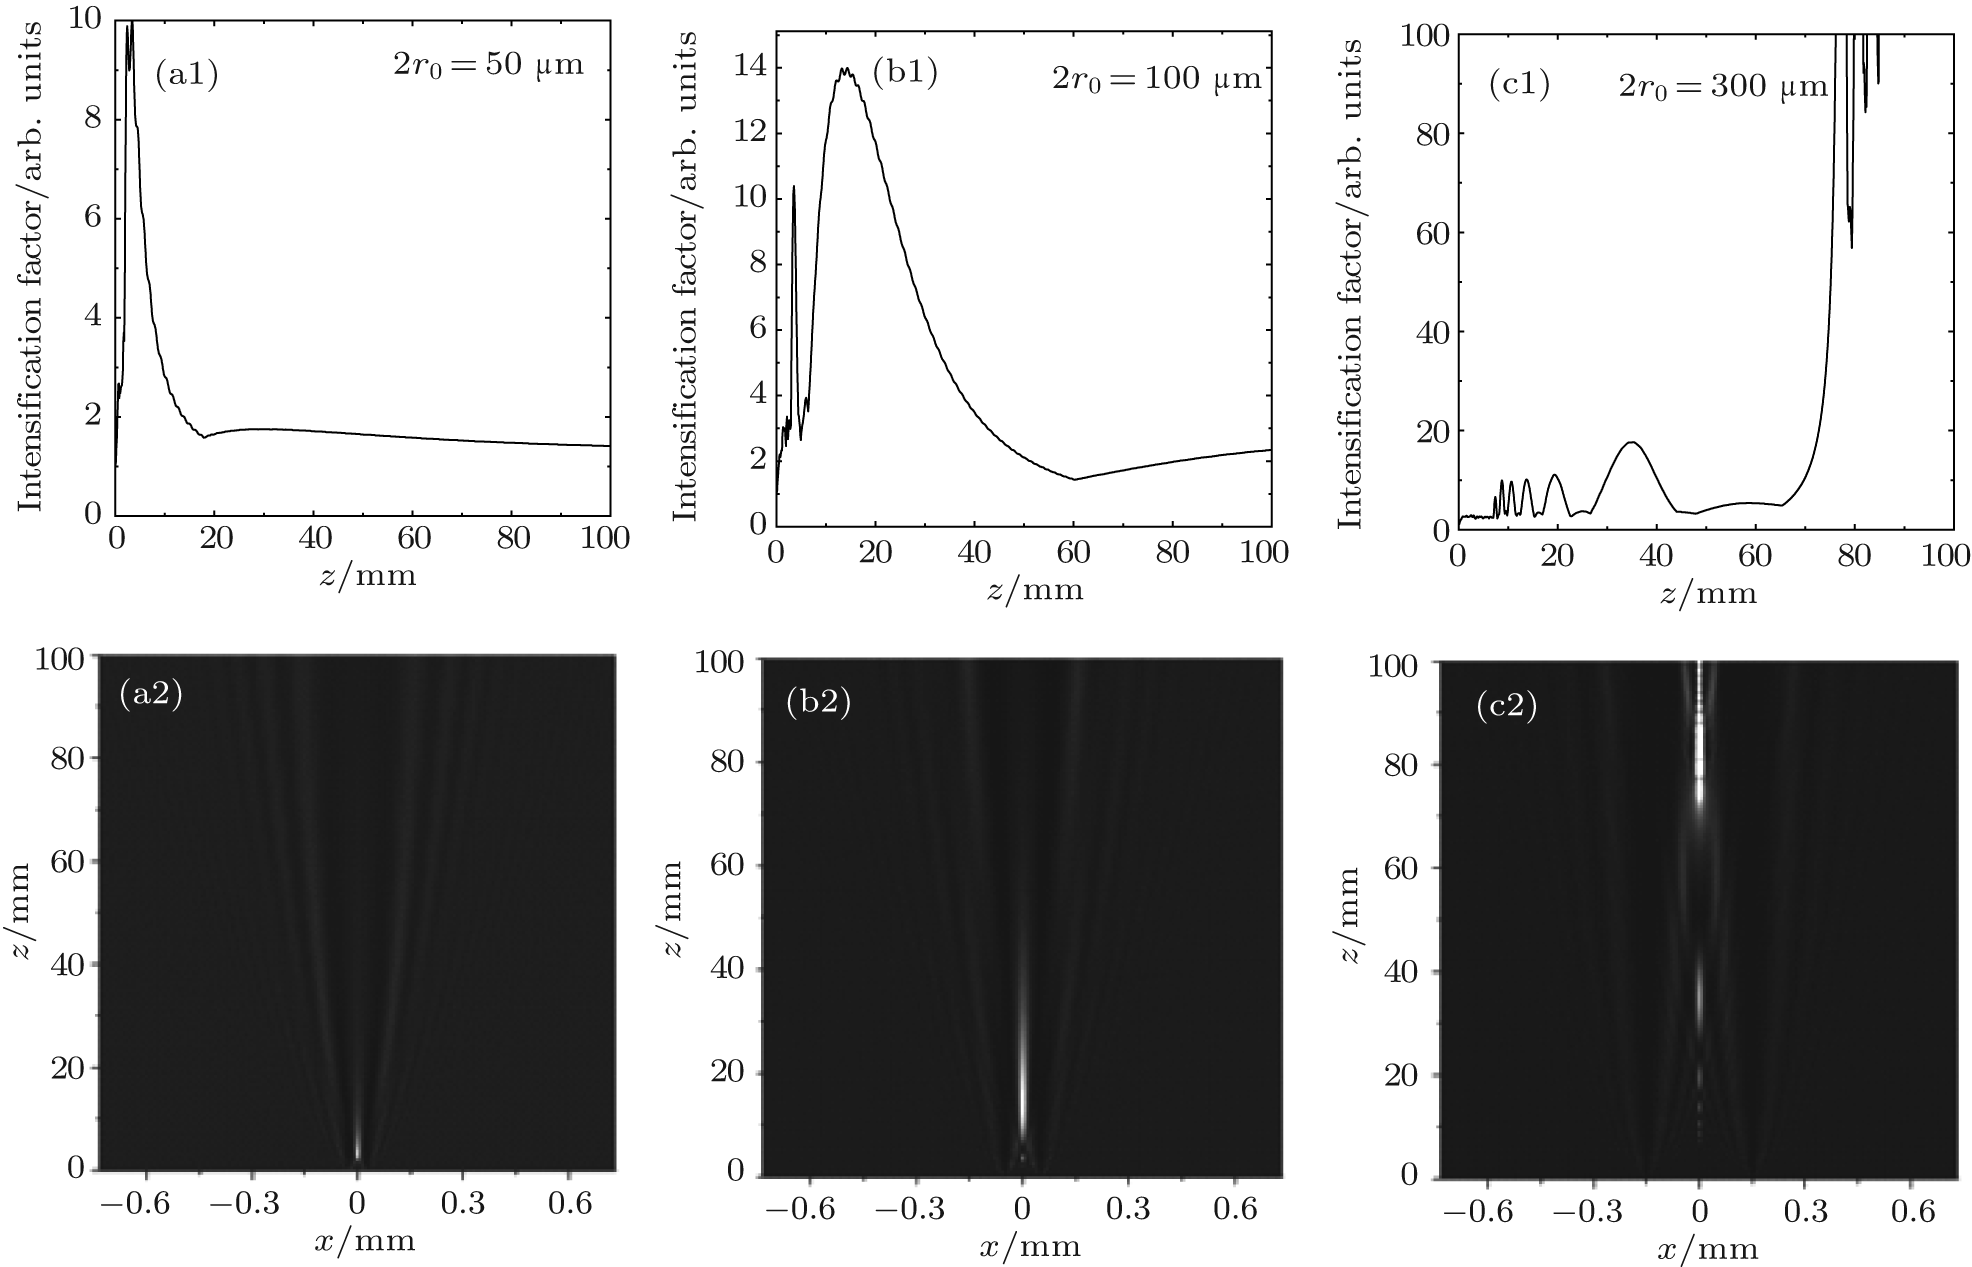 | Fig. 3. Intensification factor ((a1), (b1), and (c1)) and light-intensity distribution ((a2), (b2), and (c2)) along the z axis in fused silica medium from a circular particle of sizes 50 μ m ((a1) and (a2)), 100 μ m ((b1) and (b2)), 300 μ m ((c1) and (c2)) on the front-surface of a fused silica component. |
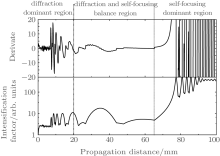
To further observe the light intensity evolution of Fig. 3(c), we take a derivative of the intensification factor with respect to the propagation distance, which is given by

and the derivate curve in Fig. 4 more obviously shows the competition between diffraction and self-focusing effects. Depending on the changing speed of the derivate curve, the derivate curve is divided into three regions: diffraction dominant region, diffraction and self-focusing balance region, and self-focusing dominant region. 1) In the initial stage of the diffraction dominant region, although diffraction effects become stronger gradually with the increase of propagation distance, the derivation curve changes slowly. The ideal component thickness can be selected in this region, such as the 2-mm-thick splash plate in the 3ω optics of FOA, which is very beneficial to avoid the damage caused by small-scale self-focusing. However, it is very difficult to manufacture and use large aperture optics with small thicknesses, consequently they are rarely used practically. In the later stage of the diffraction dominant region, the derivate curve and the corresponding intensification curve change rapidly, which show the poor beam quality. 2) In the diffraction and self-focusing balance region, the derivate curve changes relatively slowly, and the intensification factor is not high. In addition, the bulk damage threshold is higher than the surface damage threshold in optics, so the thickness of large aperture optics is suitable to reach this region. 3) In the self-focusing dominant region, the local light intensity is changed sharply and probably, which may exceed the damage threshold of optics and easily induce filamentary damage to the optics, so the component thickness should not reach this region. In conclusion, to reduce the damage risk of small-scale self-focusing, it is preferred to make the component thickness reach the diffraction and self-focusing balance region.
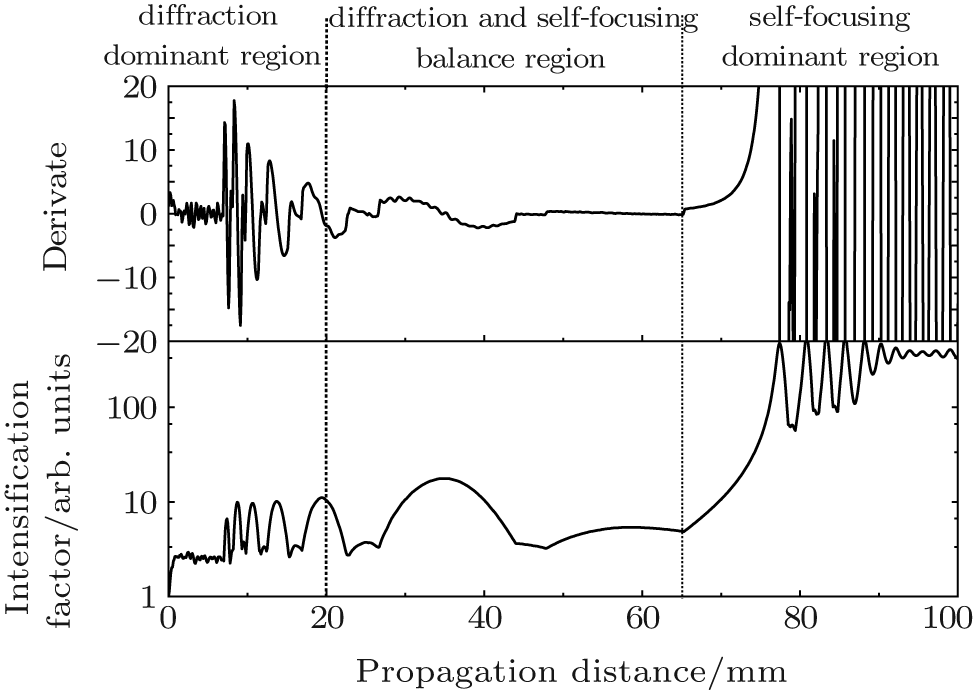 | Fig. 4. Propagation characteristics of laser beam modulated by a 300-μ m particle on the front-surface of a fused silica component. |
For different modulation depths and sizes of particles, the range of the diffraction and self-focusing balance region may have a slight difference, but a common area can be obtained statistically. For every environmental cleanliness level, 60 particles are simulated to obtain a series of derivate curves, from which we can obtain a general range of the diffraction and self-focusing balance region. For the environmental cleanliness 50 μ m, the small-scale self-focusing does not appear generally, according to the result of the simulation, which agrees with the experimental results as shown in Ref. [20]; therefore, in this case, the component thickness has no special requirements. For environmental cleanliness 100 μ m, the component thickness is from 15 mm to 40 mm, appropriately. For environmental cleanliness 300 μ m, the optimized component thickness is from 20 mm to 30 mm, and should not exceed 40 mm.
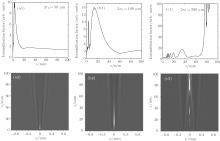
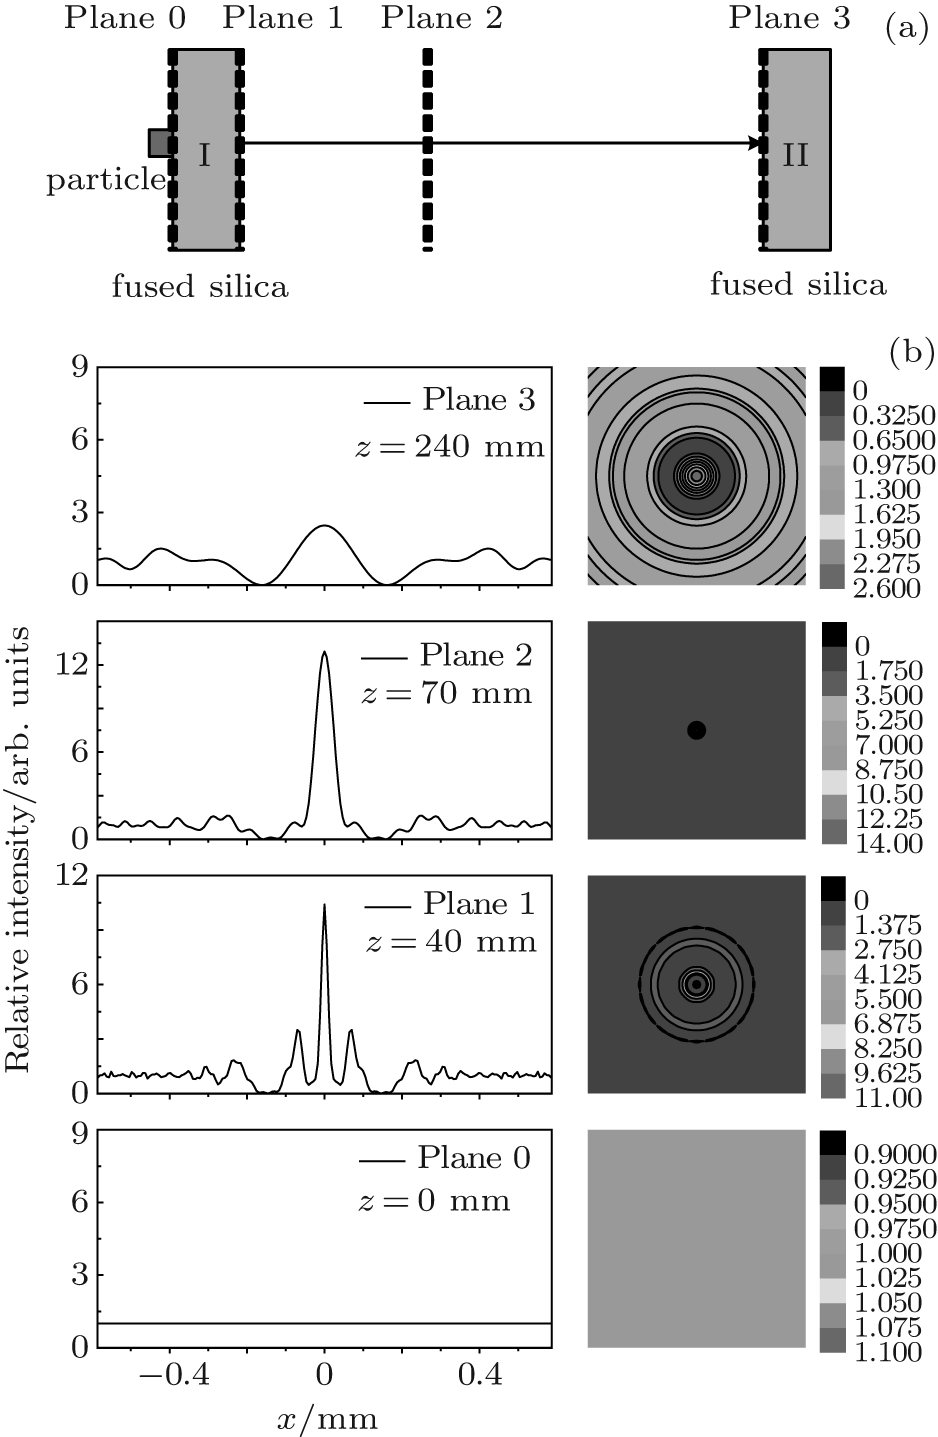
If the laser beam that is disturbed by the contamination particles on the upstream component beam is not smoothed out to some degree before entering the downstream component, the poor light field pattern can also induce the damage for the downstream component. Figures 5 and 6 show the light field patterns at different propagation distances for a contamination particle (2r0 = 300 μ m, θ = π ) that has fallen on the rear-surface and front-surface of the upstream component, respectively, and the position of particle is defined as the origin to get the value of propagation distance z. For Fig. 5(b), Plane 1 shows a high-contrast intensity at a beam cross-section, Plane 2 shows the high intensity is smoothed out gradually, and Plane 3 at the front-surface of the downstream component shows a relatively uniform intensity distribution. Similarly, for Fig. 6(b), Plane 1 shows the output light field pattern of the upstream component, Plane 2 shows a high-contrast light field pattern in free space, and Plane 3 shows a relatively good-quality light field pattern. The front-surface particles in Fig. 6(a) can induce a high light intensity modulation at the rear-surface of the upstream component, which may cause a stronger intensity modulation in free space by diffraction than that in Fig. 5. For both Figs. 5 and 6, enough distance between components can sufficiently smooth out the modulated light field and get a relatively uniform light field pattern at Plane 3, which can decrease the risk of filamentary damage for the downstream component.
 | Fig. 5. Effect of rear-surface contaminant particles of upstream component on the incident beam characteristics of downstream component. (a) Diagram of optical layout; (b) light field patterns at different positions. |
 | Fig. 6. Effect of front-surface contaminant particles of upstream component on the incident beam characteristics of downstream component. (a) Diagram of optical layout; (b) light field patterns at different positions. |
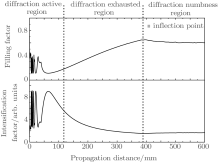
To estimate the value of enough distance between components, we need to analyze the propagation characteristic of the disturbed laser beam in free space. Figure 7 shows the intensification factor and the filling factor along the propagation axis in free space for an incident beam disturbed by a particle (2r0 = 300 μ m, θ = π ). Depending on the changing speed of intensification factor, the curve of intensification factor is divided into three regions( diffraction active region, diffraction exhausted region, and diffraction numbness region), which shows that the high light intensity modulation changes quickly at first, and then decreases gradually and finally reaches approximately 2 gradually with the increase of propagation distance. Simultaneously, the effect of diffraction on improving the beam quality becomes increasingly weaker. Similarly, the curve of filling factor changes quickly at first, it then stabilizes and rises gradually, and finally exhibits an inflection point, after which the filling factor cannot be enhanced almost by diffraction. Thus, to arrange more components in a narrow space and avoid the continuous high-light intensity modulation among components, the components need to be placed near the position of the inflection point. Moreover, the position of the inflection point is related to the particle size, and for the particles (2r0 = 50, 100, 300 μ m, θ = π ), the corresponding position of inflection points obtained are approximately 200, 400, and 600 mm.
 | Fig. 7. Propagation characteristics of a disturbed beam in free space. |
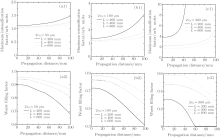
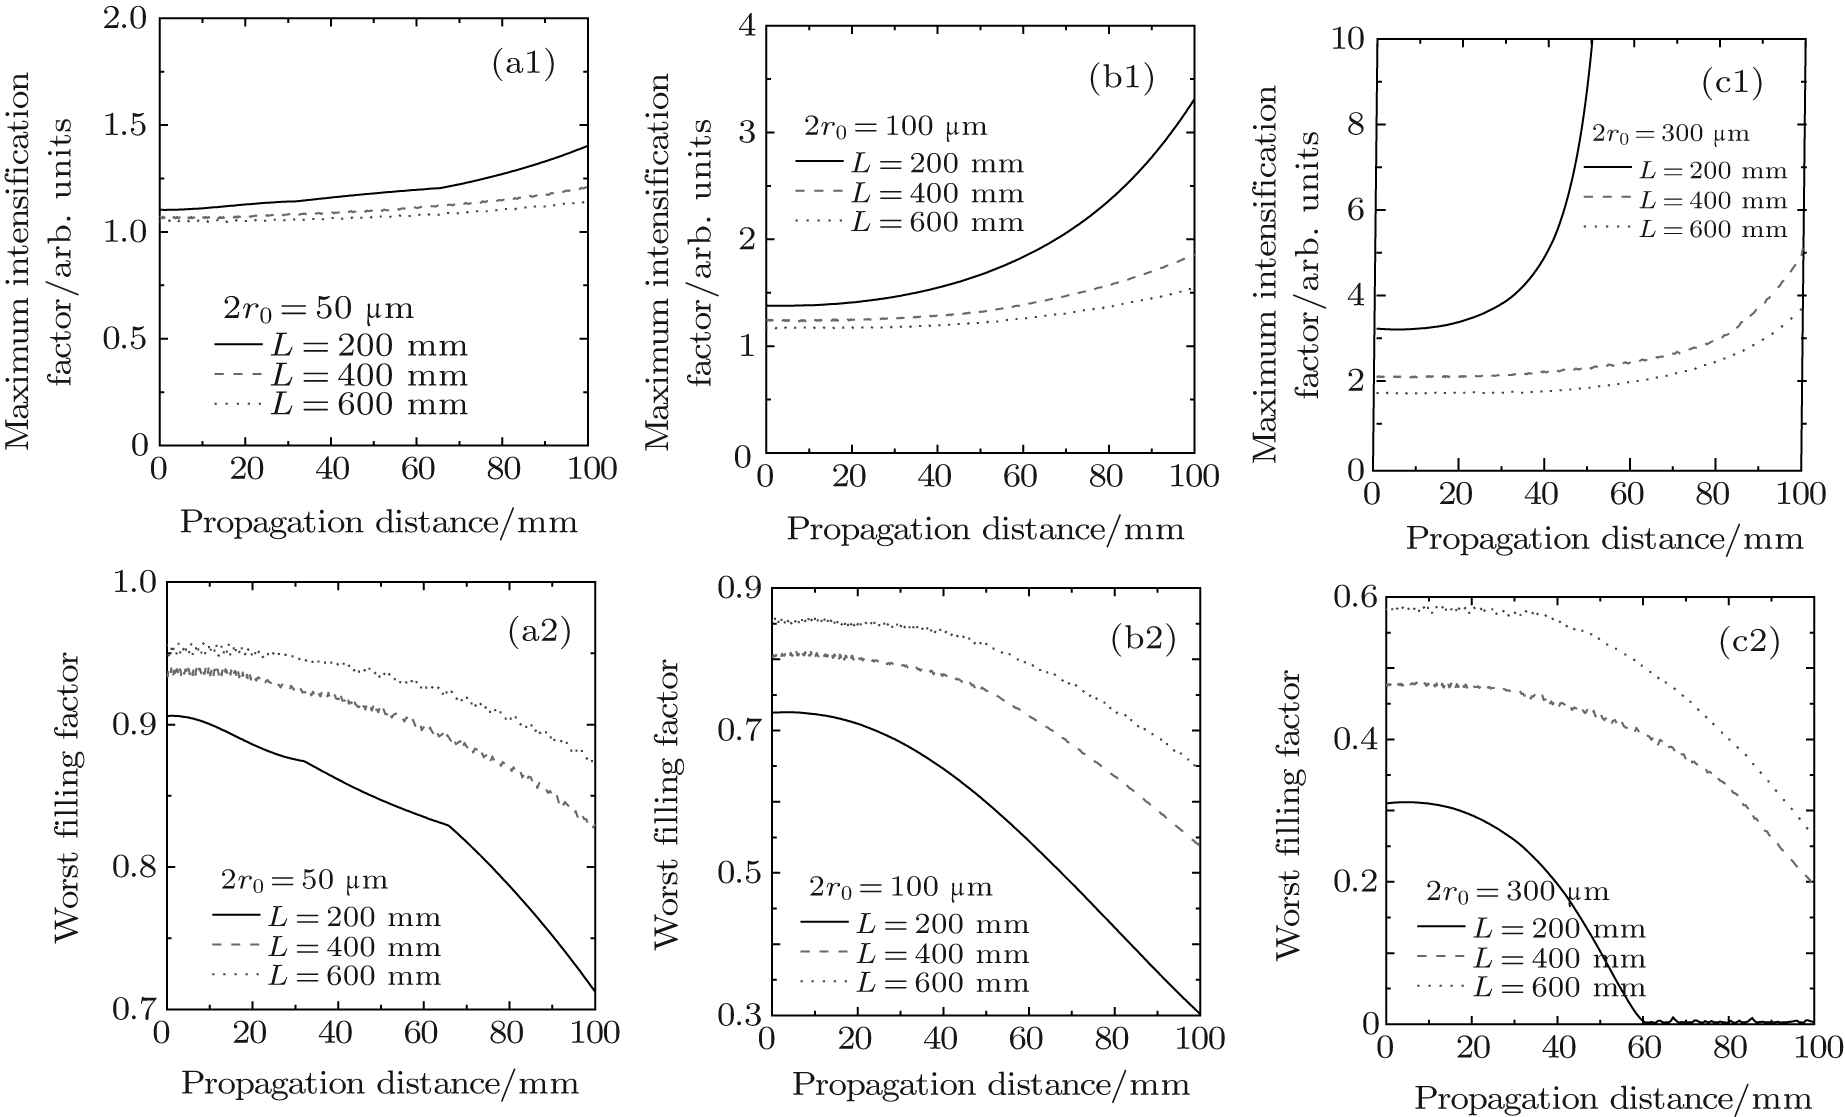
On the basis of the above study, to further study the component arrangement, the three distances between optical components (200, 400, and 600 mm) are selected to simulate the light intensity modulation in the downstream component when the contamination particle (50, 100, and 300 μ m) is located on the rear-surface or front-surface of the upstream component, and the corresponding statistical method is described in Section 2. For the rear-surface contamination particle on the upstream component, Figure 8 shows the maximum intensification factor and the worst filling factor along the propagation axis in the downstream component, where L is the distance between components. When the thickness of the downstream component is more than 40 mm, the maximum intensification factor increases gradually and the worst filling factor decreases fast, which accords with the thickness optimization result of Section 3.1. Therefore, we select the 40-mm upstream component to study the front-surface contamination particles, and figure 9 shows the corresponding maximum intensification factor and worst filling factor along the propagation axis in the downstream component. Given the statistical data in Figs. 8 and 9, the distance between optics should be coordinated with the control levels of contamination particle sizes, and the higher the control level of contamination particle sizes is, the shorter distance between optics it allows, which is helpful to make use of the space. Statistically, the light intensity modulation induced by 50 μ m particles can be smoothened out within a short distance range by diffraction effects, and the 200-mm distance between optics can achieve a high filling factor in the downstream component, which is sufficient to avoid the filamentary damage. Similarly, for 100-μ m particles, the 400-mm distance between optics makes the light intensity modulation diffract to a quite smooth state. For 300-μ m particles, the distance between optics is at least 600 mm, which is effective in decreasing the damage risk. Therefore, the distance between optics should match the cleanliness of the work environment.
 | Fig. 8. Maximum intensification factor ((a1), (b1), and (c1)) and worst filling factor ((a2), (b2), and (c2)) along the propagation axis in the downstream component based on the 50 μ m ((a1) and (a2)), 100 μ m ((b1) and (b2)), and 300 μ m ((c1) and (c2)) rear-surface particles of upstream component. |
 | Fig. 9. Maximum intensification factor ((a1), (b1), and (c1)) and worst filling factor ((a2), (b2), and (c2)) along the propagation axis in the downstream component based on the 50 μ m ((a1) and (a2)), 100 μ m ((b1) and (b2)), and 300 μ m ((c1) and (c2)) front-surface particles of upstream component. |
The design for the distance between optics is also related to the parameters of the component thickness, and they should be designed together for a certain work environment. Although setting the environmental cleanliness 50 μ m in FOA is an effective way to decrease the risk of component damage, the environmental cleanliness 50 μ m is difficult to maintain and easily decreased in the process of the laser shot. As the environmental cleanliness is decreased, the thicker components needs to be removed or replaced to avoid component damage, and the distance between optics can be re-adjusted to increase the output power and improve the beam quality. When the environmental cleanliness reaches 100 μ m, the thickness of fused silica exceeding 40 mm should be substituted for thinner optics, and the distance between optics can be kept at 200 mm for a relatively lower requirement of beam quality (FW(z) ≥ 0.6) or be set as 400 mm to obtain a high level of beam quality (FW(z) ≥ 0.8). When the environmental cleanliness reaches 300 μ m, the 40-mm thickness of fused silica can be kept to some extent, but it is better to select thinner optics of less than 30 mm, and the distance between optics can be kept at 400 mm for a lower requirement of beam quality (FW(z) ≥ 0.4) or be set as 600 mm to obtain a relatively high level of beam quality (FW(z) ≥ 0.55). For the requirement of beam quality (FW(z) ≥ 0.55) in enough space, the fused silica with a thickness of not more than 40 mm and a distance between optics of more than 600 mm can be employed universally for an environmental cleanliness of less than 300 μ m. Moreover, based on the statistical results, the beam quality can be predicted approximately under the existing optics design and environmental cleanliness. On the foundation of the predicted result, the corresponding measures to avoid component damage can be adopted in advance for an optical system that has a damage risk.
Dust particles, surface defects, and scratches may generate light intensity modulation for an ideal beam, and then generate filamentary damage to optics when the peak light intensity is higher than the damage threshold of optical components. Statistically, the appropriate component thickness and ensuring enough distance between components can avoid a reduction of the quality of the laser beam at some level and reduce the successive damage among optics, thus improving the output power of laser facilities. In the scope of this study, the environment for 3ω fused silica optics in FOA should be controlled at an environmental cleanliness of 50 μ m. For an environmental cleanliness of 50 μ m, the 200-mm distance between optics is sufficient to avoid the small-scale self-focusing damage, and component thickness does not have special requirements. For an environmental cleanliness of 100 μ m, the 400-mm distance between optics and 15-mm to 40-mm component thickness is sufficient. For an environmental cleanliness of 300 μ m, a distance between optics of over 600-mm is sufficient and the 20-mm to 30-mm component thickness should be selected. It is difficult to maintain the environmental cleanliness at 50 μ m in FOA. Therefore, to cope with the decrease of environmental cleanliness in the process of laser shot, the thickness of fused silica optics should not exceed 40 mm, which is beneficial in avoiding component damage. The assumed disturbance model can also be applied to material defects, and defects or inclusions greater than 50 μ m in size resulting from material processing should be avoided in the material interior or surface. In addition, the statistical results can also approximately predict the quality of the laser beam under the existing optics design and environmental cleanliness.
| 1 |
|
| 2 |
|
| 3 |
|
| 4 |
|
| 5 |
|
| 6 |
|
| 7 |
|
| 8 |
|
| 9 |
|
| 10 |
|
| 11 |
|
| 12 |
|
| 13 |
|
| 14 |
|
| 15 |
|
| 16 |
|
| 17 |
|
| 18 |
|
| 19 |
|
| 20 |
|