Objective identification research on cold vortex and mid-summer rainy periods in Northeast China
Gong Zhi-Qianga)†  , Feng Tai-Chen
b) , Fang Yi-Hec)
, Feng Tai-Chen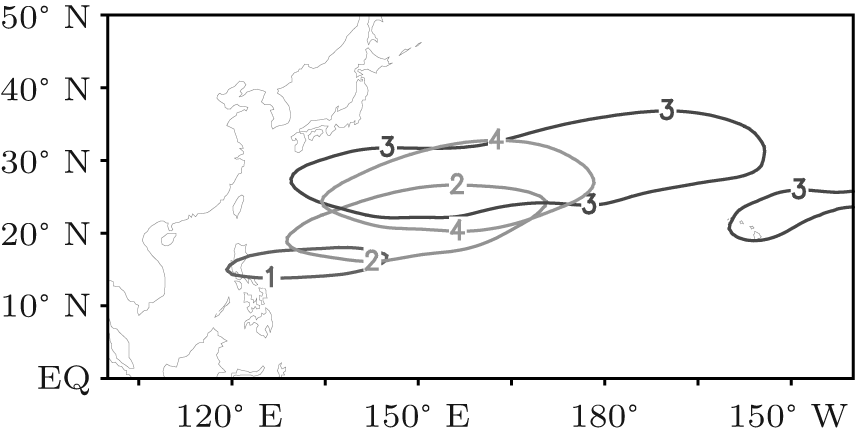
Objective identification research on cold vortex and mid-summer rainy periods in Northeast China |
|
Gong Zhi-Qiang
, Feng Tai-Chen |
| Distribution diagram of multi-year average 500-hPa subtropical high pressure in different periods. In the figure, numbers 1–4 represent the 588 contours corresponding to P1 to P4 respectively. |
| |